EUR/USD
The EUR/USD pair traded with a soft tone this Monday, having extending its latest decline to a fresh 3-week low of 1.0642 during US trading hours, and bouncing modestly from the level afterwards, to end the day around 1.0660. The macroeconomic calendar was quite busy, but was not enough to attract speculative interest around the pair. In the EU, the seasonally adjusted unemployment rate fell to 9.5% in February from 9.6% in January, and the lowest since May 2009, while the final Markit manufacturing PMIs for March, confirmed the region grew at its fastest pace in nearly six years as the final revision of the index matched the preliminary estimate of 56.2. On a negative note, the EU PPI for February came in flat, after advancing 1.1% in February, while the year-on-year price index grew by 4.5%, above estimates of 4.4.
The US manufacturing sector’s growth was also confirmed at record during March, although the final Markit PMI came in slightly lower, at 53.3 from the flash estimate of 53.4, while the ISM index beat expectations by printing 57.2, down from January’s 57.7, but still showing the overall economy grew for the 94th consecutive month. What actually weighed on the common currency, were comments from ECB Praet, who said that April’s reduction of assets purchases doesn’t signal the start of gradual reduction of QE.
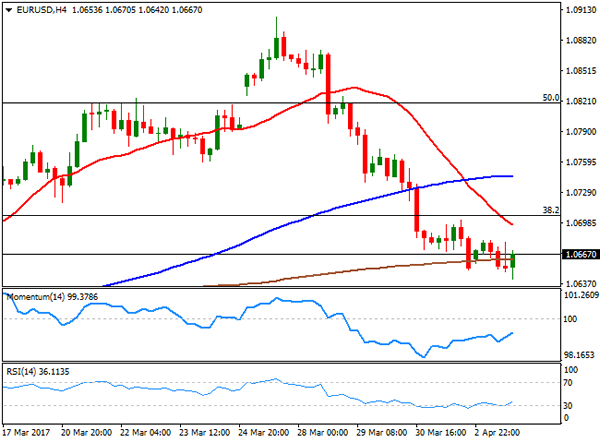
The dollar suffered a setback mid American afternoon, as stocks plunged, prompting the pairs’ recovery, although the overall risk remains towards the downside, given that the pair posted a lower low and a lower high daily basis, while trading below the critical 1.0700 threshold. In the 4 hours chart, a strongly bearish 20 SMA has crossed below the 100 SMA, both well above the current level, whilst technical indicators have managed to recover partially from their mid-lines, but remain within bearish territory, far from supporting additional gains. In fact, the pair needs to surpass the 1.0710 region to be able to recover further, whilst below 1.0620 the bearish momentum will likely accelerate with 1.0565 as the main bearish target.
Support levels: 1.0620 1.0590 1.0565
Resistance levels: 1.0710 1.0745 1.0780
USD/JPY
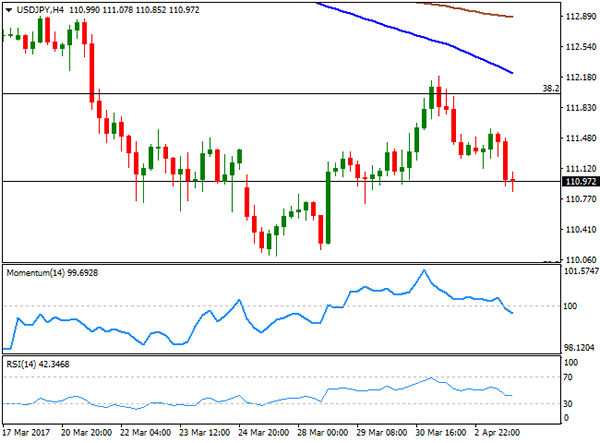
The USD/JPY pair sunk to 110.85 and settled a few pips above the level, undermined by plummeting US stocks and Treasury yields. The 10-year note benchmark fell down to 2.34%, its lowest in over a month, whist the 2-year note fell to 1.22%, as mixed US manufacturing indexes dented latest confidence in the US and fueled demand for bonds. The pair traded as high as 112.19, but was unable to settle above the 112.00 level, and quickly retreated, which left the dominant bearish trend firm in place. As for the intraday technical outlook, the 4 hour chart shows that the 100 and 200 SMAs gained bearish momentum above the current level, with the shortest detaching from the largest and currently around 112.20, whilst technical indicators continued pulling back from overbought readings and entered negative territory, now partially decelerating their declines, but still far from changing bias. The pair seems poised to retest its recent lows around 110.10, with a major Fibonacci support being at 109.90, the 50% retracement of the late 2016 monthly advance. The level should attract buyers if reached, but a break below it could see the pair entering in sell-off mode, and aim towards 108.50, mid November lows.
Support levels: 110.95 110.50 110.10
Resistance levels: 111.60 112.00 112.50
GBP/USD
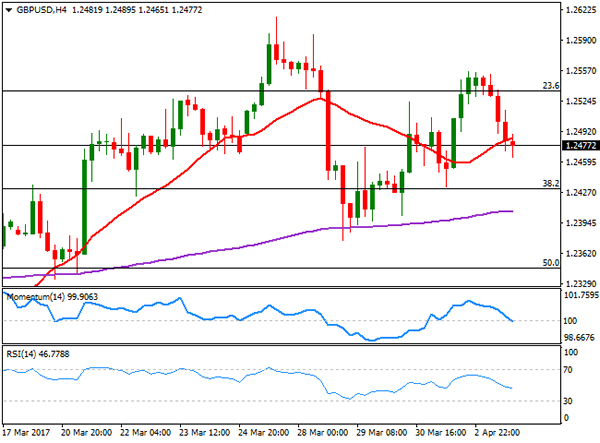
The GBP/USD pair reversed all of its Friday’s gains to settle at 1.2477, undermined by a poor UK Markit Manufacturing PMI released early Europe. The index declined to 54.2 in March from 54.6 in February, below expectations of 55.1 and the lowest reading in four months. US data, on the other hand, confirmed that the world’s largest economy continued growing at a steady pace by the end of the first quarter of the year. The daily decline, following failure to regain the 1.2600 level last week, has increased the risk of a new leg lower. The 4 hours chart supports additional declines, as the price is currently developing below its 20 SMA, whilst the Momentum indicator is crossing below the 100 level, and the RSI heading south around 46. Still the pair has a major support around 1.2430, which stands for the 38.2% retracement of the January rally. A break below this last should expose March 29th low of 1.2375, en route to 1.2330 a strong static support. The upside should remain capped by selling interest around 1.2540/60 for the bearish trend to remain in place.
Support levels: 1.2465 1.2430 1.2380
Resistance levels: 1.2510 1.2550 1.2590
GOLD
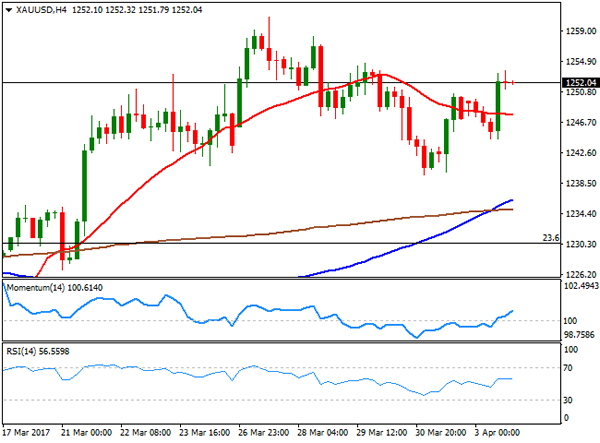
Spot gold jumped in the US afternoon to $1,253.63 a troy ounce to settle around 1,252.00, backed by falling equities and bond yields, which prompted investors towards safe-haven assets. The commodity started the day with a soft tone, as the greenback started the week with a firmer pace, but the release of mixed US data weighed on equities, indicating that confidence in the US economic future is quite fragile. Technically, the daily chart for the index shows that it bounced strongly after testing its 200 DMA, currently at 1,244.45, while the 20 DMA gained further upward strength below the largest. In the same chart, the Momentum indicator has turned flat well above its 100 level, while the RSI indicator aims north around 61, all of which favors additional advances towards 1,263.80, this year high. In the 4 hours chart, the price settled above all of its moving averages, with the 100 SMA advancing above the 200 SMA and with technical indicators holding in positive territory, with the Momentum still heading north, but the RSI flat around 56, this last amid decreasing volumes at the end of the day.
Support levels: 1.243.60 0 1,230.00 1,222.70
Resistance levels: 1,253.65 1,263.80 1,272.80
WTI CRUDE
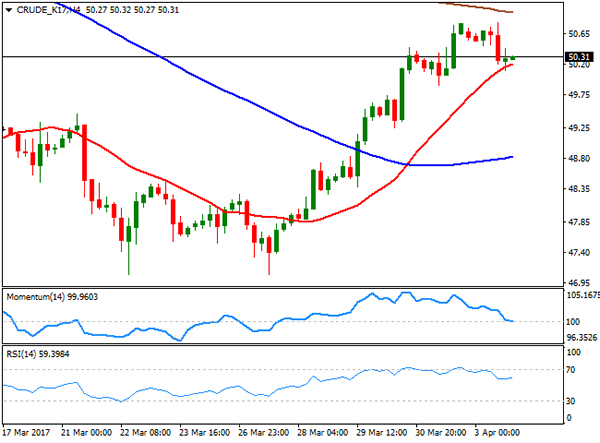
Crude oil prices retreated on Monday, with West Texas Intermediate futures ending the day at $50.30 a barrel, ending a four-day winning streak. The commodity was affected by news indicating that oil production resumed in Libya after the latest disruption, although the decline was limited, as investors remain optimism on an extension of the OPEC output cut deal. Technically, the daily chart shows that the commodity held within its Friday’s range, and above its 20 and 200 DMAs, whilst technical indicators have lost upward momentum, but hold within positive territory. In the 4 hours chart, the intraday decline was contained by a bullish 20 SMA, although the Momentum indicator retreated towards its 100 level, while the RSI indicator also retreated, but turned flat around 59, indicating a limited bearish scope as long as the index holds above the psychological 50.00 level.
Support levels: 49.90 49.50 49.00
Resistance levels: 50.60 51.25 51.90
DJIA
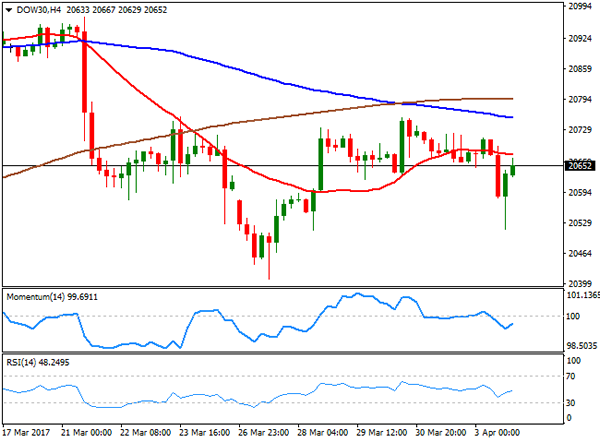
Wall Street closed marginally lower, reversing and early sharp decline. The Dow Jones Industrial Average shed 13 points and closed at 20,650.21 after trading as low as 20,515, while the Nasdaq Composite settled at 5,894.68, down 0.29% or 17 points. The S&P lost 0.16%, to 2,358.84. Leading the decline was the auto manufacturers sector, after reporting worse-than-expected sales for March, while weaker oil prices also weighed. El du Pont was the worst performer, down 0.66%, while American Express followed, ending the day 0.58% lower. UnitedHealth Group led advancers by adding 1.03%. From a technical point of view, the index has made little progress, as in the daily chart, it remained below a modestly bearish 20D DMA, while technical indicators keep consolidating below their mid-lines. In the 4 hours chart, the index settled below all of its moving averages, whilst technical indicators have recovered within bearish territory, limiting chances of a steeper decline. Below the mentioned daily low, however, the selling interest will likely accelerate, with the index then poised to challenge past week low of 20,409.
Support levels: 20,623 20,562 20,515
Resistance levels: 20,717 20,757 20,806
FTSE 100
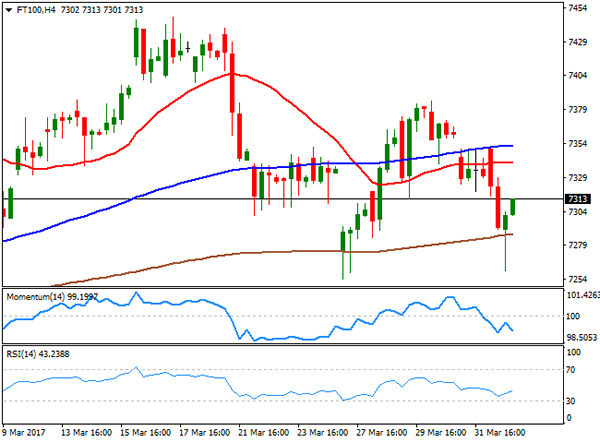
London equities edged lower at the beginning of the week, with the FTSE 100 ending the day at 7,289.69, down by 40 points, as softer-than-expected growth in the manufacturing sector weighed on the benchmark. Only 16 components closed with gains, with Provident Financial being the best performer, up 1.57%, followed by Mondi which added 1.45%. Randgold Resources made it to the top ten list by adding 1.01%. Next led decliners, shedding 3.56&, while ITV followed, ending the day 2.56% lower. The daily chart for the index presents an increasingly bearish potential, as it held below a flat 20 DMA, while technical indicators have entered negative territory, with modest downward strength. In the shorter term, and according to the 4 hours chart, the risk is also towards the downside, as the index extended its decline further below its 20 and 100 SMAs that anyway remain flat, while the Momentum indicator resumed its decline within negative territory, whilst the RSI hovers around 42.
Support levels: 7,289 7,254 7,210
Resistance levels: 7,349 7,387 7,415
DAX
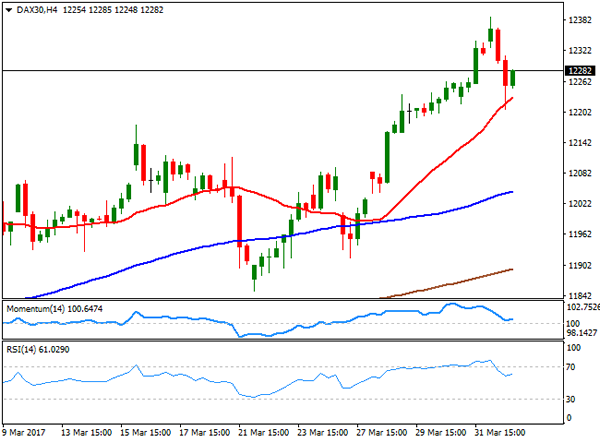
The German DAX retreated from multi-year highs and settled at 12,257.20, down 55 points this Monday, with European indexes weighed by the poor performance of banking and automotive companies. Deutsche Bank and Commerzbank led declines, losing 2.65% and 1.18% respectively, whilst Daimler was also among the worst performers, shedding 0.3%. Deutsche Boerse led advancers, adding 1.30%. The index advanced intraday up to 12,387, flirting with record highs before turning into the red, and technical readings in the daily chart show that the index is still far above a bullish 20 SMA, whilst the Momentum indicator remains flat above its 100 level, and the RSI indicator barely retreated from overbought readings, maintaining the downward risk limited. In the 4 hours chart, the index bounced after testing a bullish 20 SMA, whilst technical indicators also recovered from their mid-lines, after correcting extreme overbought readings reached at the beginning of the day, also limiting chances of a downward move, as long as the index holds above the daily low of 12,206.
Support levels: 12,248 12,206 12,167
Resistance levels: 12,298 12,341 12,399