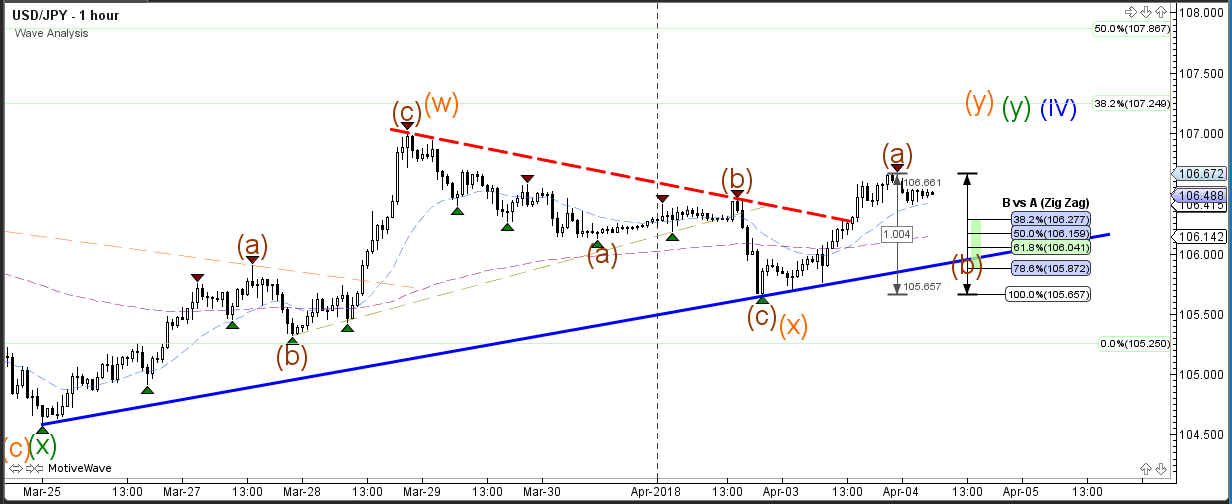
The USD/JPY seems to be building a larger consolidation zone, which could be explained by a wave 4 correction (blue). Price did break above a resistance trend line (red) but price still remains below shallow Fib levels such as the 38.2-50% Fibs. A bullish break above those levels would change the wave perspective to bullish whereas a break below support (blue) could see a bearish continuation.
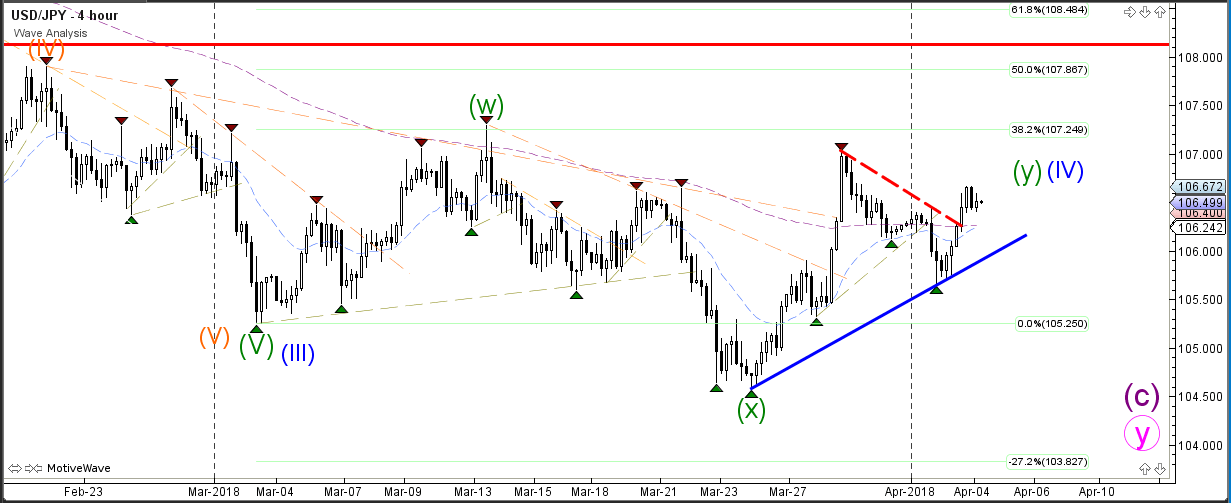
The USD/JPY seems to be building multiple ABC zigzags (brown) at the moment, which could be part of an expanded WXY (orange) correction within wave 4 (blue). Price needs to break below the support trend line (blue) before a bearish continuation is likely. For the moment a bullish push towards the Fib levels could be part of wave C (brown) as long as price stays below the 50% Fib at 107.86.