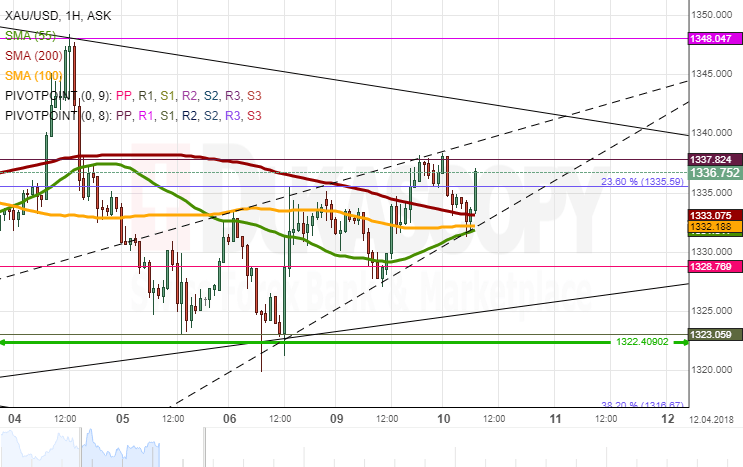
Gold demonstrated high fluctuation against the Greenback on Monday. The pair was moving along the lines of the 55– and 200-hour SMAs prior to breaching the latter to the upside.
As apparent on the chart, the rate’s movement has been bounded in two patterns, namely, a descending triangle and a short-term ascending wedge. The pair was testing the latter’s bottom boundary near 1,330.00, which also coincides with the 55- , 100– and 200-hour SMAs, early today. It is likely that this level holds strong and provides upward pressure for the pair. The nearest resistance is set by the upper triangle line at 1,340.00.
If taking into account the pair’s movement since late February, Gold should reverse from this level and initiate a new wave south down to the 1,322.40 mark later this week.