
The GBP/USD is making a bullish bounce after failing to break below the support trend line (blue). The trend however remains bearish and the current rally could only be a retracement. Price action stays bearish as long as price remains below the resistance trend line (red) but a bullish break above the resistance would indicate the completion of wave 1 (pink) and the start of wave 2.
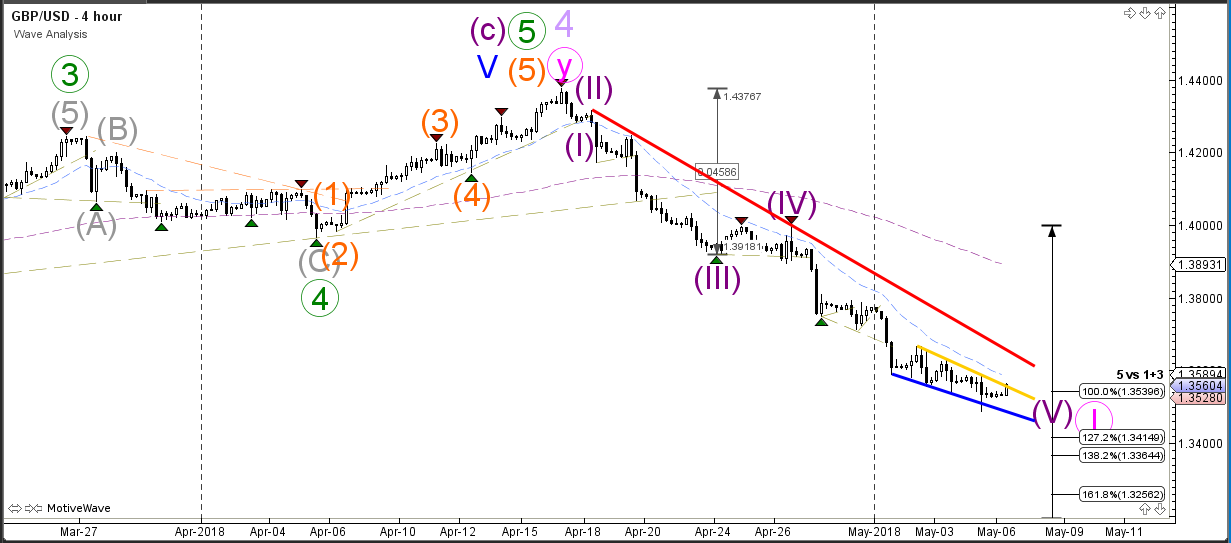
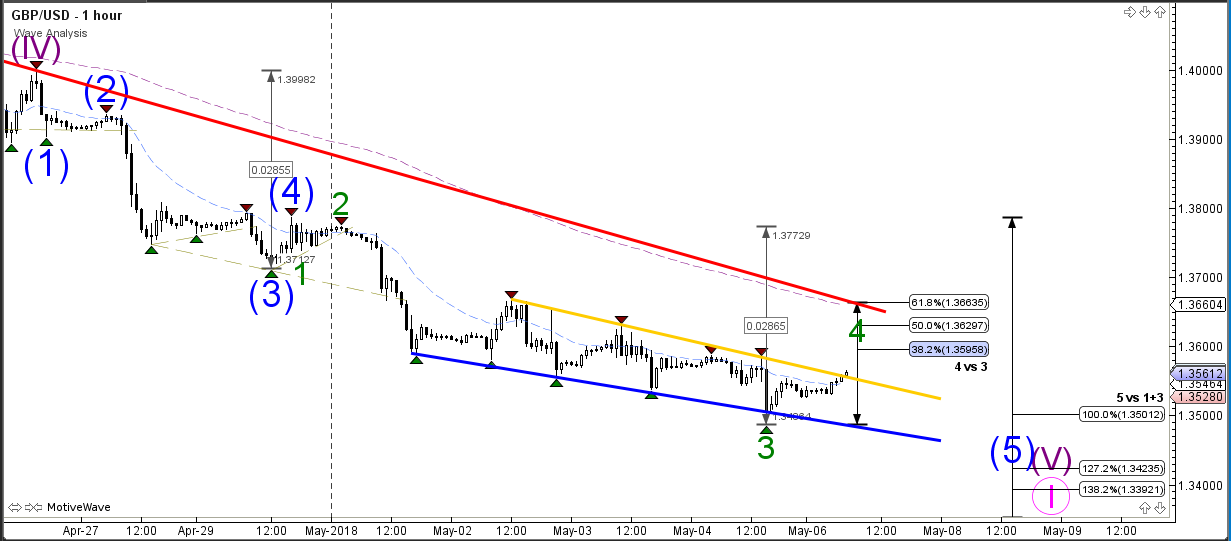
The GBP/USD could be retracing back to the Fibonacci levels of wave 4 (green) which could act as a reversal spot for a downtrend continuation. Price has probably completed the wave 4-5 (green) correction if price breaks above the 61.8% Fibonacci retracement level. Otherwise price is probably still expanding the wave 4 (green) correction.


