
Key Highlights
- The New Zealand Dollar declined sharply and moved below the 0.7000 support against the US Dollar.
- There is a major bearish trend line forming with resistance at 0.7020 on the 4-hour chart of NZD/USD.
- The pair may decline further towards the 0.6900 support in the near term.
- Today, the US Producer Price Index for April 2018 will be released, which is forecasted to increase by 0.2% (MoM).
NZDUSD Technical Analysis
The New Zealand Dollar remained in a major downtrend and broke the 0.7000 support against the US Dollar. The NZD/USD pair could accelerate declines as long as it is below 0.7020.
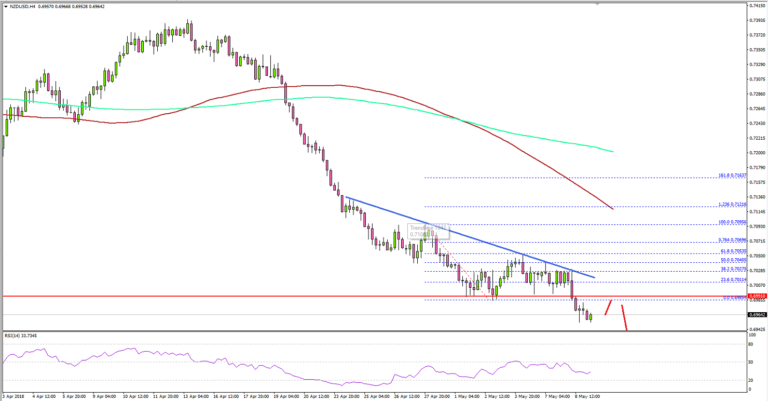
Looking at the 4-hours chart, the pair faced a lot of selling interest from the 0.7050 swing high. It declined sharply and settled below a major support at 0.7000-0.6990. Before collapsing below 0.6990, there was an upside correction towards 0.7040.
However, the upside move was capped by the 50% Fib retracement level of the last drop from the 0.7095 high to 0.6985 low. Moreover, there is a major bearish trend line forming with resistance at 0.7020 on the 4-hour chart of NZD/USD.
The pair is currently struggling to recover and is trading well below the 100 (red) and 200 (green) simple moving averages. If the current trend remains intact, the pair could test the 0.6900 level in the near term.
On the upside, resistances are seen at 0.6990, 0.7000 and 0.7020. Only a close above 0.7020 and the highlighted bearish trend line could start a substantial recovery.
Looking at the other major pairs such as EUR/USD and GBP/USD, there was a lot of bearish pressure as both pairs declined heavily. On the other hand, it seems like USD/JPY may extend gains towards the 110.00 level in the near term.
Economic Releases to Watch Today
- US Wholesale Inventories for March 2018 – Forecast +0.5%, versus +0.5% previous.
- US Producer Price Index April 2018 (MoM) – Forecast +0.2%, versus +0.3% previous.
- US Producer Price Index April 2018 (YoY) – Forecast +2.8%, versus +3.0% previous.
- US Producer Price Index Ex Food and Energy April 2018 (MoM) – Forecast +0.2%, versus +0.3% previous.
- US Producer Price Index Ex Food and Energy April 2018 (YoY) – Forecast +2.4%, versus +2.7% previous.


