.
EUR/USD
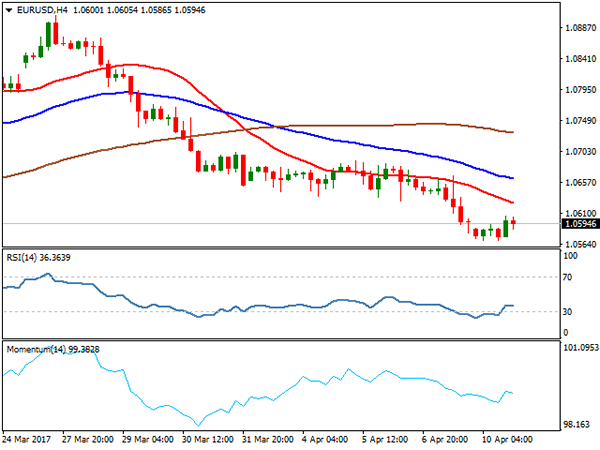
The pair traded within narrow range during the most of European session and holding above new marginally lower one-month low at 1.0570. Lack of data on Monday kept the single currency against dollar in narrow consolidation after Friday’s strong fall when the pair ended trading down 0.43%.Strong bearish sentiment, established in last three days of the past week and boosted by fresh geopolitical tensions in the Middle East after US army attacked the airbase of Syrian army, failed to extend bear-leg from 1.0689, Apr 05 lower top, despite long bearish candle of Friday that was expected to produce stronger downside pressure. In addition, the greenback paused fresh rally that was sparked after Friday’s attack on Syria and mixed jobs data last Friday.The euro briefly probed below key near-term support at 1.0584, base of daily Ichimoku cloud, but was unable to hold losses below cloud and generate stronger bearish signal.Daily cloud base now acts as solid support for recovery that commenced in early American session, signalled by reversal of daily chart slow stochastic after being deeply oversold.However, corrective attempts during mid / late American session remained capped by daily cloud top at 1.0611, as investors were awaiting speech from Fed Chair Janet Yellen to get more information about US policy, the timing of Fed’s next interest rates hike and to possibly learn about Fed’s plan to start shrinking its massive $4.5 trillion balance sheet.Technical studies are in negative mode on daily chart and maintain downside risk, which would be accelerated on firm break below daily Ichimoku cloud.
Resistance: 1.0611; 1.0622; 1.0668; 1.0700
Support: 1.0584; 1.0570; 1.0525; 1.0494
USD/JPY
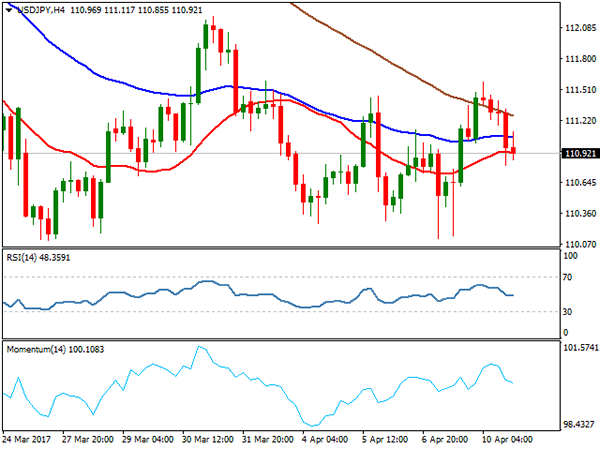
The USDJPY pair extended bounce from temporary base at 110.00 zone, after last Friday’s repeated downside rejection and subsequent bounce that managed to close briefly above 111.00 handle and sideline immediate downside risk. Recovery extension above daily Tenkan-sen line at 111.16 was seen as another supportive factor for stronger recovery, on daily close above the indicator which would then turn to solid support for further recovery. Probes above Tenkan-sen pivot remained capped by falling 20SMA at 111.60 in late Asian trading on Monday and the pair remained at the back foot during European and American session. Formation of double-bottom at 110.00 that is bullish signal, was expected to support scenario of stronger correction after multiple downside rejections at 110.00 zone.So far, the pair was unable to sustain break above Tenkan-sen barrier, diminishing hopes of stronger recovery that requires confirmation on firm break above daily Tenkan-sen and weekly Ichimoku cloud top at 111.36.While these pivotal barriers stay intact, prospects for extended correction will be limited.In such scenario, the pair may hold in extended consolidation between 110 base and weekly cloud top, before establishing in fresh direction, with mixed technicals on lower timeframes supporting the notion.Rising geopolitical tensions that increase demand for safe-haven assets may offer support to Japanese yen for renewed attack at 110 trigger and spark fresh extension of bear-leg from 118.66, Dec 15 peak that is supported by firm bearish setup of daily studies.
Resistance: 111.16; 111.36; 111.60; 112.00
Support: 110.80; 110.53; 110.12; 109.90
GBP/USD
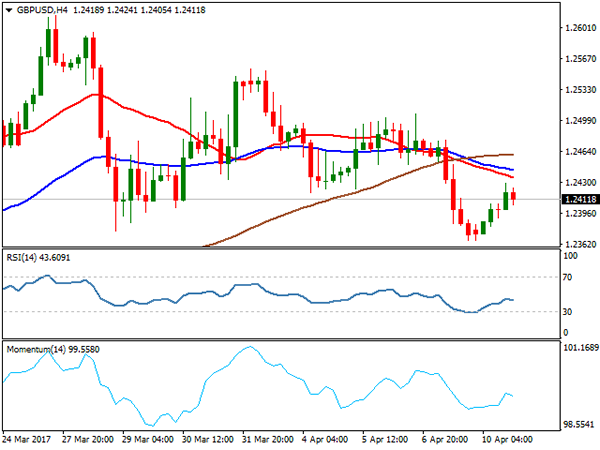
The GBPUSD currency pair recovered a half of Friday’s 1.2477/1.2365 fall when it ended trading with 0.9% loss for the day. Strong bearish acceleration was contained by daily Kijun-sen line at 1.2362, which guards another strong support at 1.2346, daily Ichimoku cloud base.Despite expectations that long red daily candle that was formed on Friday’s fall will continue to weigh and trigger fresh extension of bear-leg from 1.2555 lower top, the pair managed to stabilize above daily Kijun-sen support and bounce back.Recovery was capped by the top of narrowing daily Ichimoku cloud at 1.2426, which marks solid barrier, together with broken Fibonacci 38.2% retracement of 1.2108/1.2615, 14/27 Mar rally, that is expected ideally limit recovery attempts.Daily MA’s in bearish setup and rising bearish momentum, keep negative scenario in play, as daily cloud is twisting at the beginning of next week and may support fresh downside action.However, emerging out of daily cloud is seen as minimum requirement to signal fresh near-term direction.The upper trigger above daily cloud top is daily Tenkan-sen line at 1.2460, regain of which would be seen as strong bullish signal.Traders are looking for Tuesday’s release of UK inflation data on Tuesday, for fresh signals.Inflation is holding above projected levels that are seen as good signal for British economy.
Annualized CPI is forecasted at 2.3% in Feb and release at/above this level would be supportive for sterling. On the other side, pound may come under increased pressure on release below consensus that may also cool down the idea of rate hike towards the end of the year.
Resistance: 1.2426; 1.2460; 1.2477; 1.2505
Support: 1.2400; 1.2365; 1.2346; 1.2300
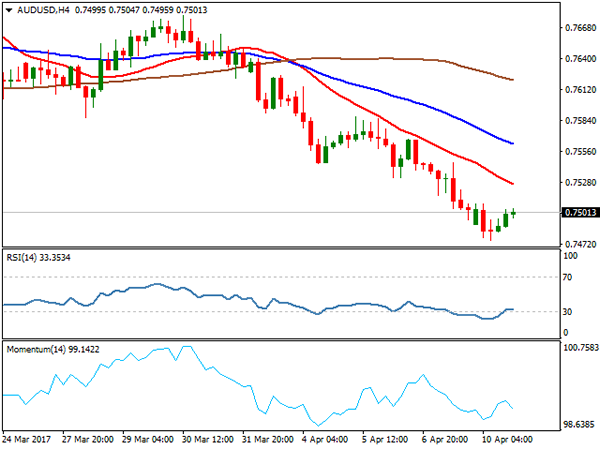
AUDUSD
The Aussie dollar extended strong losses on last Thu/Fri that broke below strong supports at 0.7550 (200SMA); 0.7523 (Fibonacci 38.2% retracement of broader 0.7158/0.7749 rally) and 0.7512 (100SMA) and eventually broke below key short-term support at 0.7489, Mar 09 low, confirming full retracement of 0.7489/0.7747 upleg.The pair hit fresh low at 0.7475, the lowest since Jan 17, above which, near-term consolidation is under way. Firmly bearish technical studies on daily chart favour further weakness, which needs bearish signal on close below 0.7489 pivot. Such scenario would trigger fresh bearish acceleration towards next key support at 0.7449 (base of thick daily Ichimoku cloud) and look for another strong bearish signal on break below this support. Meantime, the pair could extend narrow consolidation above fresh low at 0.7475, which was so far capped by initial barrier – 100SMA.Extended upticks should not exceed next strong barrier, offered by 200SMA, as break here would generate fresh bullish signal and sideline immediate downside threats.
Resistance: 0.7512; 0.7526; 0.7550; 0.7576
Support: 0.7489; 0.7475; 0.7449; 0.7400
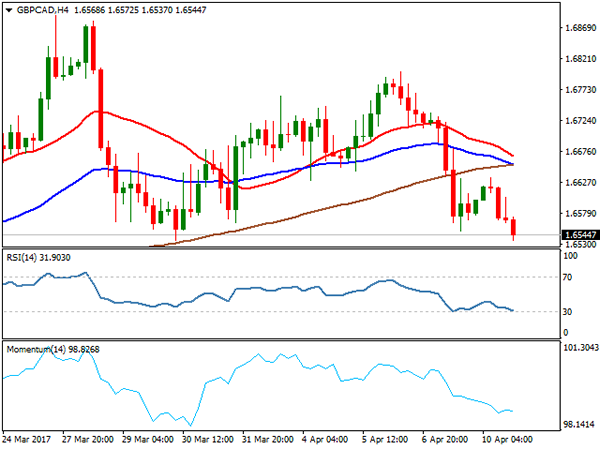
GBPCAD
The GBPCAD cross remained in red on Monday and extended strong bearish acceleration from last Thursday’s high at 1.6800, to retest former low of Mar 30 at 1.6535. The pair is maintaining bearish pressure that increased on break below 200SMA (1.6694) and 20SMA (1.6610) which now acts as initial resistance and capped recovery attempts during early hours of the American session.Upbeat numbers in Canada’s Housing Starts (253.7K in Mar vs forecasted 216K and 214.3K in Feb) helped Canadian dollar to firm further against its British counterpart.Sustained break below 1.6535 pivot is needed to complete Failure Swing pattern on daily chart and generate strong bearish signal for fresh downside acceleration, as support at 1.6535 also marks 61.8% Fibonacci retracement of 1.6311/1.6888 ( Mar 16/27 rally) and acts as strong downside trigger.Broken daily Kijun-sen line at 1.6589 which so far managed to hold upticks, marks immediate resistance, ahead of upper pivots at 1.6668 (daily Tenkan-sen) and 1.6694 (200SMA), break of which would generate fresh bullish signal and turn focus higher.
Resistance: 1.6589; 1.6635; 1.6668; 1.6694
Support: 1.6535; 1.6500; 1.6448; 1.6400
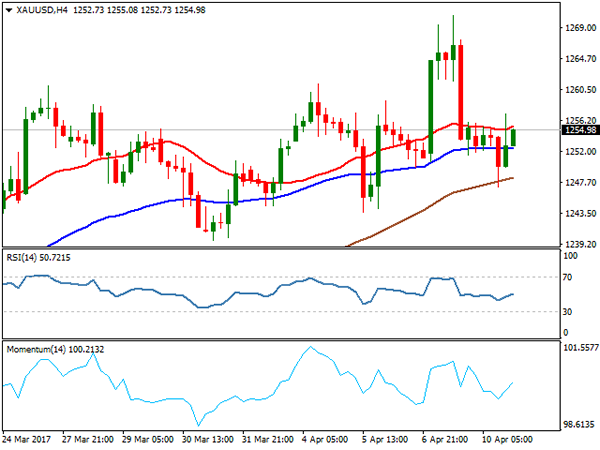
GOLD
Spot Gold slipped further on Monday and hit low at $1247, following last Friday’s strong spike to $1270, fresh five-month high and subsequent quick pullback that marked strong upside rejection and left daily candle with long upper wick on Friday. Another false break above key barriers at $1257 (200SMA) and former top of Feb 27 at $1263, weakened near-term structure and introduced fresh downside risk.As Friday’s daily candle continues to weigh, gold price lost its initial footstep at $1250 zone and shifted risk lower. Fresh bears off $1270 peak may extend to $ 1243 (rising daily 20SMA / Fibonacci 38.2% retracement of $1195/$1270 rally on repeated close below 200SMA and weak studies on 1 & 4-hour charts.The yellow metal came under pressure on expectations that US Federal Reserve will press ahead with interest rate hikes that counterweighs rising geopolitical concerns over Syri and North Korea that should be boosting demand for safe-haven gold.Gold is expected to struggle at the upside under current circumstances, however, downside attempts should be also limited. Ideally, dips should be contained at $1243 zone in order to avoid deeper pullback on violation of the latter support that may also unmask another key support at $1234 (top of thick daily Ichimoku cloud).On the other side, return above 200SMA would improve the sentiment.Spot Gold ended Monday’s trading in long-legged Doji candle that signals strong near-term indecision.
Resistance: 1255; 1257; 1263; 1270
Support: 1253; 1250; 1247; 1243
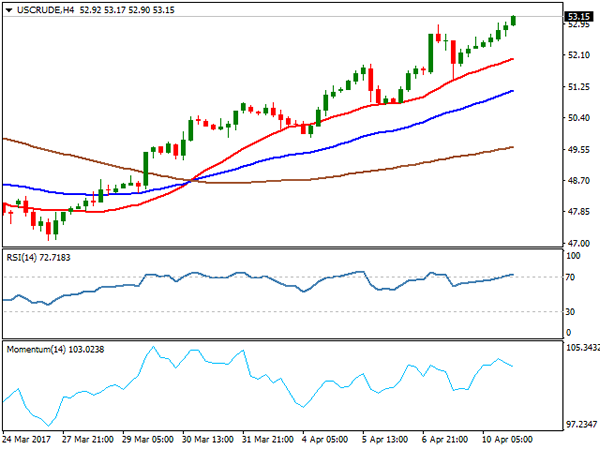
WTI CRUDE OIL
WTI oil price remained in steep ascend and rose above $53.00 per barrel on Monday, in the third consecutive bullish day. Oil price regained support on hopes of OPEC and non-OPEC oil producers will reach agreement on extension of current program for reduction of oil output that will ease pressure from global oversupply and boost oil prices.Last week’s break above psychological $50.00 per barrel level was initial bullish signal, with oil price being boosted by rising geopolitical tensions over North Korea and Syria that also raised tensions between USA and Russia. Such environment is seen ideal for oil prices to rise strongly.WTI contract rose by nearly S1 on Monday, on extension that penetrated into thin daily Ichimoku cloud and broke above barrier at $53.13 (Fibonacci 76.4% retracement of $55.01/$47.06 descend). Fresh bullish acceleration is looking for break above daily cloud (cloud top lies at $53.44) to get fresh bullish signal for acceleration towards key short-term barriers at $55.00 zone (recovery peaks of Jan/Feb 2017).The price is supported by firmly bullish daily and weekly technicals, as well as growing geopolitical tensions. Break above daily Ichimoku cloud would open %53.78 (Mar 07 high) and levels above $54.00, r=en-route towards $55 zone targets.Shallow corrections are seen interrupting rallies, with broken Fibonacci 61.8% barrier, expected to ideally contain and guard 55SMA support at $51.64.
Resistance: 53.44; 53.78; 54.50; 55.00
Support: 52.29; 51.97; 51.64; 51.49
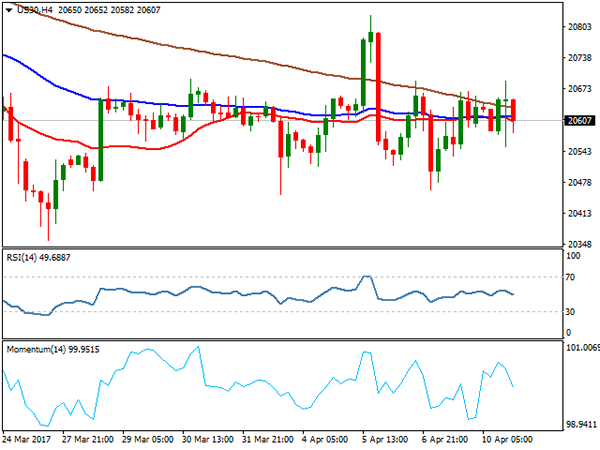
DJIA
Dow ended another day in directionless mode, as Monday’s trading was shaped in Doji candle. Choppy Monday’s session has ended with slight bullish alignment on gains of energy stocks that offset losses in financial stocks. Quiet trading in past two days is seen on stock markets awaiting corporate quarterly earnings, due later this week. Also, choppy trading was caused by rising geopolitical tensions as trading starts to slow on holiday-shortened week.No significant signals seen from technical studies, as daily chart shows mixed signals on conflicting indicators, however, prevailing bullish bias was dented by recent penetration into daily Ichimoku cloud that was underpinning bullish action since Nov 2016.Stronger bullish signals could be expected by break above daily Kijun-sen line at 20692 and extension above last week’s spike-high at 20827.Conversely, weakness through last week’s lows at 20460/20450 would soften the structure further and risk fresh weakness.
Resistance: 20659; 20692; 20750; 20827
Support: 20551;20500; 20450; 20400
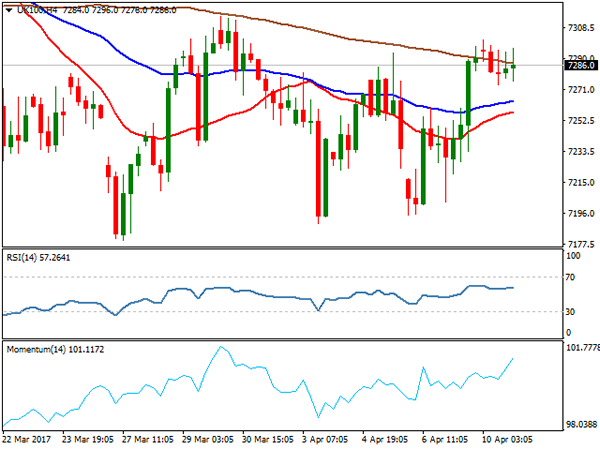
FTSE 100
FTSE index stayed under fresh recovery high at 7301 on Monday, ending daily trading in red at 7286, after previous two day’s strong rally. Growing downside risk that was seen on penetration into daily Ichimoku cloud last week, has been neutralized on strong rally that emerged above rising daily cloud that continued to underpin the advance. Weaker pound also helped the index to recover and shift near-term focus higher.The price is looking key n=barriers at 7311/15 (daily Kijun-sen line / recovery top of Mar 30) that also marks the top of near-term congestion between 7179 and 7315 and 50% retracement of 7444/7179 pullback.Sustained break above 7315 is needed to generate firmer bullish signal for fresh recovery towards targets at 7343 and 7381.Daily Tenkan-sen and daily cloud top at 7252/41 are expected to hold extended downticks.
Resistance: 7311; 7315; 7343; 7381
Support: 7280; 7252; 7241; 7203
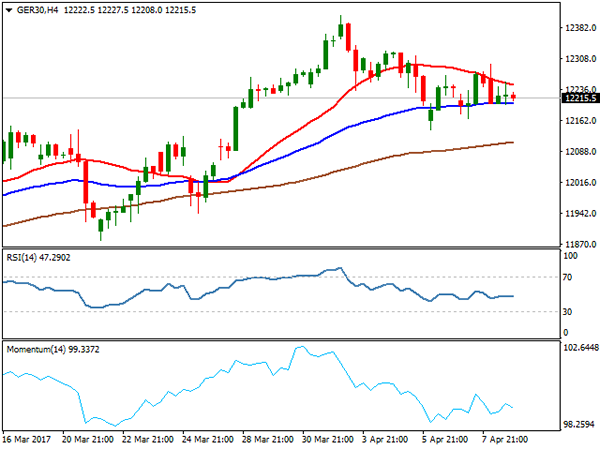
DAX
DAX closed in red on Monday after two bullish days at the end of last week, but series of higher g=highs and higher lows formed near-term bull-leg from 12141 (Apr 06 low). The action was contained and remains underpinned by rising 20SMA (currently at 12151). Overall bullish structure on the daily chart is supportive for further recovery, while 20SMA underpins. However, firm break above daily Tenkan-sen at 12275 is needed to v=confirm recovery and open next target at 12307 (Fibonacci 61.8% retracement). On the downside, Monday’s low at 12200 marks initial support, followed by pivots at 12151 (20SMA) and 12144 / 41 (daily Kijun-sen / Apr 6 trough), loss of which would generate stronger bearish signal.
Resistance: 12275l 12307; 12346; 12410
Support: 12200 12167; 12141; 12070;