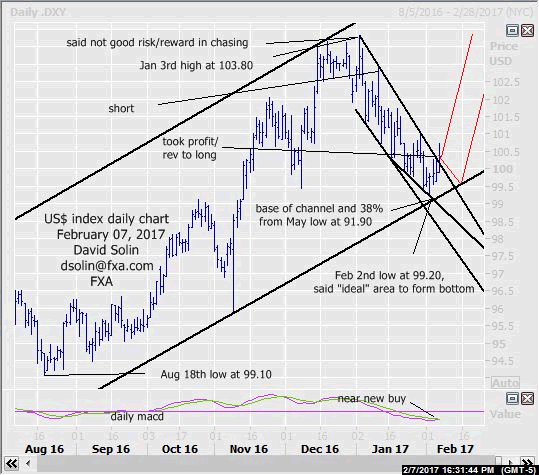
Nearer term $ index outlook :
In the Jan 31st email, once again said that there was still no confirmation of a bottom but that lots of positives suggested that an important low may finally be near. The market pushed to a slight new low at 99.20 on Feb 2nd, within that previously discussed ‘ideal’ area to form a more important low at 99.00/25 (38% retracement and base of the bullish channel from May low at 91.90, multi-week falling support line) before bouncing. Note that the slowing downside momentum, technicals that are turning positive (see daily macd) and view of that month or 2 of downside since late Dec but with a resumption of the longer term gains above 103.80 after (see longer term below), all support this bottom/bottoming view. Though there is still no confirmation ‘pattern-wise’ (5 waves up for example), the market has broken above that bearish trendline from the Jan high and increasing the likelihood of such a bottom/bottoming (see in red on daily chart below). Nearby resistance is seen at 100.80/95 and 101.45/60 (38% retracement from the Jan 3rd high at 103.80). Key support remains in that 100.00/25 area. Bottom line : still no confirmation of a bottom ‘pattern-wise’, but the likelihood of an important low in that long discussed ‘ideal’ 100.00/25 area has increased.
Strategy/position:
Short from the Jan 11th sell at 102.80 and for now, would take profit (and if more aggressive) also reverse to the long side here (currently at 100.35 for 245 ticks). For now, would stop on a close 15 ticks below the base of the channel from May. As discussed above, there is still no confirmation of a low ‘pattern-wise’, but the likelihood has increased enough to warrant taking profit (and even reversing to the long side). Note too that even a break below the base of that channel would not abort the bigger picture bullish view, but would suggest a further period of bottoming.
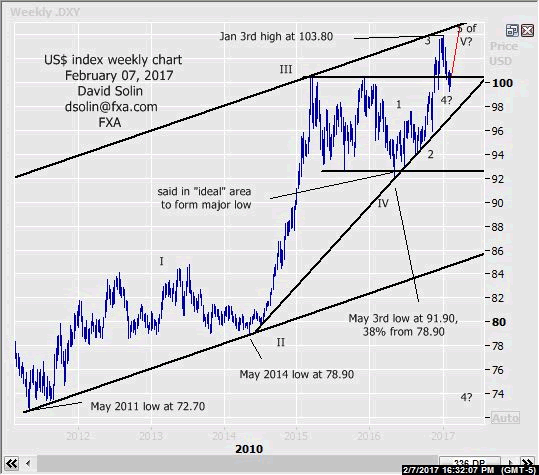
Long term outlook:
No change in the longer term bullish view since May as well as the view since late Dec of a month or 2 of correcting within this longer term uptrend. Note that the action from the Jan 3rd high at 103.80 is seen as a correction (wave 4 in the rally from the May low at 91.90) and with eventual new highs above 103.80 after (within wave 5). As discussed above, the likelihood of a bottom has increased and with larger upmoves generally beginning with smaller ones, there is potential of that more major low as well (end of downside correction from Jan). Bottom line : long term bullish view since May remains with increasing potential of a more important bottom and new highs above 103.80 ahead.
Strategy/position:
With some potential of a more important bottom forming, would also switch that longer term bias to the bullish side here (currently at 100.35).
Current:
Near term : long Feb 7th at 100.35, still no confirmation of a bottom (some risk for more bottoming).
Last : short Jan 11th at 102.80, took profit Feb 7th at 100.35 (235 ticks).
Longer term : with increased potential of more important low, also switch bias to bull Feb 7th at 100.35.
Last: : bull bias Aug 24th at 94.75 to neutral Oct 28th at 98.35.