
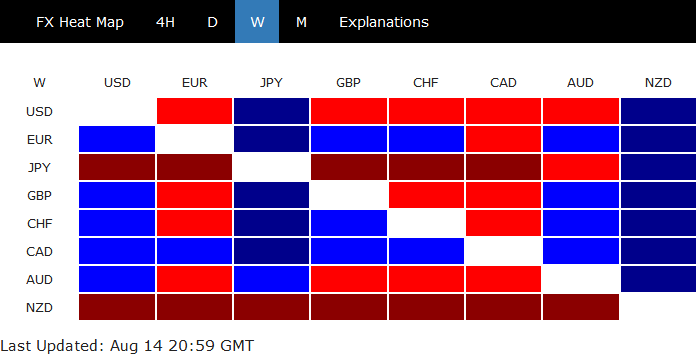
It was a rather mixed week where there were conditions for a Dollar rebound, with surging treasury yield and correction in Gold. Yet, no apparent rally was seen. Yen was sold off generally, partly on coronavirus and recovery optimism. But the Swiss Franc was firm together with Euro.
Strong rally in iron ore prices and risk-on sentiments gave no boost to Australian Dollar. Commodity currencies diverged with Canadian Dollar ended as the strongest one, with some help from resilience in WTI oil price above 42. But New Zealand Dollar was the weakest one on RBNZ easing and coronavirus lockdown.
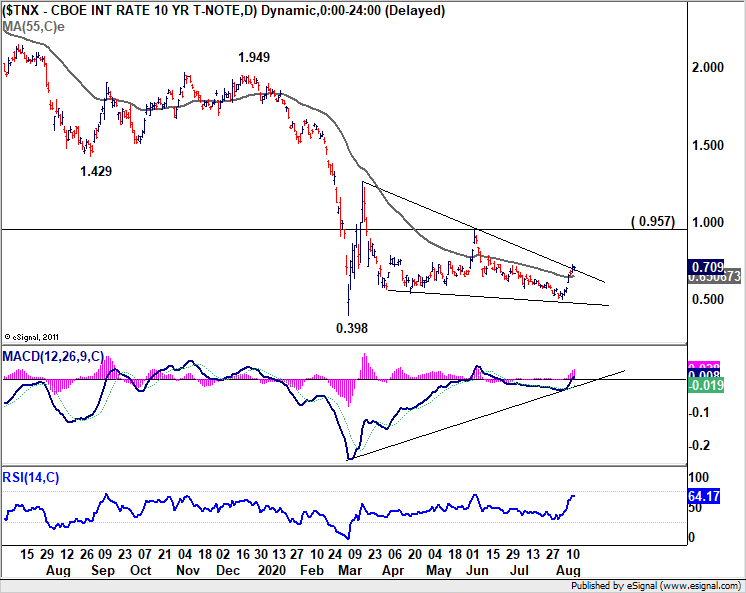
10- and 30-year yield staged strong rally
The strong rally in long term US treasury yields could be partly attributed a round of large debt auctions. Still, there was certain optimism on economic recovery based on recent data, including NFP, CPI and PPI. Also, initial jobless claims dropped back below 1m level was another positive. Vaccines and treatment research appeared to be on the right track too.
10-year yield closed up strongly at 0.709, above 0.7 handle for the first time since early July. The break of 55 day EMA and near term trend line resistance are both bullish developments, together with bullish convergence condition in daily MACD. It remains to be seen if TNX will reverse quickly like it did in June. But for now, as long as 55 day EMA (now at 0.650) holds, there is prospect of revisiting 0.957 resistance.
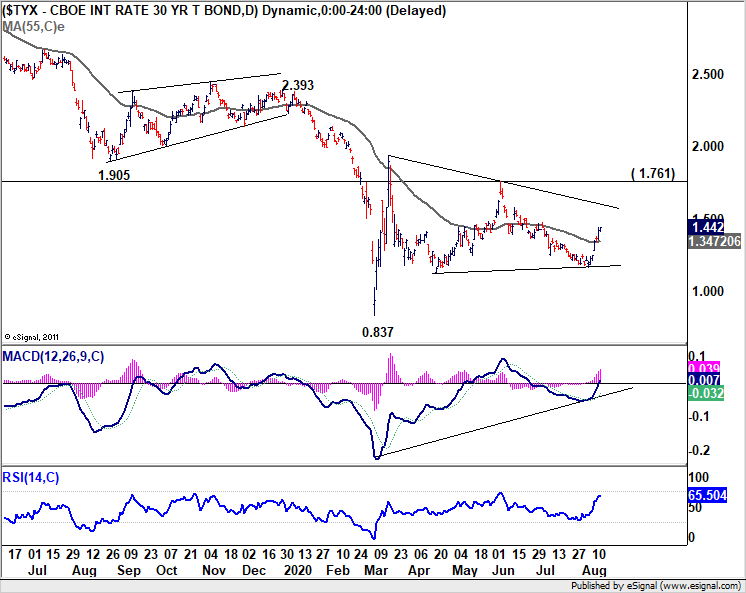
Similar development was seen in 30-year yield, which surged to close t 1.442. As long as 55 day EMA (now at 1.347) holds, there is prospect of retesting 1.761 resistance too.
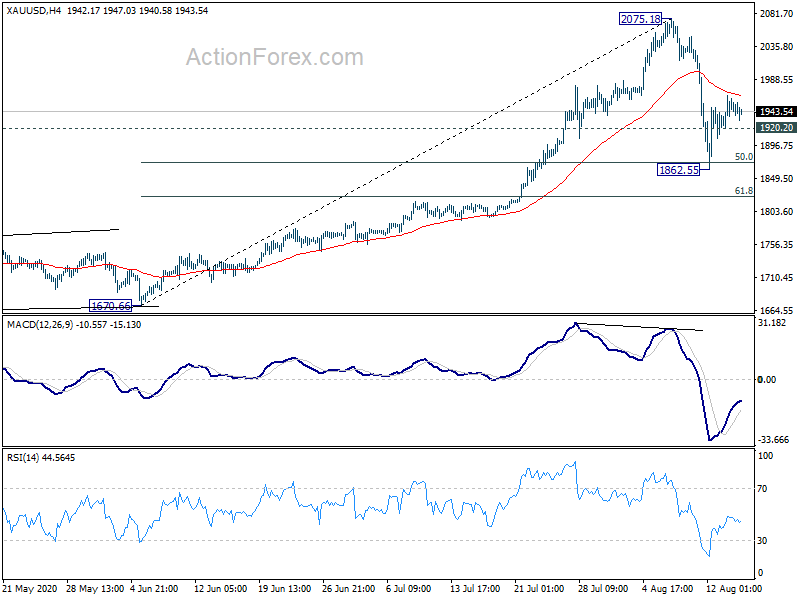
Gold turned into steep correction, more time for the pattern to complete
Gold turned into a steep correction last week as the fall from 2075.18 record high reached as low as 1862.55. While the pull back was sharper and deeper than expected, gold did draw some support from 50% retracement of 1670.66 to 2075.18 at 1872.92 and recovered.
Some more time is still needed for the corrective pattern to unfold and a break to new record shouldn’t happen soon. The only question is which pattern it would take. A break of 1920.20 support would likely bring another selloff through 1862.55. Sustained break of 4 hour 55 EMA (now at 1966.91) would target a test on 2075.18 instead.
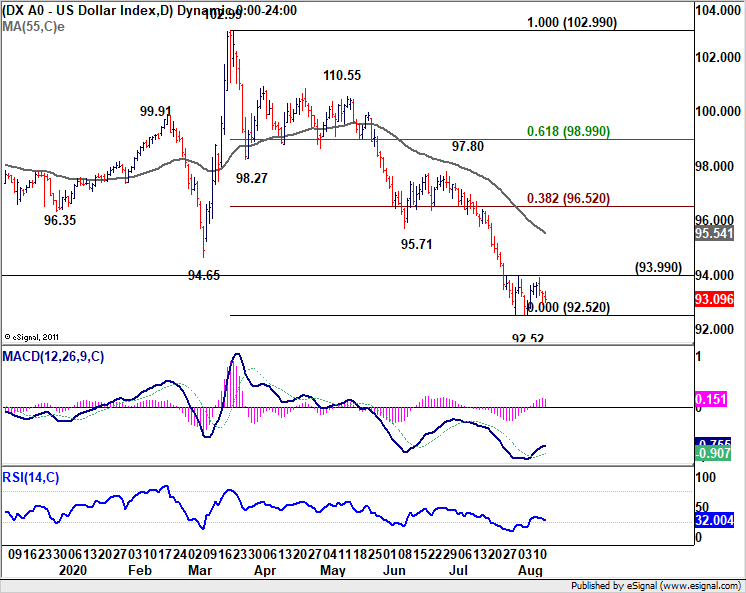
Dollar index failed 93.99 resistance, more downside still in favor
The above two developments should logically be reflected in corresponding rebound in Dollar too. But it didn’t happen, except versus Yen. Dollar index failed to break through 93.99 near term resistance turned south to extend range trading. As long as 93.99 holds, another fall is mildly in favor through 92.52 to resume the whole decline from 102.99. nevertheless, break of 93.99 should confirm short term bottoming and bring rebound to 55 day EMA (now at 95.54) first.
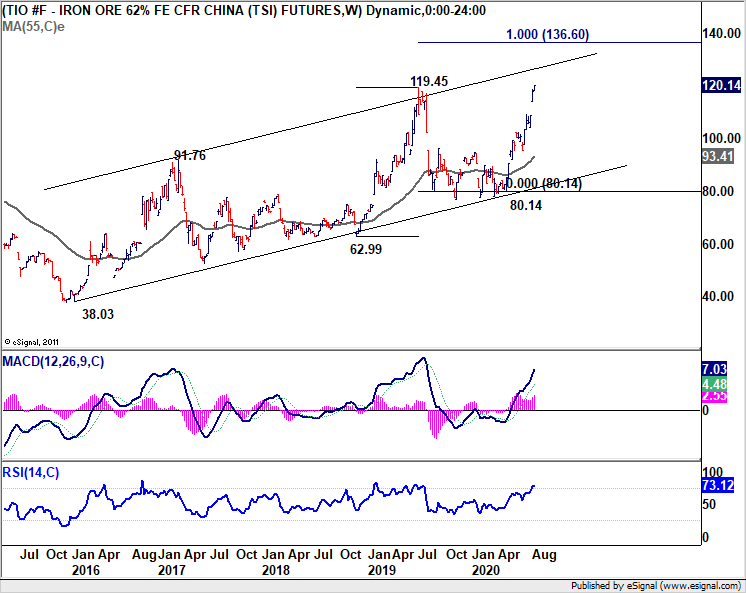
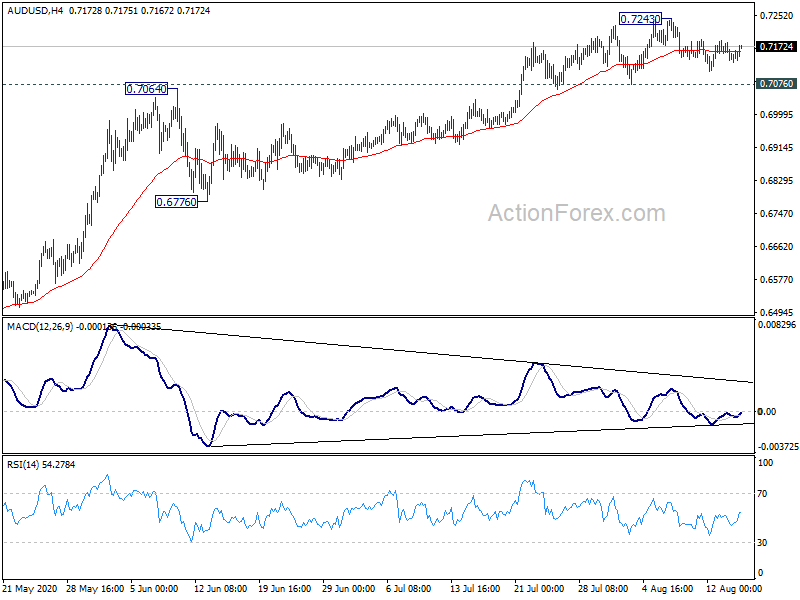
Aussie got no lift form surging iron ore price and stabilizing sentiments in Asia
One more development to note is the lack of strength seen in Australian Dollar, even though conditions were there for rise. Iron ore price surged again in the past two weeks, with TIO breaking prior high of 119.45 to resume the medium term up trend. It could now be targeting 100% projection of 62.99 to 119.45 from 80.14 at 136.60.
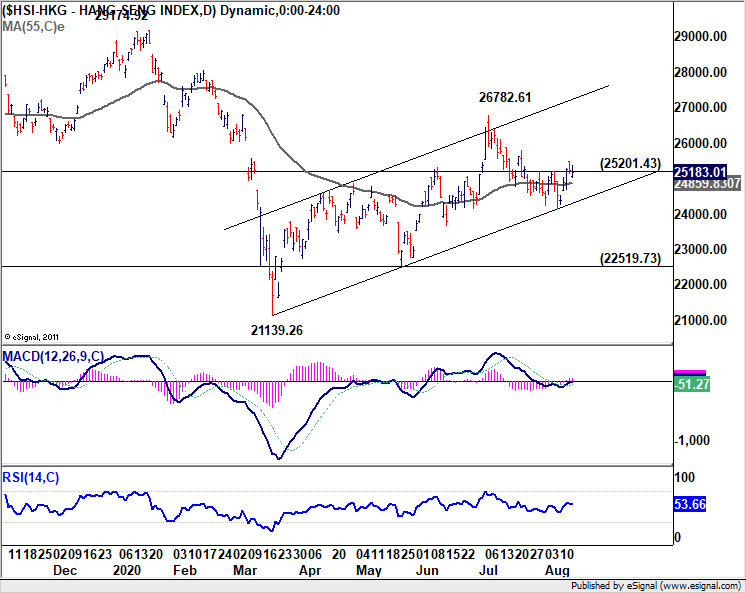
Hong Kong HSI’s rebound kept near term rising channel intact. That’s a sign that investors are not too concerned with recent escalations in US-China tension. The corrective-looking rebound from 21139.26 could extend through 26782.61 before completion.
AUD/NZD finally took out 1.0880 resistance to resume the rebound from 0.9994. The up trend should extend to 61.8% projection of 0.9994 to 1.0880 from 1.0565 at 1.1113 next. But that’s more due to Kiwi’s own weakness. The rally didn’t boost Aussie much elsewhere.
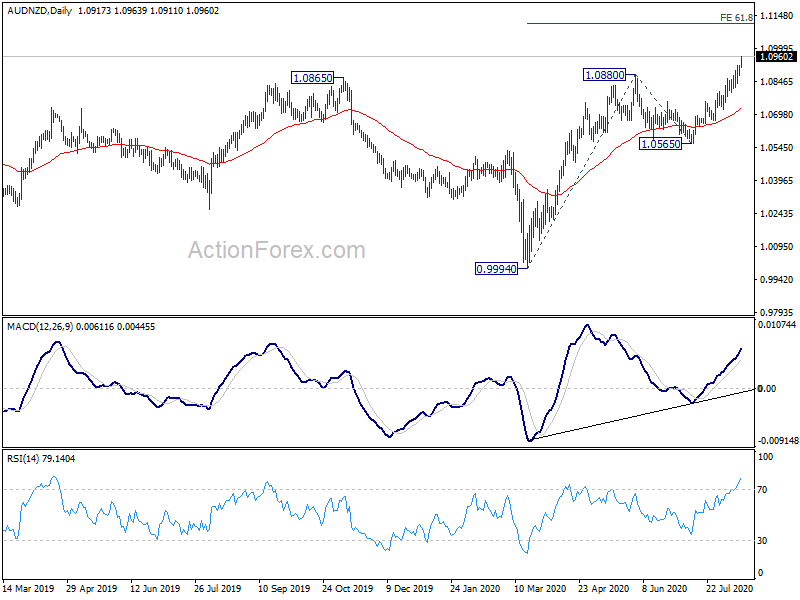
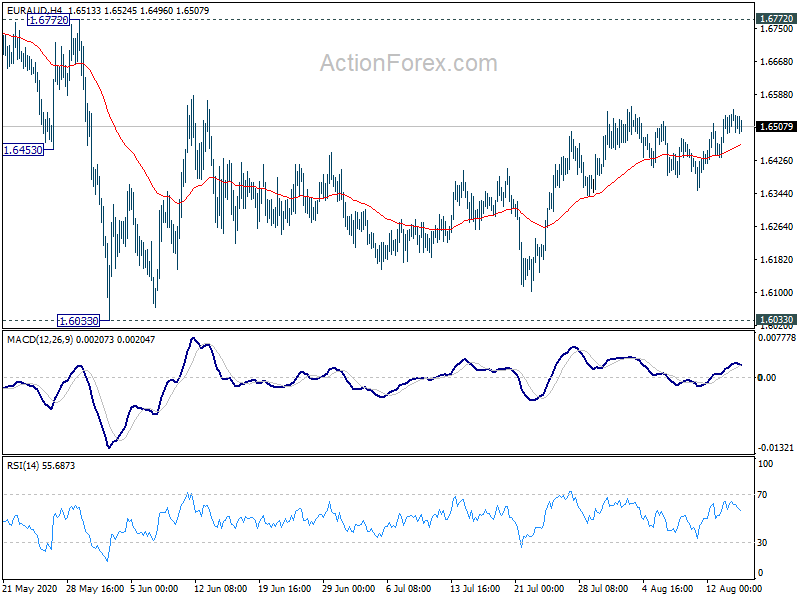
Indeed, AUD/USD staged in tight range below 0.7243 only. EUR/AUD was even trying to extend the up-leg of the consolidative pattern from 1.6022. It’s unsure what Aussie bulls are hesitating on. We’ll see.
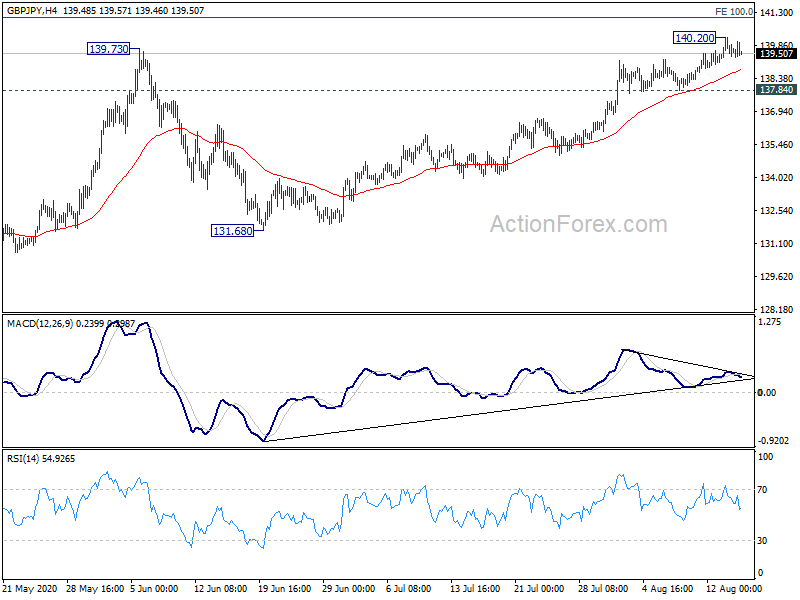
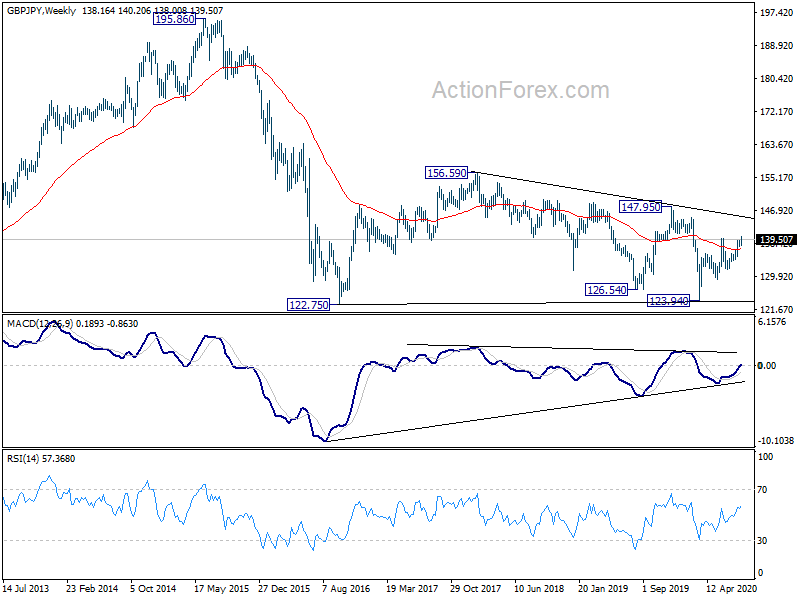
GBP/JPY Weekly Outlook
GBP/JPY rose further to 140.20 last week but quickly lost momentum above 139.73 resistance. Initial bias is turned neutral for some consolidations first. Further rally is expected as long as 137.84 support holds. Rise from 123.94 has just resumed and break of 140.20 will target 100% projection of 123.94 to 135.74 from 129.27 at 141.07. However, break of 137.84 will indicate short term topping, on bearish divergence condition in 4 hour MACD. Intraday bias will be turned back to the downside for pull back.
In the bigger picture, rise from 123.94 is still seen as a rising leg of the sideway consolidation pattern from 122.75 (2016 low). As long as 147.95 resistance holds, an eventual downside breakout remains in favor. However, firm break of 147.95 will raise the chance of long term bullish reversal. Focus will then be turned to 156.59 resistance for confirmation.
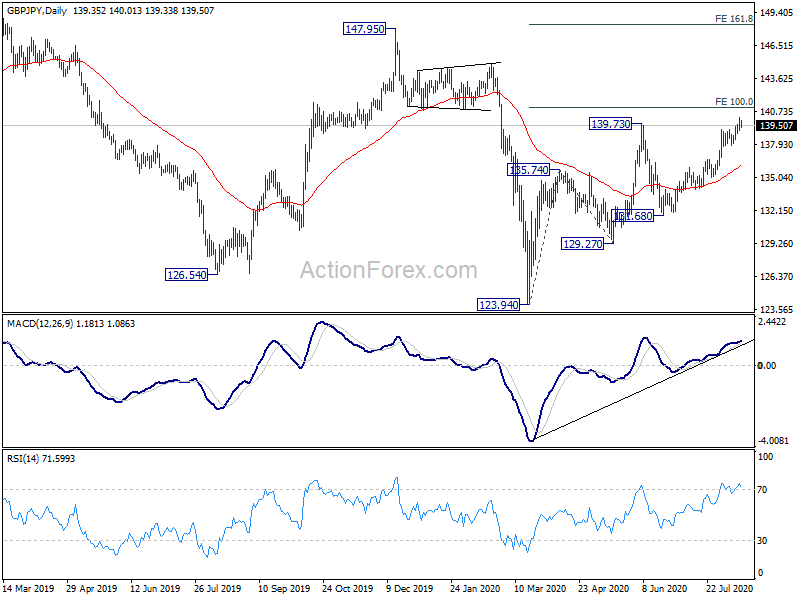
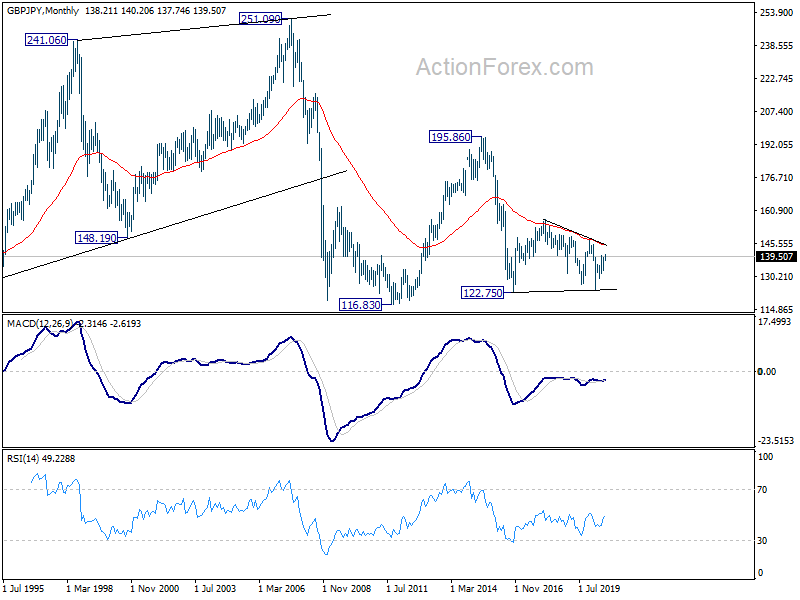
In the longer term picture, repeated rejection by 55 month EMA indicate long term bearishness in the cross. Down trend from 251.09 (2007 high) should eventually resume through 122.75 to 116.83 (2011 low) and below. However, sustained break of 55 month EMA (now at 144.90) will dampen this view and could open up further rise back to 195.86 (2015 high).


