
Gold’s rebound is gaining some traction today as broader financial markets stabilize, but the move is still seen as corrective rather than the start of a sustained bullish reversal. The recovery follows a sharp and stretched selloff earlier this week, with price action below 4,100 triggering what appears to have been a near-term exhaustion point.
The initial lift has been driven largely by positioning. Profit-taking on short positions has provided the base for the rebound, rather than fresh bullish demand. Some support has also come from cautious optimism around de-escalation in the Middle East after the US announced a five-day postponement of strikes on Iranian energy infrastructure.
Technical factors have also played a role. The 4,000 level has emerged as a strong support zone, combining psychological significance with a key technical cluster. Bargain hunting interest around this level helped stabilize the market and reinforced the near-term floor.
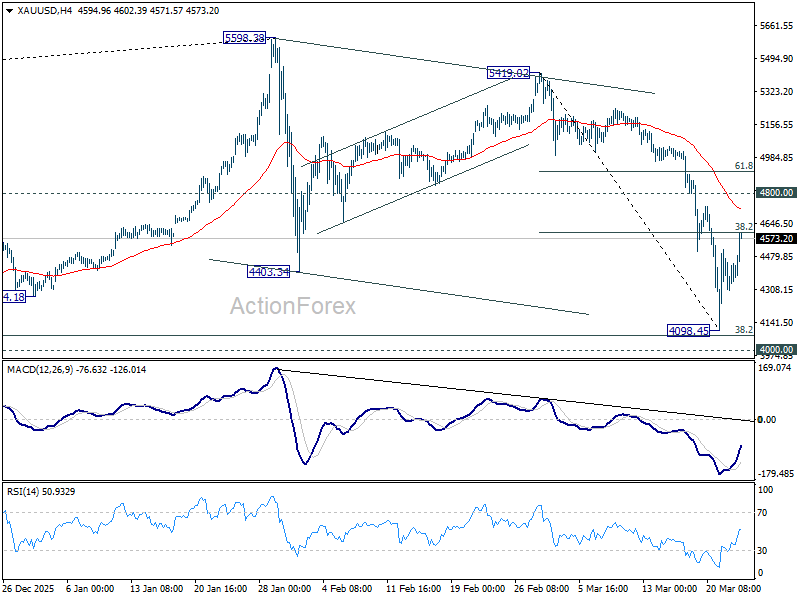
However, the upside is now approaching a critical resistance “traffic jam” between 4,600 and 4,800. This zone includes 38.2% retracement of 5,419.02 to 4,098.45 at 4,602.90, as well as 55 4H EMA near 4,725. Together, these levels create a dense resistance band that is likely to cap further gains.
Importantly, this is also where short-term traders who bought into the rebound are likely to take profits. If selling pressure emerges in this zone, it would confirm that the market remains in a “sell-the-rally” regime rather than shifting to a “buy-the-dip” environment.
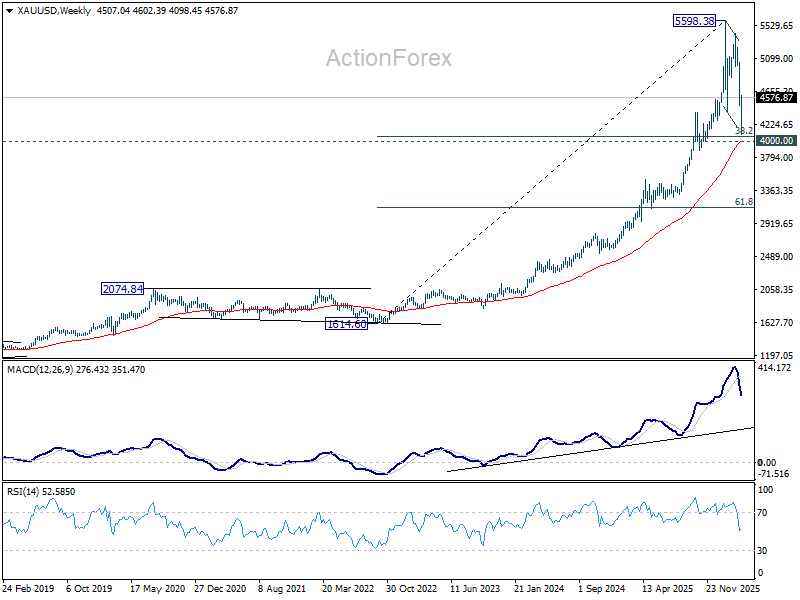
As long as this resistance holds, the broader outlook remains cautious. Another leg lower cannot be ruled out, but the 4,000 level, with 38.2% retracement of 1,614.60 (2022 low) to 5,598.38 (Jan high) at 4,076.57, should continue to act as a strong floor barring a major escalation in geopolitical tensions.
Only a firm break above 4,800 would signal that a more meaningful bullish reversal is underway. Such a move would likely indicate that macro risks—particularly related to energy and geopolitics—are easing.


