


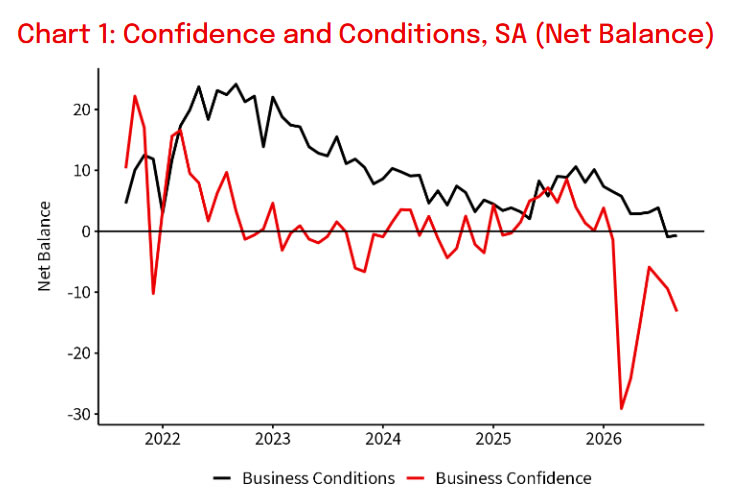
Australia’s NAB Business Confidence Index fell from -9 to -13 in September, marking its third consecutive monthly decline as businesses faced a combination of higher interest rates, global uncertainty and elevated fuel costs. Confidence is now 18 points below its long-run average and ranks among the weakest 5% of readings in the survey’s history. NAB Head of Australian Economics Gareth Spence warned that pessimism was widespread across industries, with confidence 22 points lower than a year earlier. He cautioned that weak sentiment could increasingly affect hiring, investment and spending decisions, raising the risk of softer economic activity in the final quarter.
Business Conditions held unchanged at -1, but the underlying components revealed further deterioration in employment. Modest improvements in trading conditions and profitability were offset by a 3-point decline in the employment component to its lowest level in five years. Regional performance also became more uneven. Queensland’s conditions fell 4 points, bringing its trend reading broadly into line with the weaker eastern states. Western Australia remained the clear outperformer, with trend conditions at +16, compared with 0 in New South Wales, -1 in Queensland and -3 in Victoria. The divergence suggests that business weakness is widespread but not uniform across the country.
Despite deteriorating confidence and employment conditions, capacity utilisation eased only slightly from 82.5% to 82.3%, remaining around one percentage point above its long-run average. Utilisation increased in five of the eight industries surveyed, with trend readings above average in five industries. Spence noted that capacity utilisation had remained above average for around four years despite weakening business conditions. The contrast highlights an economy facing increasingly subdued business sentiment without a corresponding broad easing of capacity pressures. Elevated input costs and constrained capacity continue to pose inflation risks, while weakening confidence, profitability and employment point to growing downside risks for activity.
Data Summary — NAB September Business Survey
| Indicator | August | September |
|---|---|---|
| Business Confidence | -9 | -13 |
| Business Conditions | -1 | -1 |
| Capacity Utilisation | 82.5% | 82.3% |
Components
| Component | September Trend |
|---|---|
| Employment | Fell 3 points to five-year low |
| Trading Conditions | Small improvement |
| Profitability | Small improvement |
| Capacity Utilisation | Above long-run average by around 1 percentage point |
| Industry Confidence | Weak across almost every industry |
Regional Business Conditions
| State | Trend Conditions |
|---|---|
| Western Australia | +16 |
| New South Wales | 0 |
| Queensland | -1 |
| Victoria | -3 |
Source: NAB Monthly Business Survey, September 2026.
Key Takeaways
- Business confidence deteriorates sharply: NAB Business Confidence fell from -9 to -13, its third consecutive monthly decline. The reading is 18 points below its long-run average and among the weakest 5% in the survey’s history.
- Employment conditions weaken: Overall Business Conditions held at -1, but the employment component dropped 3 points to a five-year low, raising concerns about hiring and activity toward year-end.
- Capacity pressures persist: Capacity utilisation edged down from 82.5% to 82.3%, remaining around one percentage point above average despite weakening business sentiment.
- Western Australia outperforms: Western Australia’s trend conditions stood at +16, substantially stronger than the subdued readings across New South Wales, Queensland and Victoria.
- Economic outlook remains conflicted: Weak confidence and employment point to softer activity, while elevated capacity utilisation and input costs suggest inflation pressures have yet to ease broadly.





