Sample Category Title
Pound Froze ahead of BoE Meeting: What Will the Central Bank Decide?
The GBP/USD pair is balancing around 1.2709 on Thursday, after the British pound rose in price against the US dollar for three consecutive days and finally paused.
The Bank of England will convene for its regular meeting today, at which the regulator will review all the collected statistics and decide on the interest rate level. The prevailing forecast suggests the rate will remain unchanged at 5.25% per annum. However, other options are always possible.
It will be interesting to see how the BoE will assess its success in fighting inflation. The UK consumer price index slowed to 2.0% in May from 2.3% earlier. In comparison, the indicator increased by 0.3% month-over-month, as in April, while an increase of 0.4% m/m was expected.
It can be said with confidence that the inflation trend has developed positively. It is now essential that the Bank of England also notices and applies this.
The BoE may be able to reduce the rate at least twice in 2024. The business sector, industry, and retail are ready for this.
Technical analysis of GBP/USD
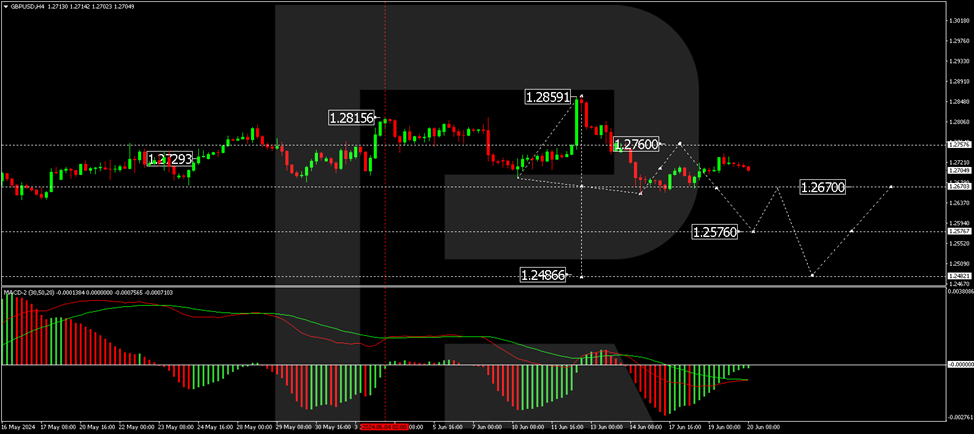
On the H4 GBP/USD chart, the first impulse of decline to the level of 1.2656 has been executed. Today, the market is forming a correction to the level of 1.2760. After reaching this level, we will consider the beginning of a decline to 1.2670. With the breakdown of this level, the potential of the wave will open to the level of 1.2576, a local target. Further, a correction wave to 1.2670 is possible (testing from below). Then, we will consider the beginning of a wave of decline to 1.2486, the main target. Technically, this scenario is confirmed by the MACD indicator. Its signal line is below the zero mark and continues developing the decline structure to new lows.
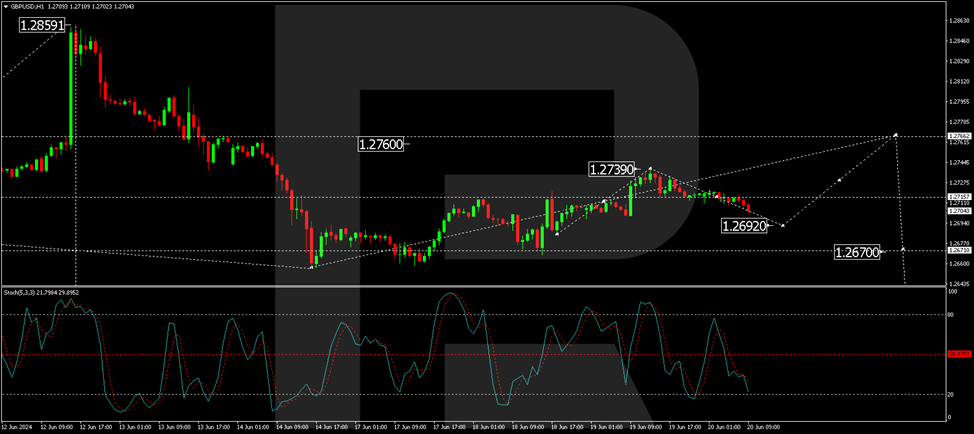
On the H1 GBP/USD chart, a correction wave was performed to 1.2739, and the decline structure to 1.2692 is forming today. After working out this level, let's consider the growth probability towards 1.2760. At this point, the correction potential will be exhausted. After the correction is completed, we will consider the beginning of a new wave of decline to 1.2670. Technically, this scenario is confirmed by the Stochastic oscillator. Its signal line is below the zero level and continues to decline to the level of 20.
Ifo upgrades German GDP forecasts, slowly working its way out of crisis
The Ifo Institute upgraded its growth forecasts for German economy, indicating that it is "slowly working its way out of the crisis." GDP is now expected to grow by 0.4% in 2024, up from March forecast of 0.2%. Growth is projected to further accelerate to 1.5% in 2025, maintaining the previous forecast. Inflation is expected to decrease significantly, from 5.9% in 2023 to 2.2% in 2024, and further down to 1.7% in 2025.
The institute anticipates that the overall economic recovery will gain momentum throughout the rest of the year as consumer spending normalizes. Purchasing power of private households is expected to strengthen, leading to a gradual recovery in the demand for goods and services.
Moreover, the Ifo Institute expects ECB's interest rate cut in June is likely to be followed by two more cuts this year. These lower interest rates, coupled with a stable labor market and robust income growth, are expected to boost the consumer economy and aid in the gradual recovery of the construction sector.
Bitcoin Finds Support: Will It Last?
The well-known (but anonymous) analyst known as PlanB predicted that Bitcoin's price will reach $150,000 by the end of this year and $800,000 by 2025. How realistic is this?
Analyzing the long-term BTC/USD chart on May 16, we built a "roadmap" for Bitcoin's price, which appeared as an expanding fan consisting of a median line, support levels below it, and resistance levels above it.

Analyzing the BTC/USD chart on June 13, we noted:
→ A lack of buyers willing to pay more than $70k per coin, suggesting a potential price decline from the median to the support line;
→ A descending channel (shown in red), which could frame this decline.
How has the market situation changed over the past week?
→ Since our last publication, Bitcoin's price has decreased within the red channel from approximately 67,300 to the Support 1 line around 64,800, which is part of the "roadmap" and found support there – forming a bullish "inverse head and shoulders" pattern on the BTC/USD chart.
→ The upward movement observed today, June 20, has broken through the median line of the red channel and the "neckline" of the mentioned pattern.
Therefore, in terms of technical analysis, it is reasonable to state that the bulls are using Support 1 to seize the initiative. Will they succeed?
In a negative scenario, the bounce from Support 1 might be weak, putting Support 1 at risk of breaking with the prospect of further decline.
In a positive scenario, if the bulls succeed, Bitcoin's price could break out of the red channel and head towards the psychological level of $70,000 per coin. The ability to reach and sustain above this level, resuming movement along the median, would provide sufficient grounds to suggest that Bitcoin is on track, and optimists (like PlanB) would find confirmation for their bold predictions.
FXOpen offers the world's most popular cryptocurrency CFDs*, including Bitcoin and Ethereum. Floating spreads, 1:2 leverage — at your service. Open your trading account now or learn more about crypto CFD trading with FXOpen.
*At FXOpen UK and FXOpen AU, Cryptocurrency CFDs are only available for trading by those clients categorised as Professional clients under FCA Rules and Professional clients under ASIC Rules respectively. They are not available for trading by Retail clients.
This article represents the opinion of the Companies operating under the FXOpen brand only. It is not to be construed as an offer, solicitation, or recommendation with respect to products and services provided by the Companies operating under the FXOpen brand, nor is it to be considered financial advice.
NZDUSD Erases GDP-led Pickup
- NZDUSD rises temporarily after slight GDP growth surprise
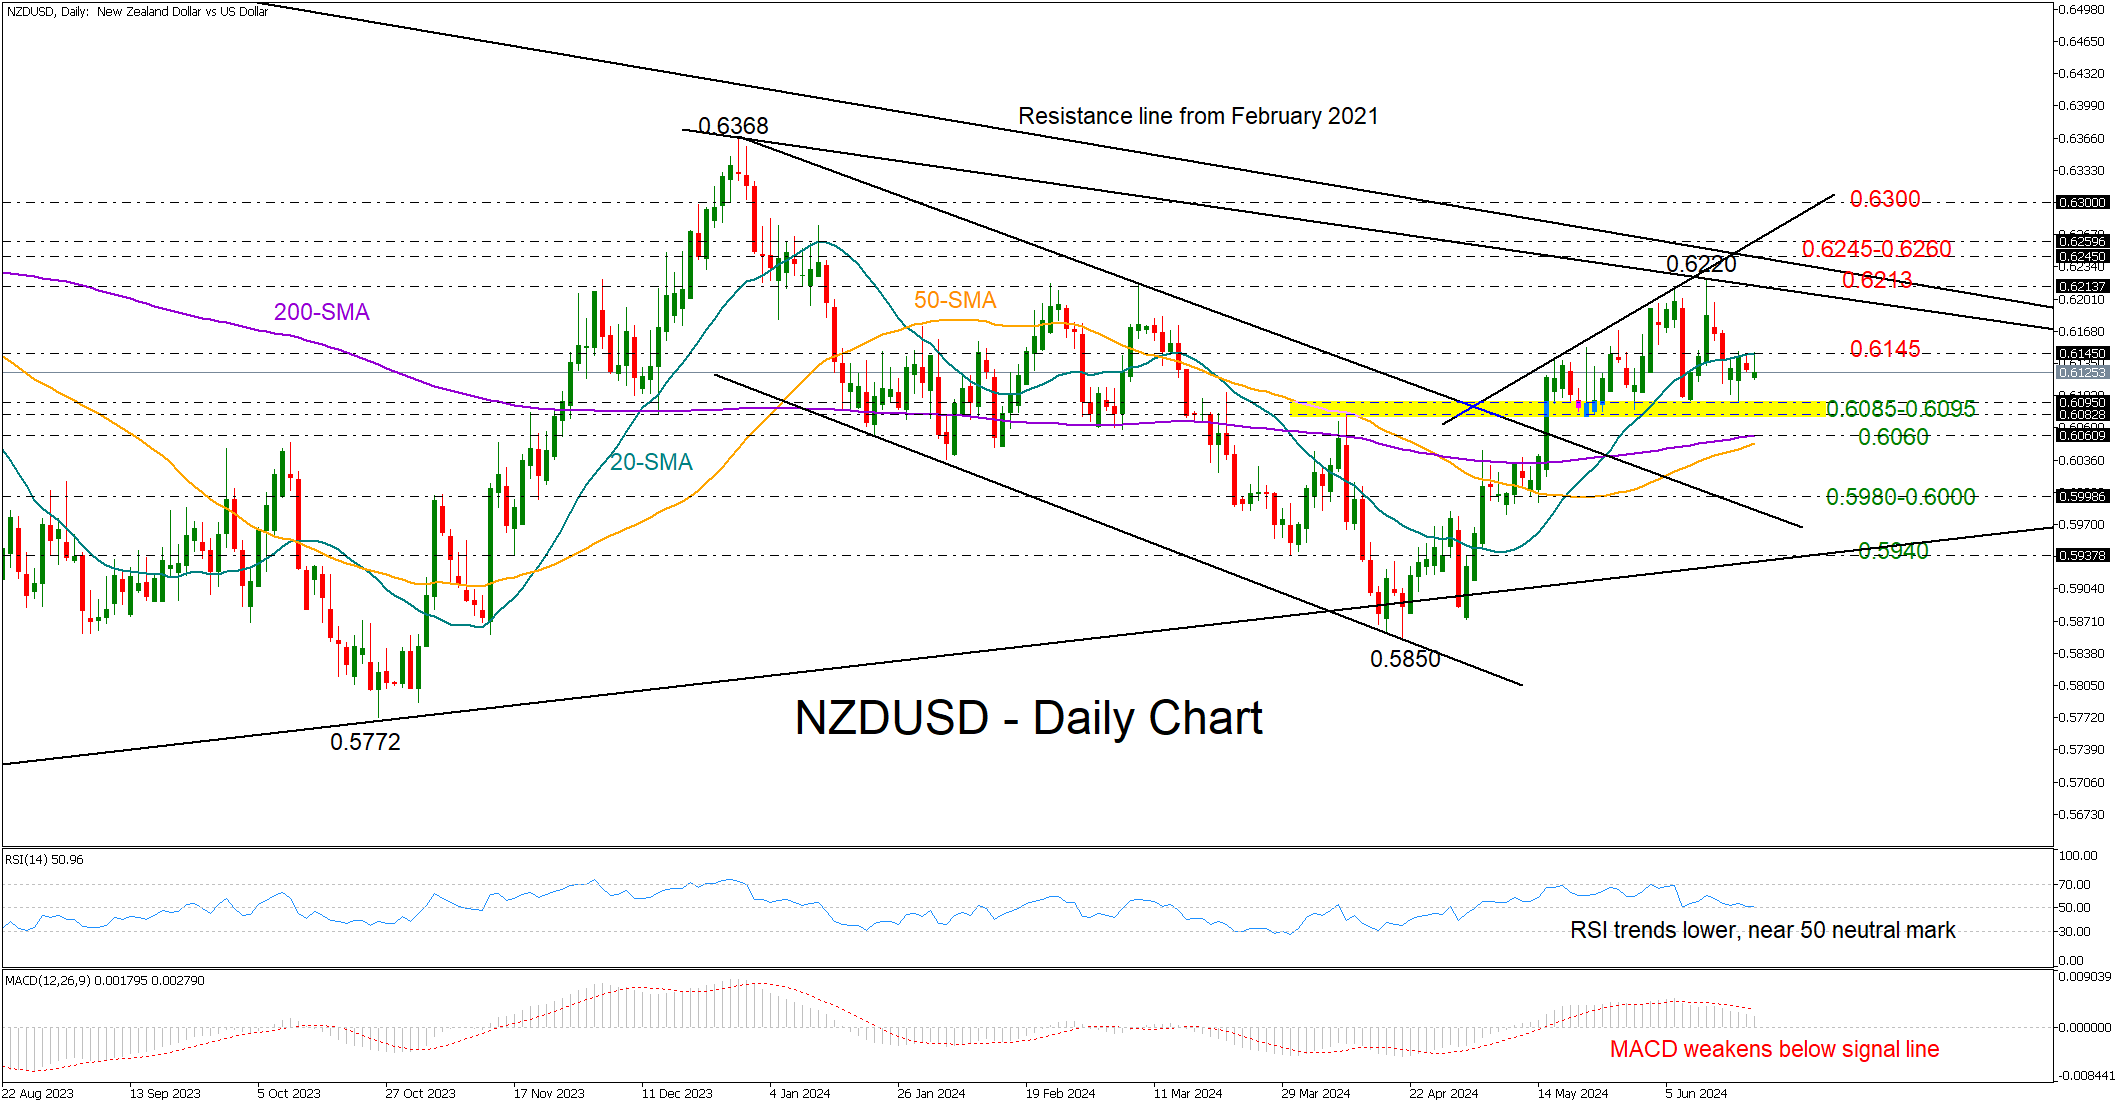
- Bulls remain capped below 20-SMA; key support at 0.6085-0.6095
Early Thursday data revealed that the New Zealand economy experienced slightly faster growth than anticipated in Q1. However, NZDUSD rose only a few pips to 0.6164, which were swiftly erased.
The bears couldn’t push past the 20-day SMA at 0.6145 for the fourth consecutive day, leading to worries that the pause in the short-term uptrend could lead to a downward reversal. The negative slope in the technical indicators does not dispute the negative signals, though sellers could stay patient as long as the floor at 0.6085-0.6095 stays solid.
If the bears violate the uptrend below 0.6085-0.6095, the 50- and 200-day SMAs could act as a buffer around 0.6060, preventing a sharp downfall to 0.5980-0.6000. A step lower could trigger another aggressive decline to 0.5940, where the ascending line drawn from the 2022 bottom is located.
Should the pair gather sufficient buyers to exceed its 20-day SMA, a strong barrier could initially emerge near 0.6213 and then within the 0.6245-0.6260 range. A successful bounce higher could lift the price straight to the 0.6300 psychological mark or even closer to the December 2023 top of 0.6368.
Summing up, NZDUSD seems to be powerless below its 20-day SMA, though downside risks may not strengthen unless the price slides below 0.6085-0.6095.
AUDUSD Extends Sideways Movement
- AUDUSD trades back and forth within its range
- The ascending 50-day SMA acts as a strong floor
- Oscillators remain tilted to the bullish side
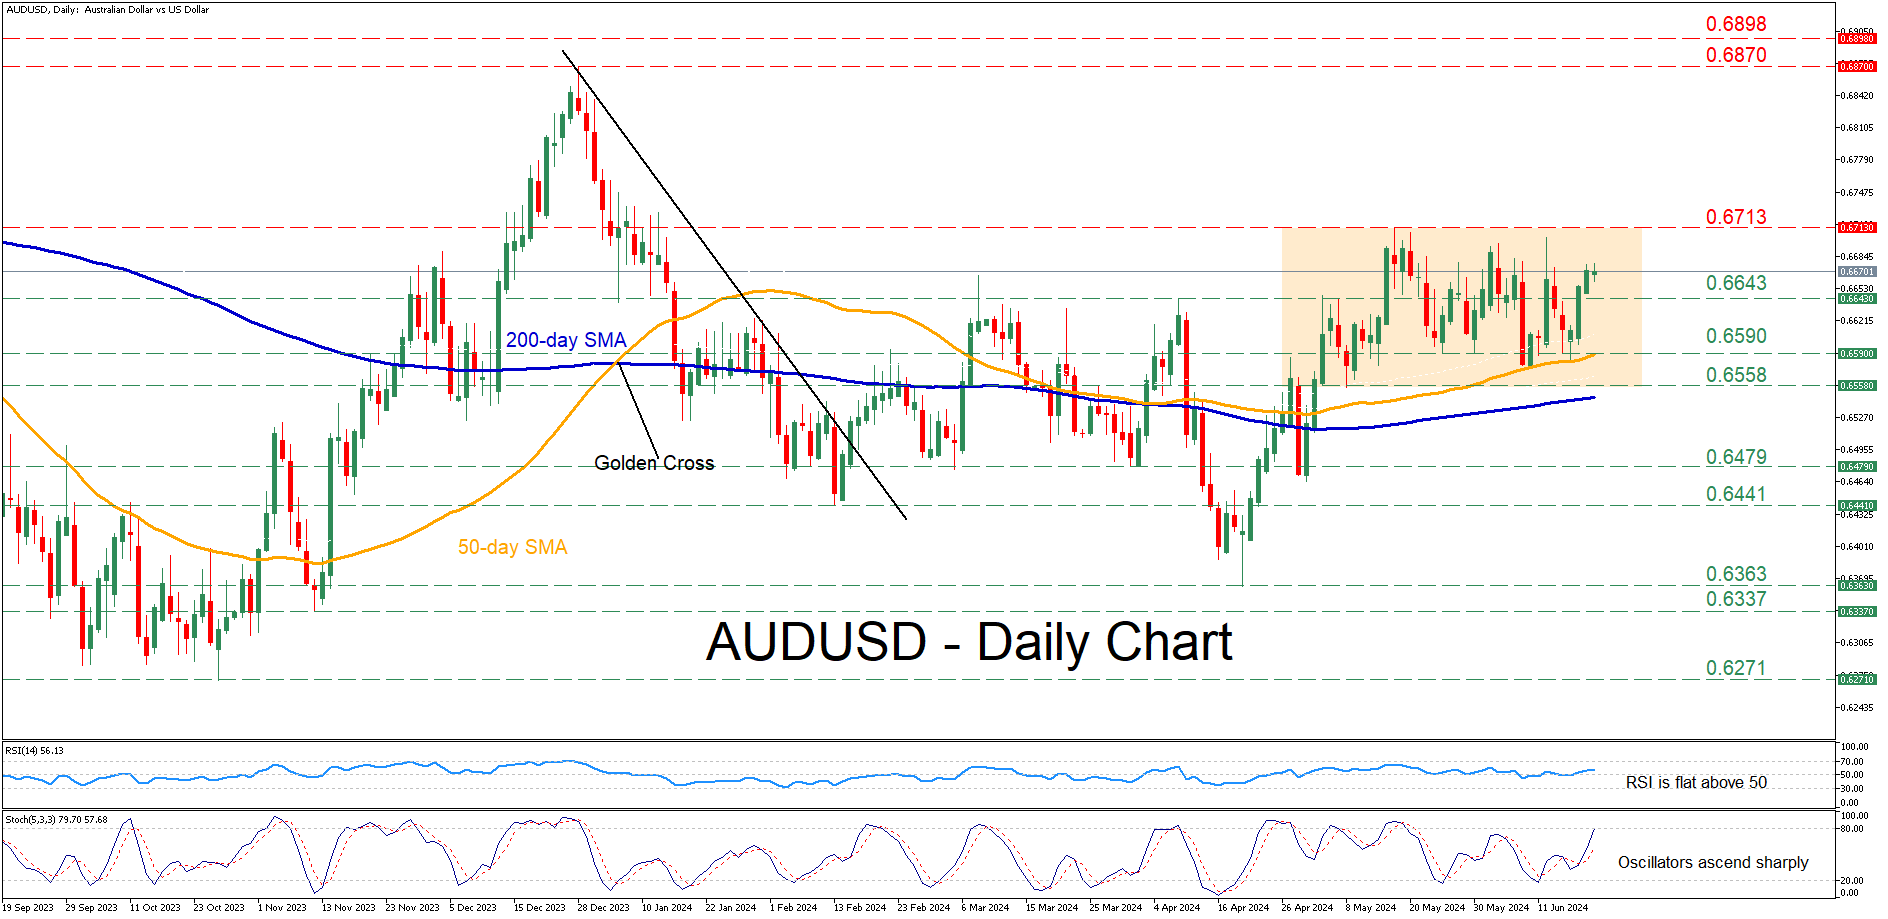
AUDUSD has been trading sideways for more than a month now as the price has been unable to jump above the five-month high of 0.6713. However, the pair’s downside also seems to be capped by the upward sloping 50-day simple moving average (SMA).
If buying pressures persist, the price may initially test the five-month high of 0.6713, which is the upper boundary of its short-term range. A violation of that threshold could pave the way for the December 2023 high of 0.6870. Failing to halt there, the pair may advance towards the double top region of 0.6898, registered last summer.
On the flipside, should the pair reverse lower, immediate support could be found at the April-May resistance of 0.6643. In case of a downside violation, the bears may attack the recent support of 0.6590, which overlaps with the 50-day SMA. Further declines could then come to a halt at 0.6558, the lower limit of the pair’s range.
In brief, AUDUSD appears to be in a neutral phase as the bulls’ attempts for a fresh higher high have not yet come into fruition. Therefore, a clear break above or below the short-term range is needed for the pair to adopt a clear directional impetus.
GBP Awaits Bank of England Verdict: Volatility Ahead?
GBP/USD
In the first half of the current trading week, the GBP/USD pair has confidently stayed above the significant range of 1.2700-1.2650, continuously attempting to resume its upward trend. Today, everything could change. Depending on the outcome of the Bank of England meeting and the market's reaction to the officials' decision, the pair could either strengthen to 1.2860 or fall to 1.2600. Additionally, we cannot rule out the possibility of the pair continuing its sideways movement, which it has been in for over four weeks.
What do experts expect from today's Bank of England meeting:
- The interest rate is expected to remain at 5.25%.
- The number of votes for a rate cut is expected to be 2, and for the rate to remain unchanged, 7.
Therefore, if any officials change their stance and the current balance shifts dramatically, volatility in the pound could sharply increase.
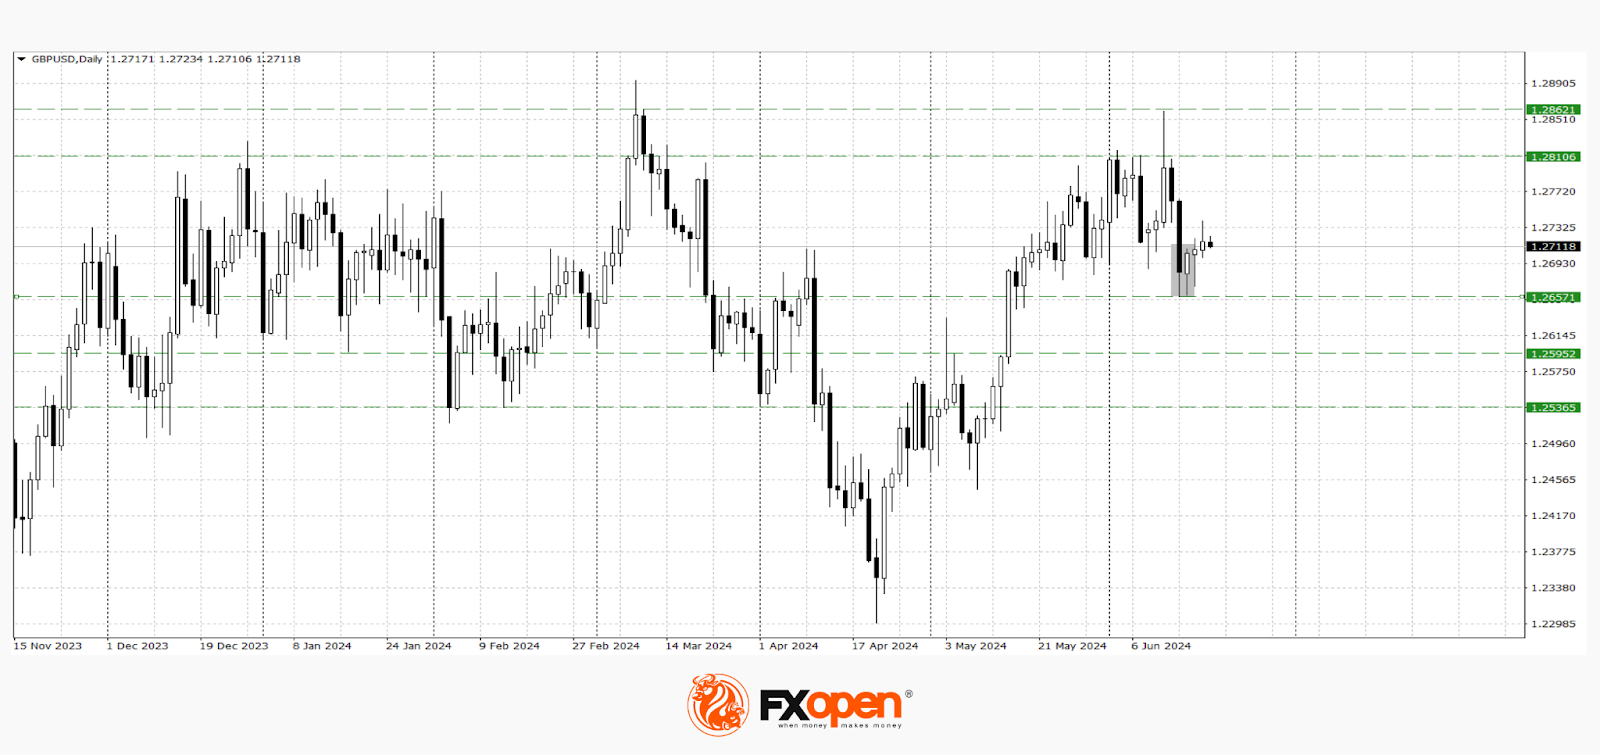
According to the technical analysis of the GBP/USD pair on the daily timeframe, we observe a sluggish formation of the "piercing candle" pattern. If the pair remains above 1.2700, the price may retest 1.2860-1.2800. In the case of breaking the support at 1.2660, a resumption of the downward trend towards 1.2600-1.2540 is possible.
USD/JPY
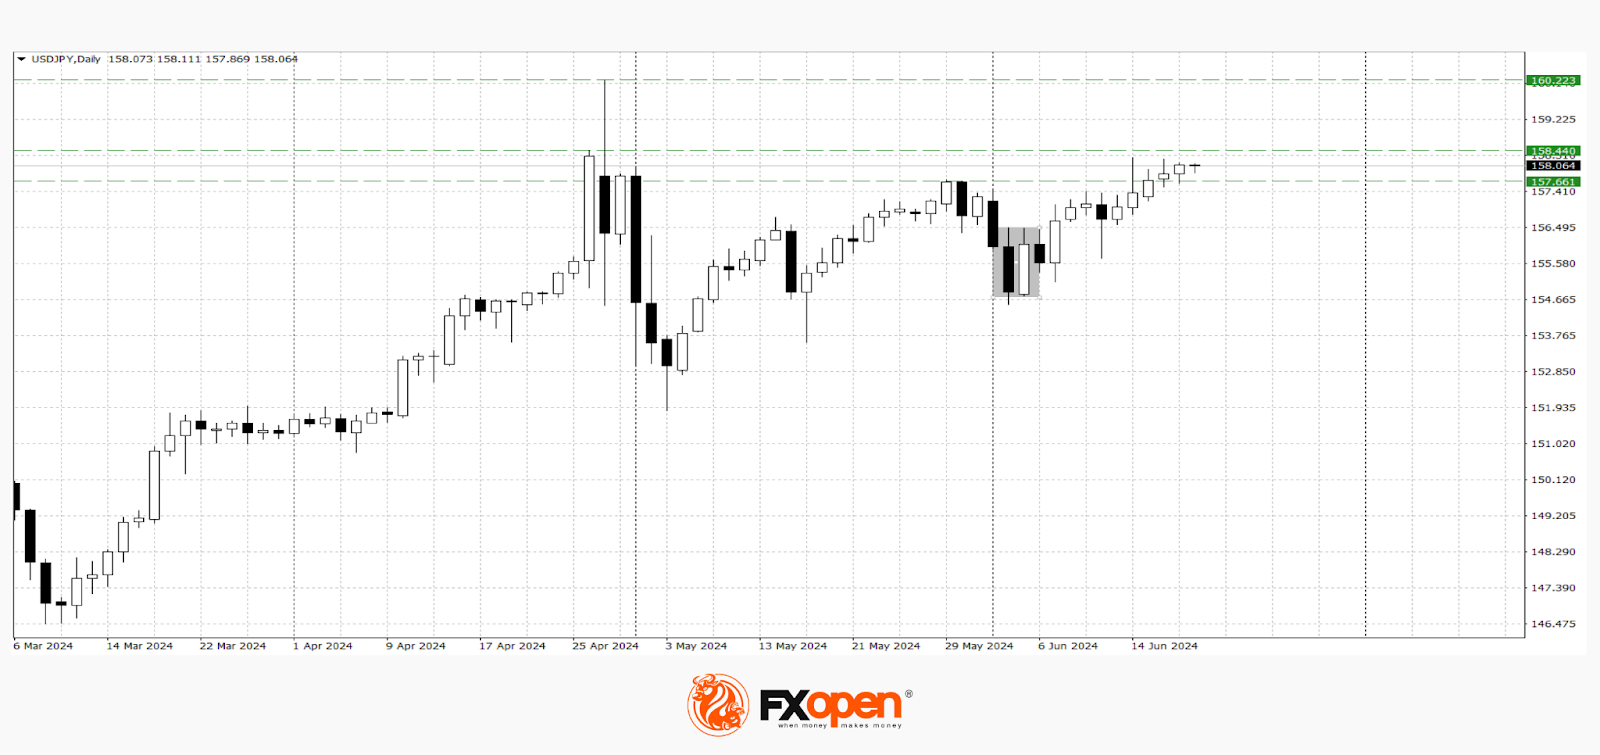
Dollar buyers in the USD/JPY pair are persistently attempting to stay above 158.00. The ultra-loose policy of the Bank of Japan and the hawkish stance of the Federal Reserve may contribute to another approach to the psychological level of 160.00.
According to the technical analysis of the USD/JPY pair, we observe a strong upward trend across all higher timeframes. On the D1 chart, after a corrective pullback at the beginning of the month, a "bullish engulfing" pattern was formed. If the pair's buyers manage to hold above 158.00, another approach to 160.00 is possible. In the event of a break below the support at 157.60, a short-term downward correction may begin.
The following news could impact the pair's pricing:
- Today at 15:30 (GMT +3:00) the Philadelphia Fed Manufacturing Index (USA) for June.
- Today at 15:30 (GMT +3:00) the number of initial jobless claims in the USA.
- Tomorrow at 02:30 (GMT +3:00) the nationwide core Consumer Price Index (CPI) in Japan for May.
Trade over 50 forex markets 24 hours a day with FXOpen. Take advantage of low commissions, deep liquidity, and spreads from 0.0 pips. Open your FXOpen account now or learn more about trading forex with FXOpen.
This article represents the opinion of the Companies operating under the FXOpen brand only. It is not to be construed as an offer, solicitation, or recommendation with respect to products and services provided by the Companies operating under the FXOpen brand, nor is it to be considered financial advice.
Ethereum Could Outperform Bitcoin and Rally – Here’s Why
Key Highlights
- Ethereum remained in a positive zone after all investigation was dropped by the SEC.
- ETH price is facing resistance near $3,700 on the daily chart.
- Bitcoin price extended losses and declined below $65,000.
- Gold prices might gain pace for a move toward the $2,365 level.
Ethereum Technical Analysis
Ethereum struggled to surpass the $4,000 level and corrected gains. However, ETH declined less compared to Bitcoin, but there was a move below $2,700.
Looking at the daily chart, the price traded below the $3,500 level. There was a spike below the 50% Fib retracement level of the upward move from the $2,855 swing low to the $3,975 high.
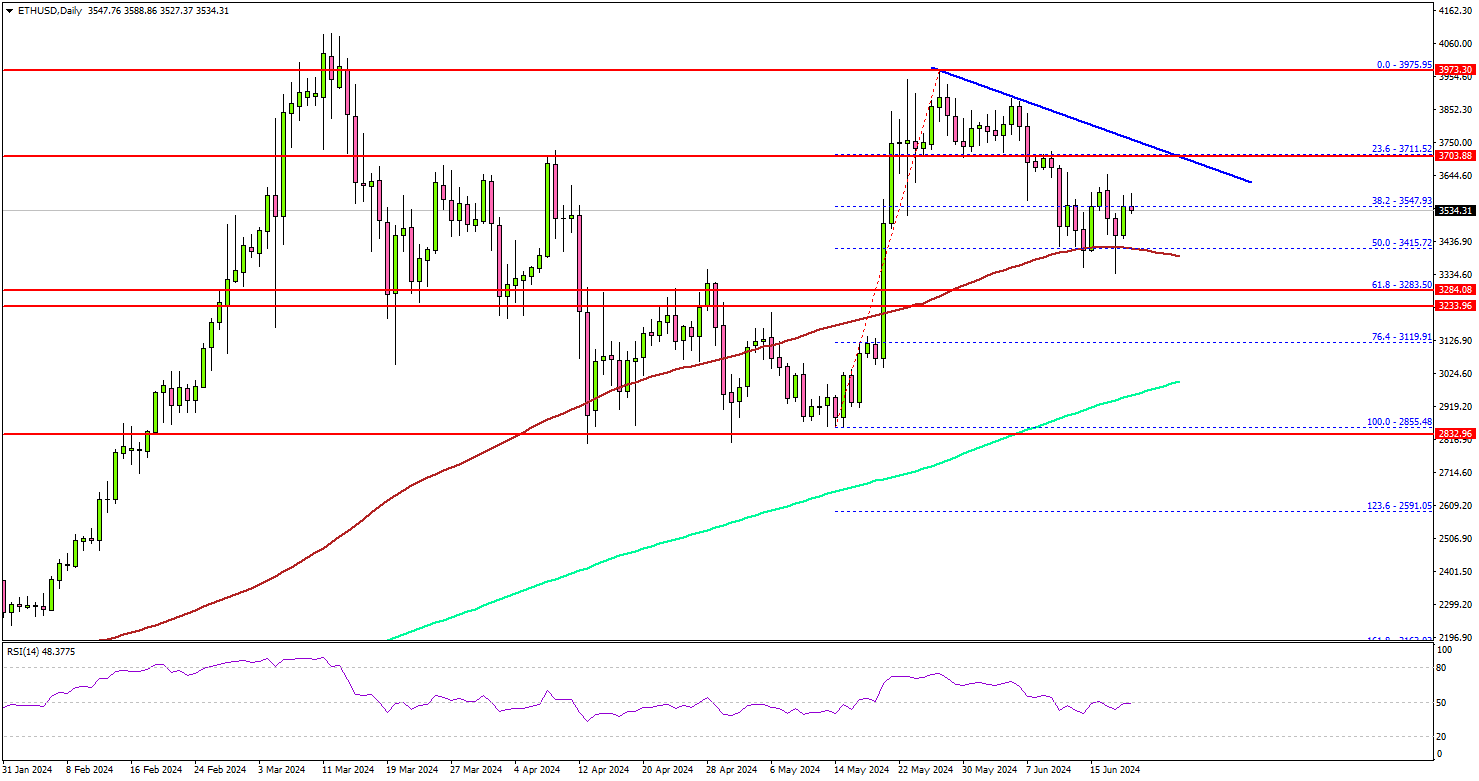
However, the bulls were active near the 100-day simple moving average (red), and the price is well above the 200-day simple moving average (green). On the upside, ETH is facing resistance near the $3,600 level.
The next major resistance is near the $3,700 level. There is also a connecting bearish trend line with resistance at $3,700 on the same chart. A daily close above the $3,700 resistance zone could start another steady increase.
In the stated case, the price may perhaps rise toward the $3,880 level. The next stop for the bulls may perhaps be near the $4,000 level.
If not, the price might resume its decline and test the $3,300 support level. The next major support is near $3,220, below which the price could slide toward $3,050. Any more losses might call for a move toward the $3,000 level and the 200-day simple moving average (green).
Looking at Bitcoin, the bears were able to push the price below $65,000, but downsides might be limited below $62,000.
Economic Releases
- BoE Interest Rate Decision - Forecast 5.25%, versus 5.25% previous.
- US Initial Jobless Claims - Forecast 235K, versus 242K previous.
SNB cuts 25bps, lowers inflation forecasts slightly
SNB lowered the policy rate by 25bps to 1.25% and maintained the willingness to be active in the foreign exchange markets as necessary.
In the accompanying statement, SNB said "underlying inflationary pressure has decreased again". The central will continue to monitor the development of inflation closely, and will "adjust its monetary policy if necessary.
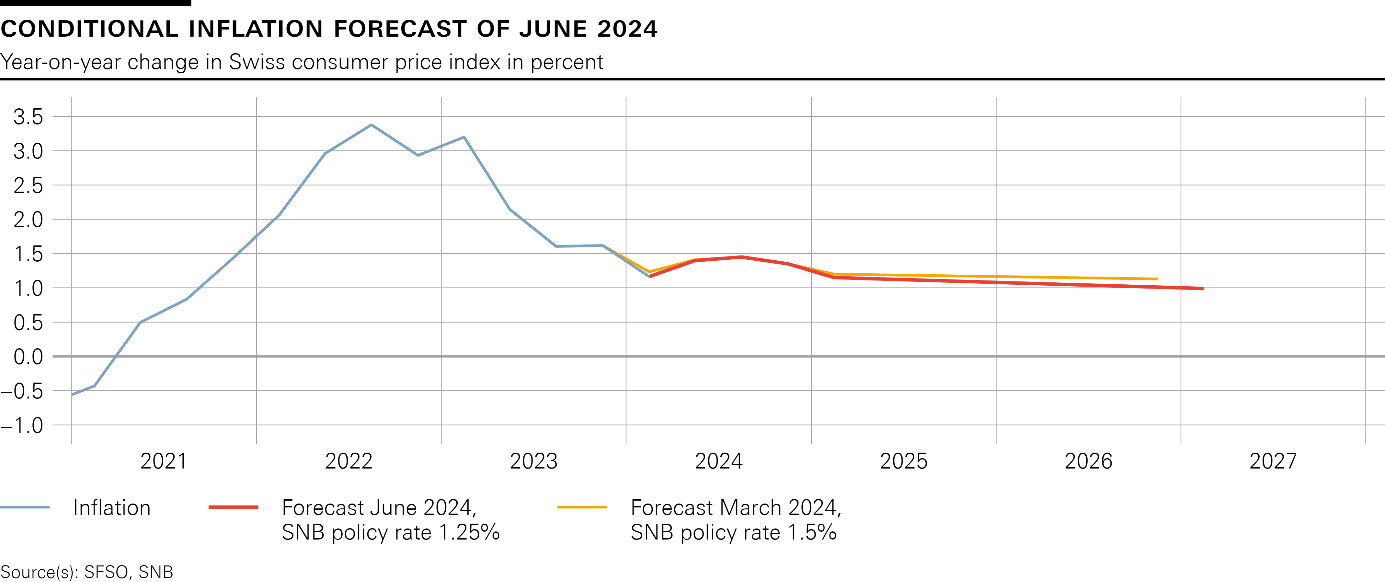
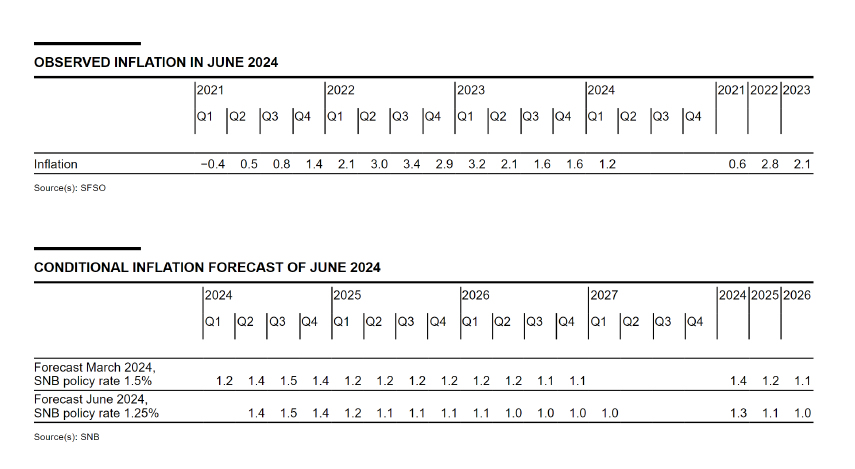
Taking into account today's policy rate cut, the new conditional inflation forecast were lowered slightly to 1.3% in 2024 (prior 1.4%), 1.1% in 2025 (prior 1.2%), and then 1.0% in 2026 (prior 1.1%).
Growth is likely to remain "moderate" in Switzerland in the coming quarters. SNB anticipates GDP growth of around 1% this year, and 1.5% in 2025.
(SNB) Swiss National Bank Eases Monetary Policy and Lowers SNB Policy Rate to 1.25%
The Swiss National Bank is lowering the SNB policy rate by 0.25 percentage points to 1.25%. The change applies from tomorrow, 21 June 2024. Banks' sight deposits held at the SNB will be remunerated at the SNB policy rate up to a certain threshold, and at 0.75% above this threshold. The SNB is also willing to be active in the foreign exchange market as necessary.
The underlying inflationary pressure has decreased again compared to the previous quarter. With today's lowering of the SNB policy rate, the SNB is able to maintain appropriate monetary conditions. The SNB will continue to monitor the development of inflation closely, and will adjust its monetary policy if necessary to ensure inflation remains within the range consistent with price stability over the medium term.
Inflation has risen slightly since the last monetary policy assessment, and stood at 1.4% in May. Higher inflation in rents, tourism services and oil products has contributed in particular to this increase. Overall, inflation in Switzerland is currently being driven above all by higher prices for domestic services.
Taking into account today's policy rate cut, the new conditional inflation forecast is similar to that of March. Over the longer term, it is slightly below the previous forecast. This reflects somewhat lower second-round effects. Over the entire forecast horizon, the conditional inflation forecast is within the range of price stability (cf. chart). The forecast puts average annual inflation at 1.3% for 2024, 1.1% for 2025 and 1.0% for 2026 (cf. table). The forecast is based on the assumption that the SNB policy rate is 1.25% over the entire forecast horizon. Without today's rate cut, the forecast would have been lower.
Global economic growth was solid in the first quarter of 2024. Inflation largely moved sideways over the past months, and remained above central banks' targets in many countries. However, the underlying inflationary pressure continued to decrease slightly. Against this background, some central banks eased their monetary policy for the first time following the tightening cycle of the past two years. However, monetary policy remains restrictive in many countries.
Inflationary pressure abroad is likely to continue to ease gradually over the next quarters. At the same time, the global economy is likely to pick up somewhat. However, for the coming quarters the SNB expects only moderate growth in global economic activity by longer-term comparison.
This scenario for the global economy is still subject to significant risks. Inflation could remain elevated for longer in some countries, necessitating a tighter monetary policy there than expected in the baseline scenario. Equally, a renewed increase in geopolitical tensions could result in weaker development of global economic activity.
Swiss GDP growth was moderate in the first quarter of 2024. The services sector continued to expand, while value added in manufacturing stagnated. There was a further slight increase in unemployment. The utilisation of overall production capacity was normal.
Growth is likely to remain moderate in Switzerland in the coming quarters. The SNB anticipates GDP growth of around 1% this year. In this environment, unemployment is likely to continue to rise slightly, and the utilisation of production capacity is set to decline slightly. Over the medium term, economic activity should improve gradually, supported by somewhat stronger demand from abroad. The SNB currently expects growth of around 1.5% for 2025.
The forecast for Switzerland, as for the global economy, is subject to significant uncertainty. Developments abroad represent the main risk.
Momentum on the mortgage and real estate markets in recent quarters has been weaker than in previous years. However, the vulnerabilities in these markets remain.
More detailed information on the monetary policy decision can be found in the introductory remarks of the Governing Board.
Swiss National Bank, Norges Bank and Bank of England Will Decide on Monetary Policy
Markets
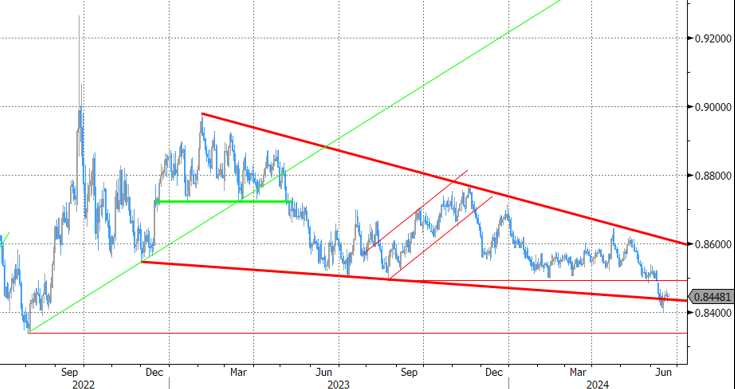
EMU and UK markets yesterday had to develop their own dynamics with no guidance from the US (markets closed for the Juneteenth holiday). The European Commission activated the ‘excessive deficit procedure’ for 7 member states to rectify persistent budgetary slippage. In a separate study on its website, the ECB also published an in extenso article on the huge fiscal pressures EU/EMU countries are facing to cope with the challenges of an ageing population, higher defense spending and climate change and closing the digitalization gap, which are coming on top of current debt burden (cf infra). In calm session, (10-y) intra-EMU spreads (vs Germany) still widened a few bps for peripheral markets (Italy +3 bps, Spain & Portugal +1 bp). France also widened 2 bps. German yields gained less than 1 bp across the curve. The euro showed no clear directional trend with EUR/USD closing marginally higher at 1.0745. UK Gilts underperformed Bunds rising between 4.1 bps (2-y) and 1.7 bps (5-y). UK headline CPI in May returned to BoE‘s 2.0% target but core (0.5% M/M and 3.5% Y/Y) and services inflation (+0.6% M/M and 5.7% Y/Y) indicated that it’s much too early for the BoE already to declare victory. Sterling temporarily gained post the release, but gains could not be sustained. EUR/GBP close the session little changed at 0.8447.
Asian equity markets this morning mostly show modest losses with China tentatively underperforming (CSI 300 -0.55%). The PBOC set the yuan’s fixing at the weakest levels since November, suggesting an further cautious stimulative approach. The on-shore yuan weakens to USD/CNY 7.26. At the restart in Asia, US yields add 2-3 bps across the curve. The dollar also gains a few ticks (EUR/USD 1.0740, DXY 105.3, USD/JPY 158.15).
Later today, the US calendar contains jobless claims, housing starts and permits and the Philly Fed business outlook. After a recent jump higher, especially jobless claims might have some intraday impact. The Swiss National Bank, the Norges Bank and the Bank of England will decide on monetary policy. Markets are divided whether the SNB should follow-up on the March 25 bps cut. The Norges Bank and the BoE probably have no room yet to give concrete guidance on the start of an easing cycle. EUR/GBP for now found a new ST equilibrium between 0.84 and 0.85.
News & Views
New Zealand’s economy escaped from a recession in Q1 of this year. GDP expanded at a modest 0.2% q/q, bringing the yearly figure to 0.3%. The numbers were slightly better than expected though in line with the central bank’s (RBNZ) forecast. Household consumption picked up from 0.6% to 1.6% q/q while government expenditures declined by -0.3%. Rising inventories supported growth while capital investments were a strong drag (-1.3%). Net exports also weighed heavily on the 2024Q1 figure due to a sharp increase in imports (+6.1%). The growth numbers don’t bring a lot of cheer but they won’t entice the RBNZ to cut rates anytime soon. Its chief economist Conway on Tuesday repeated the need to keep the policy rate restrictive for a long enough period, citing still-widespread inflation pressures. Additionally, underlying gauges including services/non-tradeable CPI prove sticky while the economy is expected to gradually gain traction in coming quarters. The central bank last month flagged no cuts before 2025H2. Money markets bet on a first move in November this year. New Zealand swap yields jumped between 5.3 and 7.3 bps after the release but the kiwi dollar barely budged. NZD/USD hovers near 0.613.
The ECB in a publication yesterday outlined and calculated the brutal reality of the fiscal challenges the European bloc is facing in the decades ahead. It calculated that for the euro area to reduce government debt levels towards the 60% level by 2070, an immediate and permanent effort of 2% of GDP is needed annually. This comprises a 1.4% adjustment just to maintain debt levels at the 2023 levels, complemented by a 0.6% effort in order to actually reduce debt levels. Additional costs complicate the picture. The central bank singled out three trends that await member states: demographic ageing (leading to increased costs in pensions, health & long-term care and education), filling the defence gap and climate change. These are estimated to increase the efforts needed by another 3% in coming decades (1.2%, 0,5% and 1.1% respectively). For some individual countries, the situation is much worse. Belgium’s fiscal challenge is guesstimated at more than 7%. Slovakia tops the board with a more than 9% effort needed.
Graphs
GE 10y yield
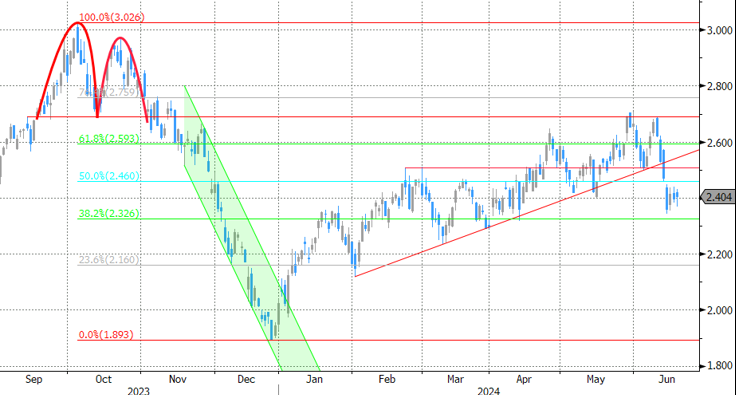
The ECB cut its key policy rates by 25 bps at the June policy meeting. A more bumpy inflation path in H2 2024, the EMU economy gradually regaining traction and the Fed’s higher for longer US strategy make follow-up moves difficult. Markets are coming to terms with that. For the time being, though, the political narrative dominates. After hitting a new YtD top at 2.7%, the German 10-yr yield corrected lower on safe haven bids.
US 10y yield
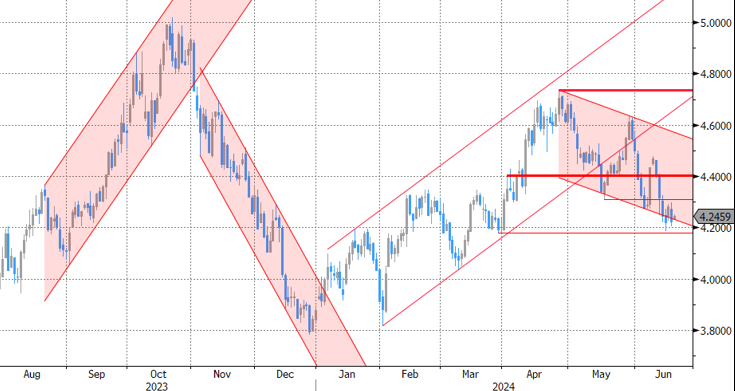
The Fed is seeking more evidence than just one slower-than-expected (May) CPI is providing. Upgraded inflation forecasts and a higher neutral rate complicate the exact timing of a first cut further. June dots suggest one move in 2024 followed by four more next year. Markets are positioned more aggressively, turning the recent low in yields into a technical support zone. The US 10-y yield is testing the downside of the 4.2/4.7% trading range.
EUR/USD
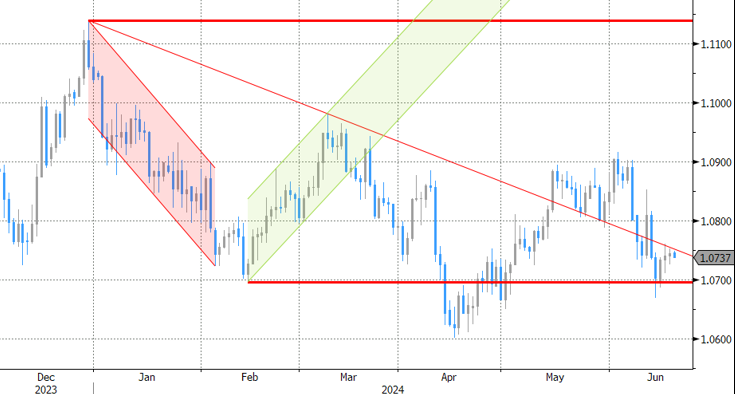
EUR/USD is trapped in the 1.06-1.09 range. The desynchronized rate cut cycle with the ECB exceptionally taking the lead, strong US May payrolls and a swing to the right in European elections pulled the pair away from 1.09 resistance. The Fed meeting balanced the weaker than expected US CPI outcome. Euro fragility makes a return to the 1.06 downside more likely than not.
EUR/GBP
Debate at the BOE is focused at the timing of rate cuts. May headline inflation returned to 2%, but core measures suggest it’s too early for the BoE to signal easing anytime soon. General elections (July 4) already made a June cut in line with the ECB unlikely. Money markets are discounting a Fed-like scenario. Sterling benefited. EUR/GBP tested the 2023 & 2024 lows near 0.85. Euro weakness eventually pulled the trick after French president Macron called snap elections following a weak showing in EU elections.