Sample Category Title
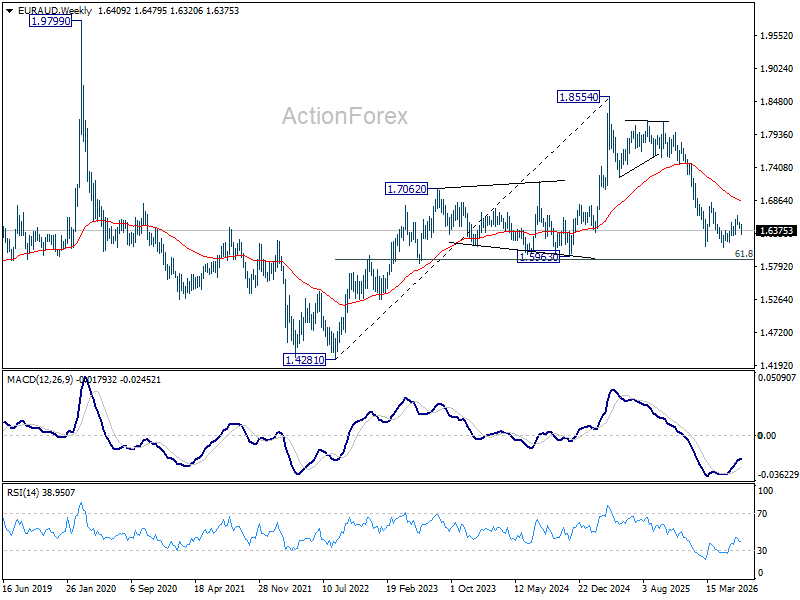
EUR/AUD Weekly Outlook
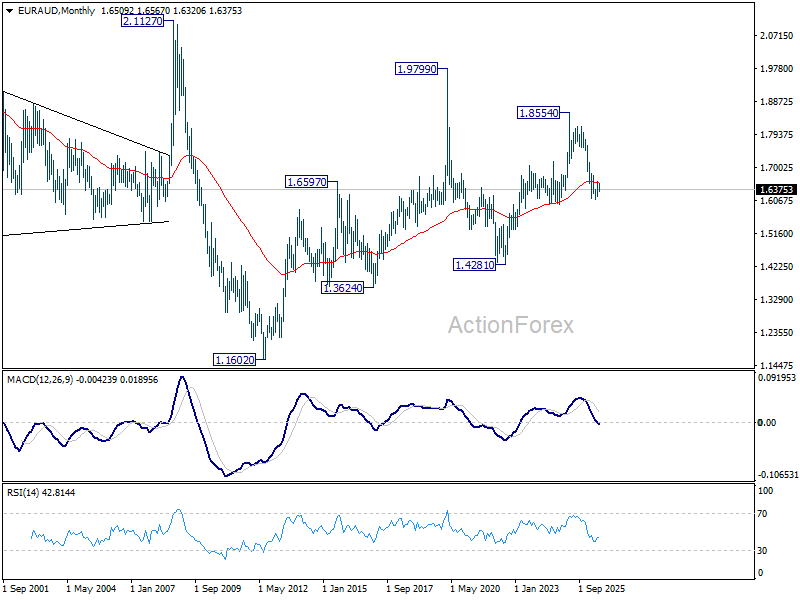
EUR/AUD's fall from 1.6617 extended lower last week but recovered ahead of 1.6306 support. Initial bias remains neutral this week first. On the upside, break of 1.6479 will argue that the pullback has completed, and revive near term bullishness. Further rise should be seen to 1.6617 first. However, firm break of 1.6306 will argue that the rebound has completed, and bring deeper decline to retest 1.61087 low instead.
In the bigger picture, outlook will stay bearish as long as 1.6842 resistance holds. Fall from 1.8554 (2025 high) is expected to continue to 61.8% retracement of 1.4281 to 1.8554 at 1.5913. Decisive break there will pave the way back to 1.4281 (2022 low). However, firm break of 1.6842 should confirm medium term bottoming, and bring stronger rally.
In the longer term picture, fall from 1.8554 is seen as the third leg of the pattern from 1.9799 (2020 high), which is part of the pattern from 2.1127 (2008 high). Sustained trading below 55 M EMA (now at 1.6577) will confirm this bearish case, and pave the way back towards 1.4281.
EUR/CHF Weekly Outlook
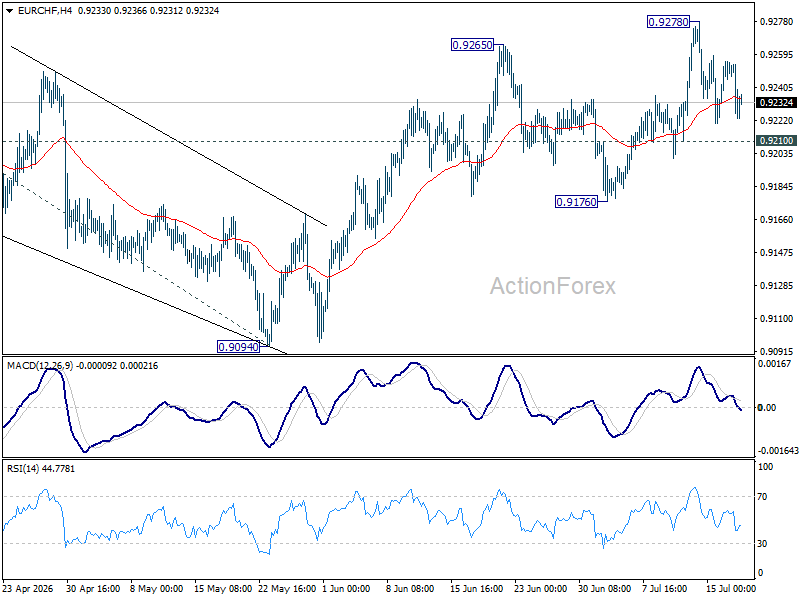
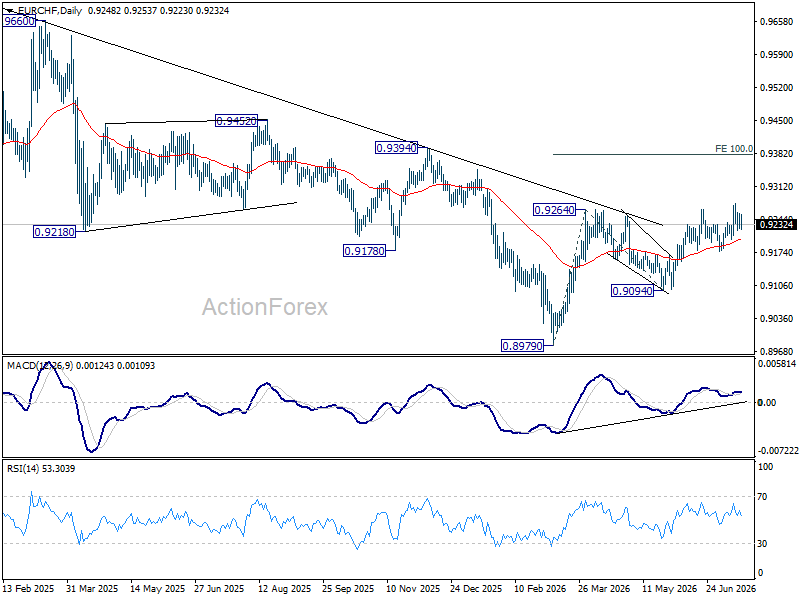
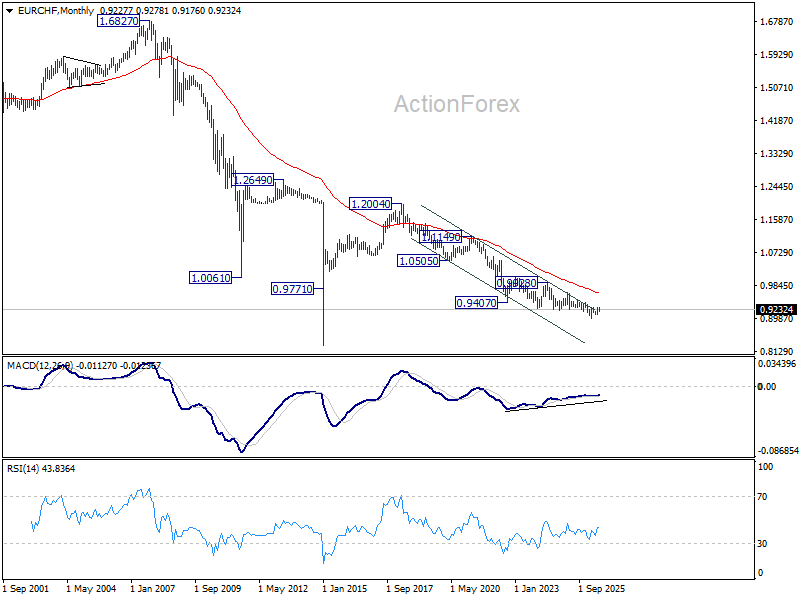
EUR/CHF edged higher to 0.9278 last week but turned sideway since then. Initial bias remains neutral this week for more consolidations, but further rally is still in favor. Break of 0.9278 will resume the rise from 0.8979 to 100% projection of 0.8979 to 0.9264 from 0.9094 at 0.9379. However, decisive break of 0.9210 support will turn bias back to 0.9176 support instead.
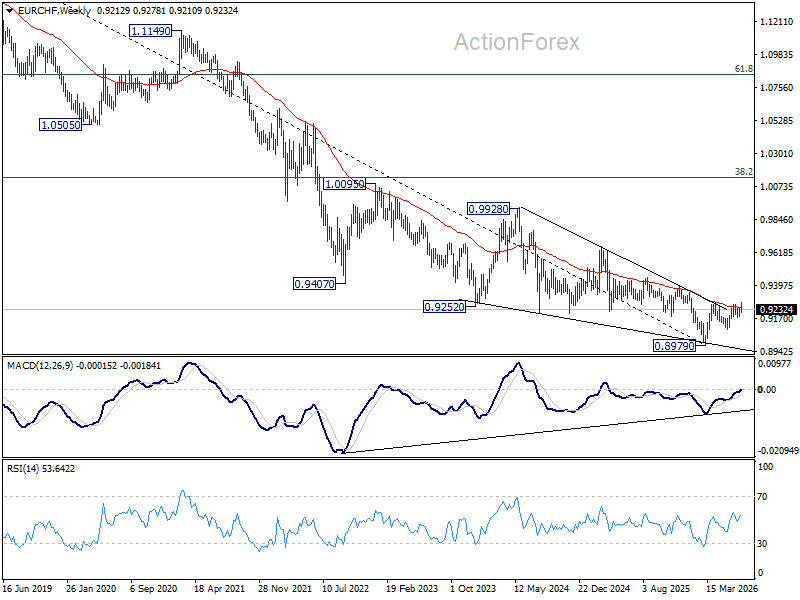
In the bigger picture, the break of medium term falling trend line resistance indicates that 0.8979 is already a medium term bottom. Considering bullish convergence condition in W MACD, rise from there should at least be reversing the fall from 0.9928, with prospect of developing into a medium term up trend. Firm break of 0.9394 resistance will add more credence to this case. For now risk will remain on the upside as long as 0.9094 support holds, in case of retreat.
In the long term picture, outlook will stay bearish as long as 0.9407 support turned resistance (2022 low) holds. However, firm break of 0.9407 will argue that the down trend from 1.2004 (2018 high) has completed with five waves down to 0.8979. Stronger rebound should then be seen to 38.2% retracement of 1.2004 to 0.8979 at 1.0135 in the medium term.
The Weekly Bottom Line: NATO Tensions to Nasdaq Records
Our summary of recent economic events and what to expect in the weeks ahead.
Canadian Highlights
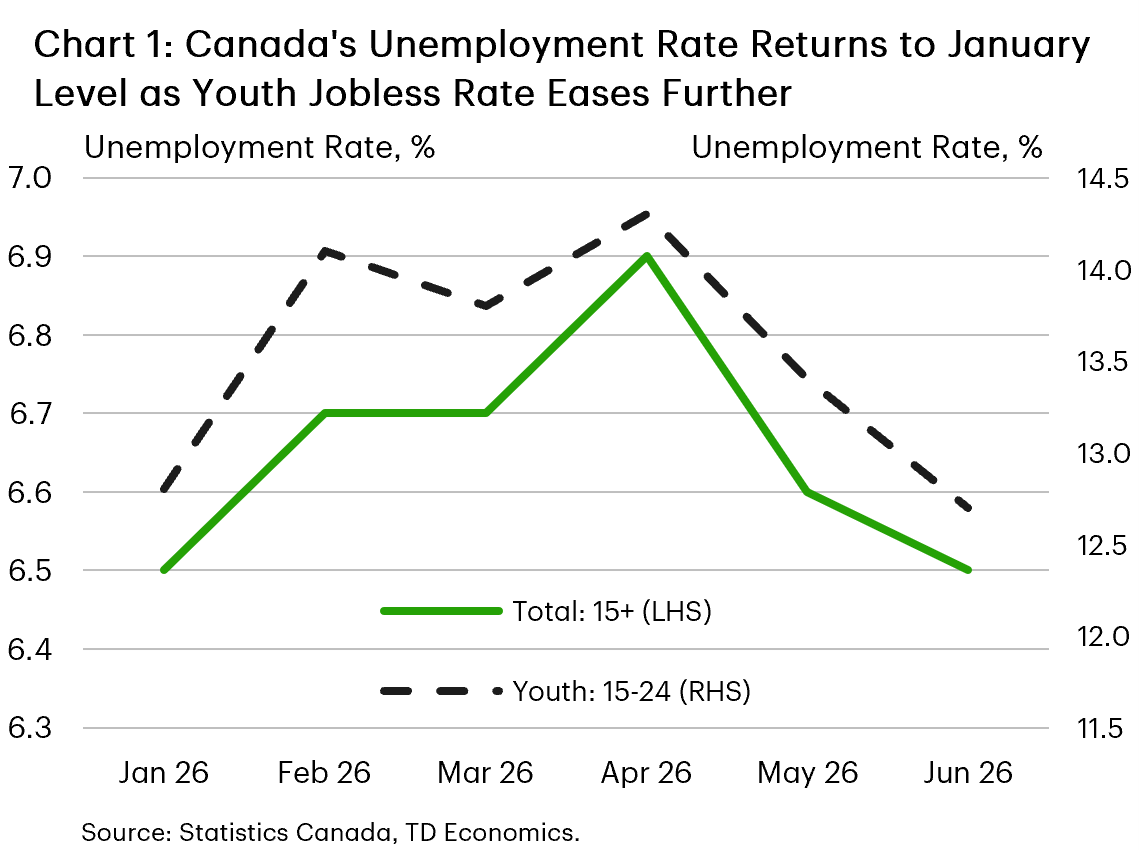
- Canada's economy added 18k jobs in June, while the unemployment rate edged down to a five-month low of 6.5%.
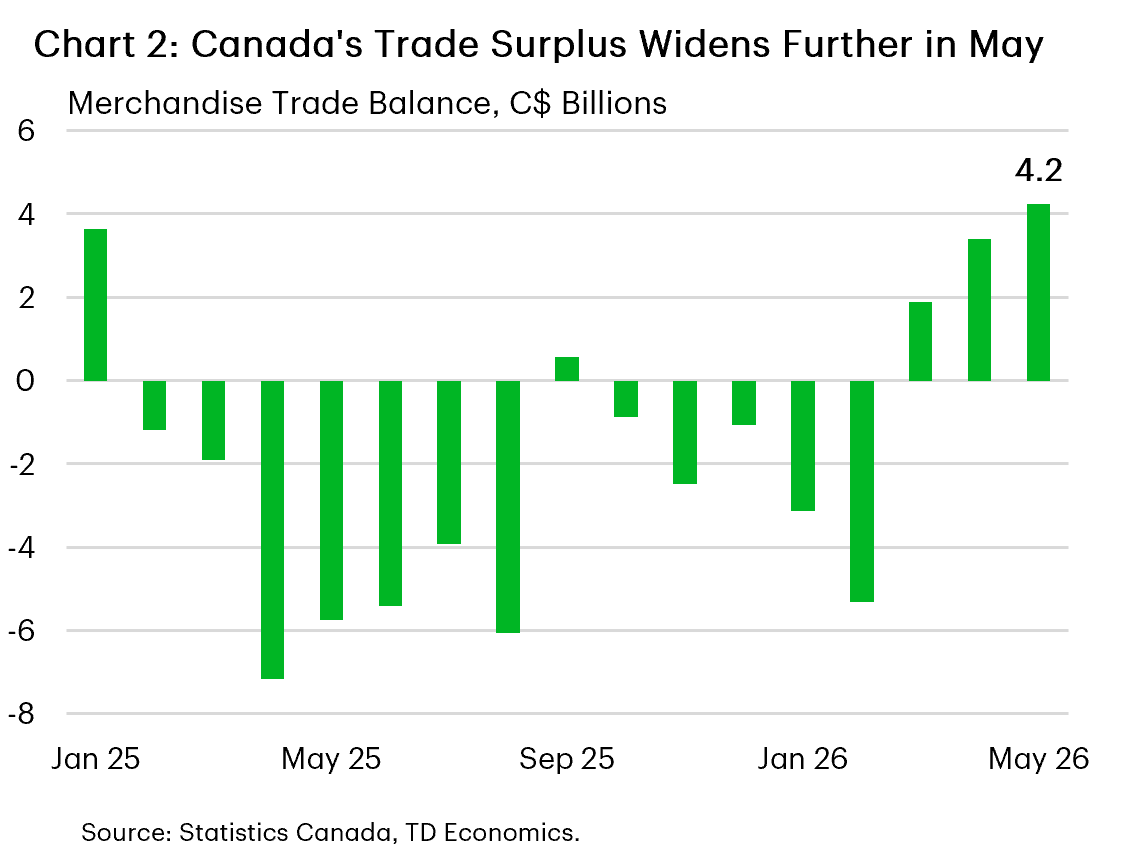
- Canada's merchandise trade surplus widened in May, strengthening the case for a rebound in second quarter growth.
- Business and consumer sentiment remained subdued, amid an uptick in household inflation expectations. Still, it's unlikely to alter the BoC's outlook, with rates expected to remain at 2.25% at next week's announcement.
U.S. Highlights
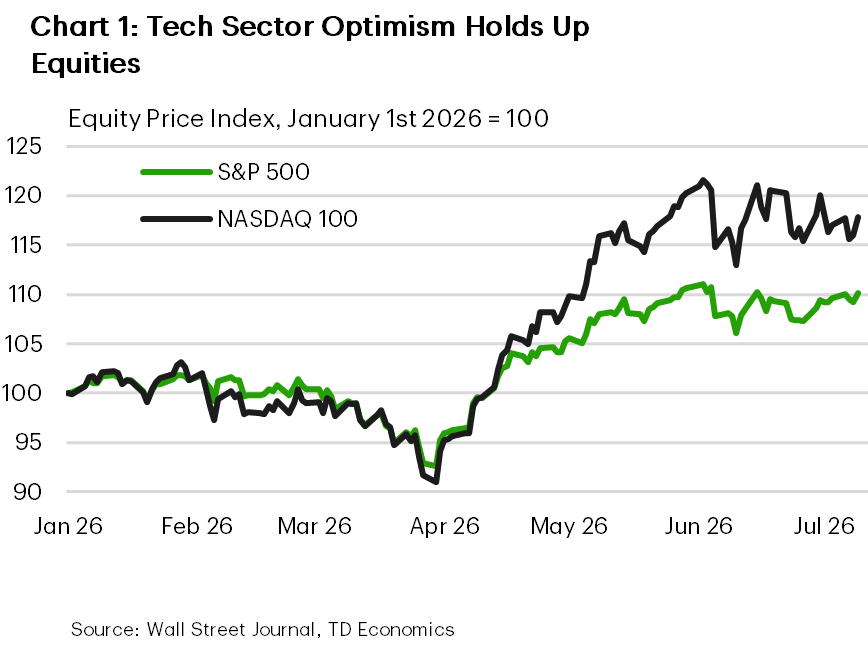
- Markets looked through a week of geopolitical whiplash, with AI and chip optimism helping keep U.S. equities close to record highs.
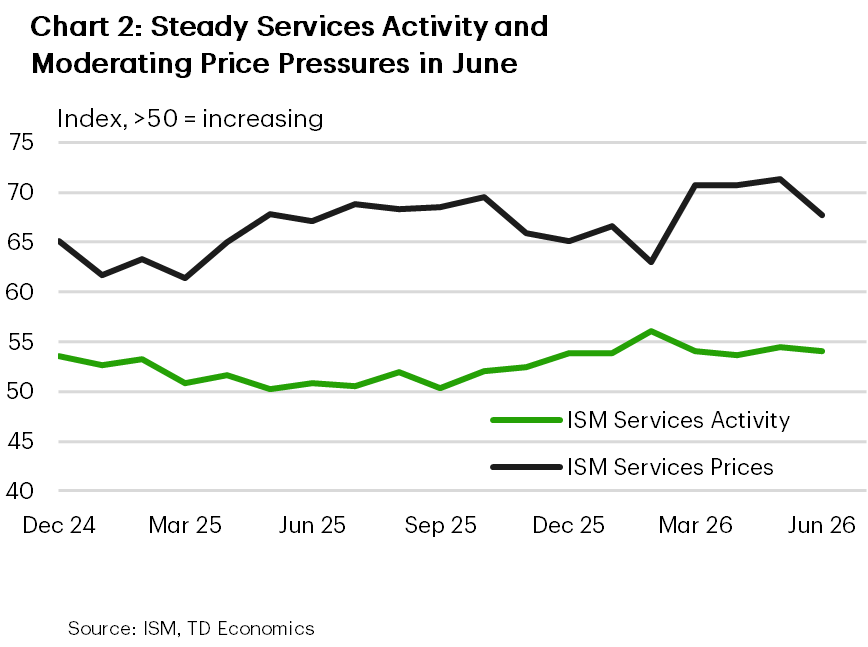
- The ISM Services Index eased only modestly in June, with activity and orders still expanding and employment returning to growth.
- Existing home sales disappointed as affordability remained binding, while the FOMC minutes underscored a Fed that is divided but still inflation-focused.
Canada – Steps in the Right Direction
Summer time, and the living is easy– or at least that's the impression from this week's economic data. Trade surprised to the upside, while another month of job gains, albeit modest, suggest the economy remains in a low gear, but has shaken off recession concerns. Markets largely took the releases in stride, with attention squarely focused on developments in energy markets. The collapse of the fragile Middle East ceasefire pushed crude oil prices higher on the week. The S&P TSX ended the week flat, while the loonie appreciated by roughly one cent against the U.S. dollar.
Canada's economy added 18k jobs in June, with hiring concentrated in the private sector, led by accommodation and food services. The unemployment rate edged down to 6.5%, returning to where it began the year (Chart 1). Looking through the month-to-month volatility, the broader picture remains encouraging: employment is up year-on-year, with hiring concentrated in full-time, private sector positions while the unemployment rate has eased a touch faster than anticipated in our June forecast. Another welcome development is the improvement in youth labour market conditions with the youth unemployment rate falling to 12.7%, down from a peak of 14.6% last September. Statistics Canada also noted that the student summer job market appears more favourable than a year ago.
Trade provided further evidence that the economy is moving in the right direction. Canada's merchandise trade surplus widened to $4.2 billion in May, extending the improvement seen in recent months (Chart 2). The increase was driven primarily by stronger exports to the U.S., while exports to non-U.S. destinations continued to ease. Imports edged lower, partially reversing April's increase. Taken together with April's GDP report, the latest trade data strengthen the case that economic growth will rebound in the second quarter following softer prints in each of the prior two quarters.
That said, the trade picture remains far from settled. Monthly trade flows continue to be heavily influenced by volatile sectors, suggesting that the contribution from net exports is likely to remain uneven over the remainder of the year. More importantly, elevated trade policy uncertainty continues to weigh on business and household confidence. That caution was evident in the Bank of Canada's latest Business Outlook Survey and Canadian Survey of Consumer Expectations. Business sentiment remained subdued in the second quarter, amid softer hiring intentions and continued reports of weak demand. Consumers also remained cautious, while their inflation expectations edged modestly higher. One caveat is that surveys were conducted during the recent energy-price spike and therefore likely overstate the persistence of underlying inflation pressures.
Taken together, this week's releases remain consistent with our broader outlook. An improvement in trade alongside a labour market that continues to generate jobs suggest that the economy is hanging in there despite elevated uncertainty. With little evidence that higher oil prices are spilling over to broader inflation, we expect the Bank of Canada to keep rates unchanged at 2.25% at next week's policy meeting.
Maria Solovieva, CFA, Economist
U.S. – NATO Tensions to Nasdaq Records
The week began with investors juggling another round of geopolitical whiplash. The NATO summit delivered shifting headlines on the U.S.-Iran conflict, including renewed doubts over the durability of the ceasefire and subsequent reports of technical talks. Oil prices moved with each headline, but the broader equity market held up well. The S&P 500 remained near its early-June record and is up roughly 10% this year, while the Nasdaq was buoyed by renewed enthusiasm around AI-linked chip demand (Chart 1). In short, markets are still willing to look through geopolitical uncertainty so long as energy prices stay contained and the tech earnings story remains intact.
The week's data offered some support for that resilience narrative. The ISM Services Index slipped to 54.0 in June from 54.5 in May but remained comfortably in expansionary territory for the 24th consecutive month. The details were mixed, but not alarming. Business activity and new orders cooled, while the employment index moved back above 50 for the first time in four months. Price pressures also eased, with the prices-paid index falling to 67.7 from 71.3, though that still leaves service-sector inflation running hot (Chart 2). The takeaway is that demand is moderating, but the services economy is not rolling over.
Housing sent a less encouraging signal. Existing home sales fell 2.4% in June to a 4.09 million annualized pace, missing expectations, while the median resale price rose to a record $440,600. Inventory remains too thin to generate meaningful price relief, and elevated mortgage rates continue to keep both buyers and sellers on the sidelines. Meanwhile, the FOMC minutes showed a Committee still wrestling with the inflation outlook. Officials appeared split between scenarios where lower energy prices and fading tariff effects allow inflation to cool, and scenarios where persistent price pressures driven by AI-related investment demand require tighter policy. New York Fed President John Williams later argued that the minutes effectively captured the Committee's 'collective reaction function,' emphasizing that policymakers are weighing a range of inflation scenarios rather than signaling a predetermined rate path.
Taken together, the week's data point to an economy that is cooling at the margin, but still posting moderate growth. Services activity remains expansionary and hiring has stabilized, while housing remains constrained by affordability rather than excess weakness in demand. The FOMC minutes confirm that the Fed is not on a preset course, but they also do not offer much comfort to markets looking for imminent easing, or even an anchor for their expectations. The bar for another hike likely depends on whether inflation proves broader and more persistent. That makes next week critical: CPI will test whether price pressures are easing, while Chair Warsh's testimony to Congress should clarify how the Fed is weighing inflation risks against a still-resilient growth backdrop.
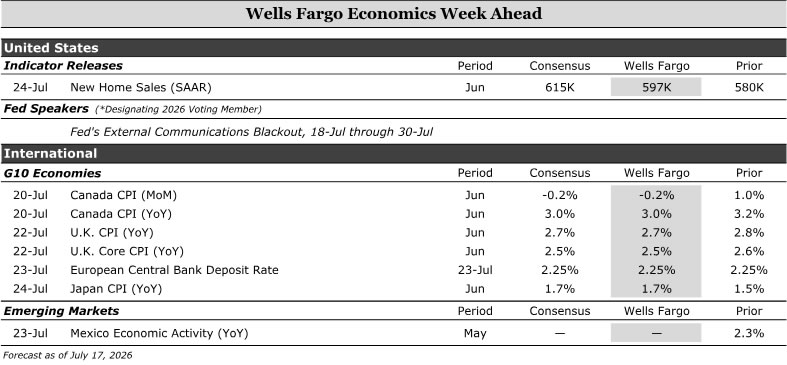
Economics Week Ahead
We expect new home sales to rebound modestly in June following recent weakness, although elevated mortgage rates and soft buyer demand suggest housing activity remains subdued.
Internationally, we expect Canadian inflation to ease modestly, while U.K. inflation and labor market data should provide insight into whether underlying price pressures remain persistent. We anticipate the ECB will leave rates unchanged while maintaining a cautious stance on inflation. In Australia, labor market data are unlikely to materially alter the outlook for further policy tightening. In Japan, inflation data will be closely watched for signs that price growth is holding up. Among emerging markets, Mexico's economic activity data should provide insight into whether growth is stabilizing after a soft start to the year.
- United States: New Home Sales (Friday)
- G10 Economies: Canada CPI (Monday), U.K. CPI + Labor Force Survey (Wednesday), European Central Bank Deposit Rate (Thursday), Australia Labor Force Survey (Thursday), Japan CPI (Friday)
- Emerging Markets: Mexico Economic Activity (Thursday)
U.S. Week Ahead
New Home Sales • Friday
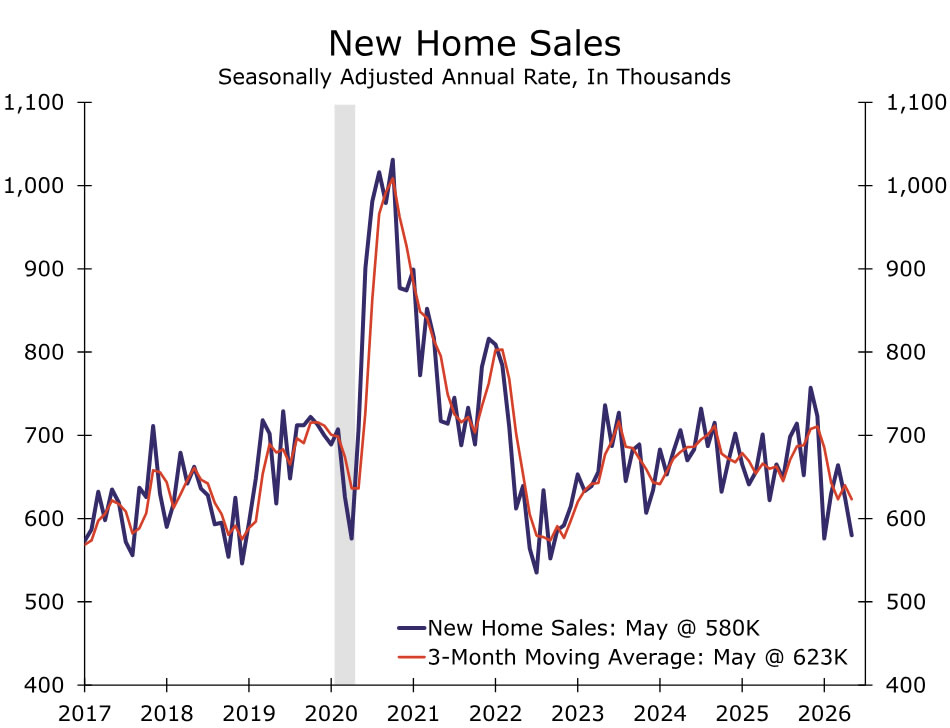
We anticipate that new home sales rose 2.9% in June. Transactions appear poised for an improvement following back-to-back slips in April and May. That said, our expectation for a 597K annual pace of sales is still quite sluggish.
Inflation stemming from the U.S.-Iran war lifted the 30-year mortgage rate to 6.5% on average in June. Mortgage applications for purchase ticked up slightly over the month, but remained much lower than the trend at the close of 2025. Builders also continued to report poor sales conditions and weak buyer traffic, according to the NAHB. We see scope for new home sales to modestly strengthen this year as global price shocks fade and longer-term interest rates come down somewhat, especially as builders continue to utilize price cuts and other sales incentives. However, a meaningful acceleration in activity is unlikely.
G10 Week Ahead
Canada CPI • Monday
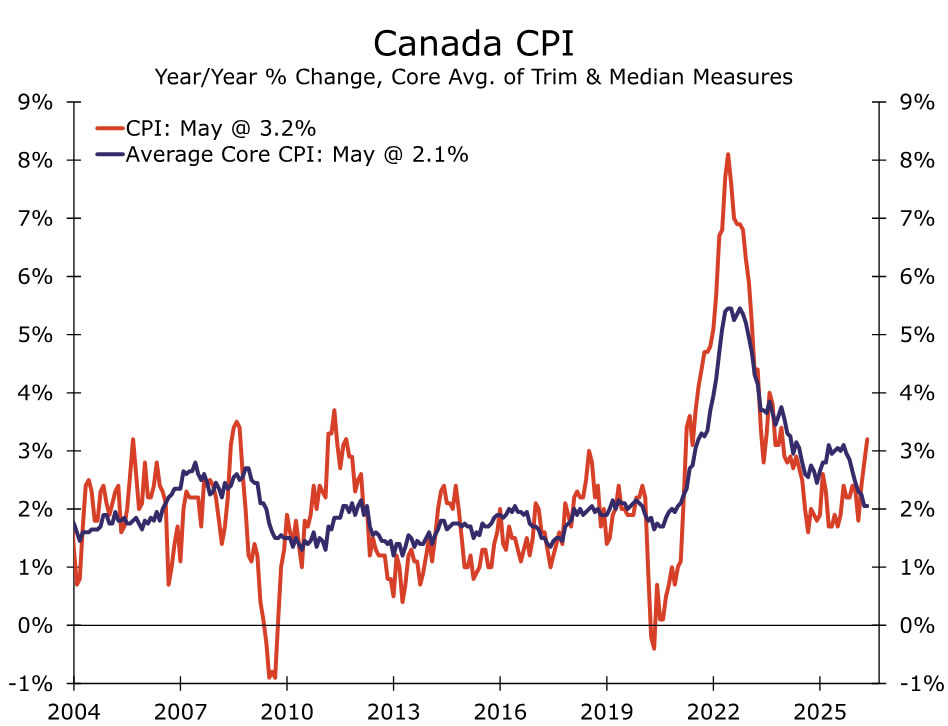
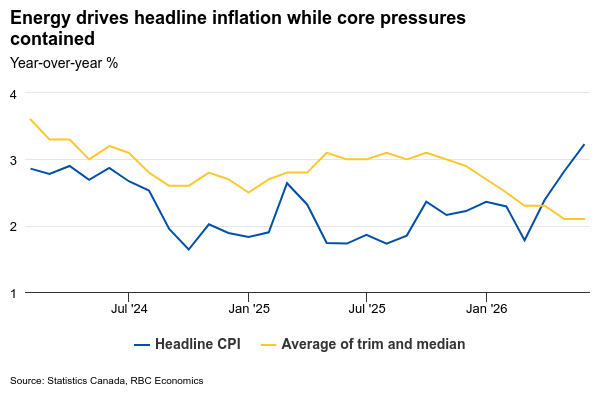
Underlying consumer inflation pressures remain relatively contained in Canada despite the recent upward move in headline prices stemming from higher oil costs. Importantly, measures of core inflation have shown little sign of broadening price pressures, with both the trimmed mean and weighted median measures moving sideways at or near 2% in May. The breadth of inflation has also narrowed with the share of CPI components growing above 3% falling back close to its historical average in recent months.
Inflation expectations also remain generally anchored, according to the Bank of Canada's (BoC) latest Q2 Survey of Consumer Expectations. While near-term inflation expectations remain somewhat elevated compared to prior to the pandemic, they're not showing signs of moving meaningfully higher. Five-year ahead expectations have inched up, but remain well within normal ranges.
We look for headline CPI to drop modestly in June amid the move lower in oil prices leading the year-ago rate to 3.0%. Core measures should, however, remain near recent months pace of about 2.0%. The BoC elected to keep rates steady at this past week's monetary policy meeting, and we expect it to continue to look through commodity-driven price increases unless they begin to feed more meaningfully into underlying inflation trends.
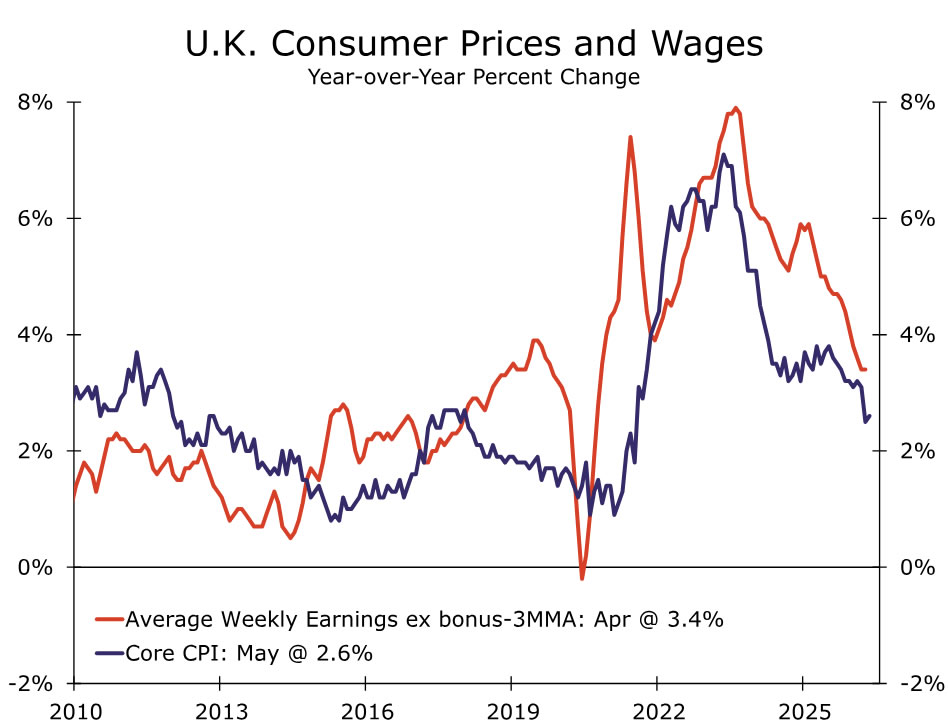
U.K. CPI + Labor Force Survey • Wednesday
The UK's June CPI and May labor market data are due next week and should provide further insight into the Bank of England's (BoE) policy outlook. We expect headline inflation to ease to 2.7% year over year from 2.8% in May, while core inflation edges down to 2.5% from 2.6%. Services inflation should also moderate to 3.6%, helped in part by lower airfares. Lower energy prices in June and the Ofgem price cap mechanism should provide additional support to disinflation.
The labor market also appears to be stabilizing. Consensus expectations are for the unemployment rate to remain unchanged at 4.9%, while regular pay growth, excluding bonuses, is likely to hold near April's pace of 3.4% year over year on a three-month average basis. Wage growth has continued to ease and remains below the BoE's projections, though services inflation and household inflation expectations remain elevated.
A softer labor market should reinforce the Monetary Policy Committee's cautious approach, particularly given the weak growth backdrop. However, policymakers are unlikely to place too much weight on a few favorable inflation prints, especially as recent energy price increases and renewed Middle East tensions have yet to fully filter through to the data. While we recently lowered our forecast from two rate hikes to one, we continue to see tightening risks. Our base case is now for a single hike in Q4, though a move in late Q3 remains possible if inflation pressures prove more persistent than expected.
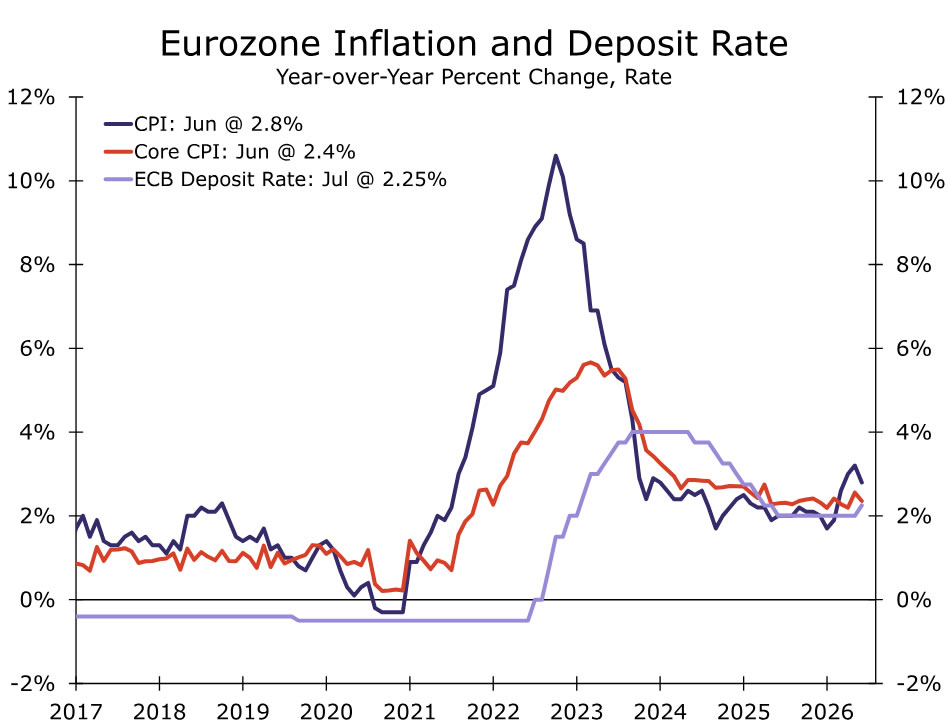
European Central Bank Deposit Rate • Thursday
We expect the European Central Bank (ECB) to leave rates unchanged next week, keeping the Deposit Rate at 2.25%. While inflation remains above the ECB's 2% target, recent data have been encouraging, with June headline and core inflation moderating from earlier highs. However, renewed tensions in the Middle East continue to pose upside risks to energy prices, which could complicate the disinflation process and delay further progress in underlying inflation.
The ECB's relatively hawkish tone comes despite the slowing growth backdrop. Wavering consumer confidence, moderating wage growth, and soft forward-looking PMI surveys suggest activity may remain subdued across the euro area. Economic weakness has been concentrated in Germany, where industrial activity and external demand remain under pressure, while service and tourism economies such as Spain have shown more resilience. An uneven growth picture complicates the outlook but is unlikely to outweigh the ECB's priority of ensuring inflation returns to target.
Easing inflation pressures support a hold next week, but we do not expect the ECB to signal that the inflation fight is over. We continue to expect one additional 25 bps hike later in Q3, likely September, although incoming inflation, wage, and energy data will remain critical to that outlook.
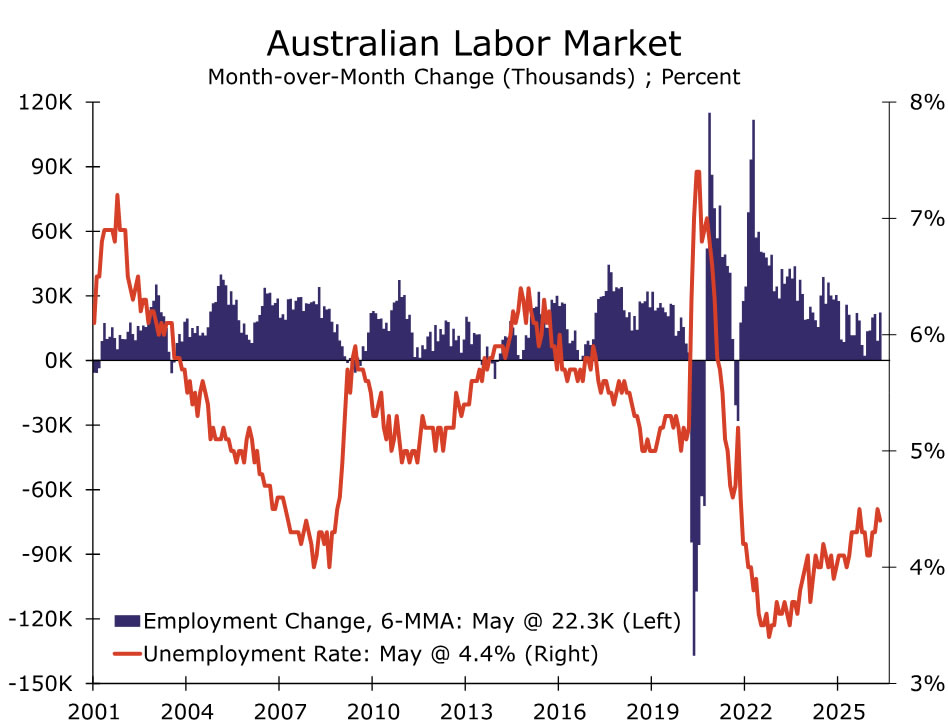
Australia Labor Force Survey • Thursday
Australia's June employment report is due next week and will provide the final labor market reading before the Reserve Bank of Australia's (RBA) August meeting. May employment rose 40.3K, although the details were less encouraging. Job gains were concentrated in part-time work, hours worked declined, and revised data showed underemployment was higher than initially reported. Recent labor market data have also been affected by revisions to population estimates and temporary seasonal distortions, leaving a less robust picture than the headline figures suggest. Business surveys and job ads also point to some moderation in labor market momentum.
Even so, we do not expect next week's employment data to materially alter the RBA's broader policy outlook. Policymakers have remained clear in recent speeches and post-meeting communications that inflation remains the primary concern and that further tightening may still be required. The June CPI release remains the more important input ahead of the August meeting. A softer inflation outcome could support another hold, but the recent outbreak of hostilities in the Middle East has increased the risk of renewed energy price pressures and delayed progress on disinflation.
As such, we continue to expect the RBA to deliver a 25 bp rate hike in Q3. August remains our base case, although a softer inflation print could push the move to September. Either way, policymakers appear committed to a front-loaded approach to ensure inflation returns to target.
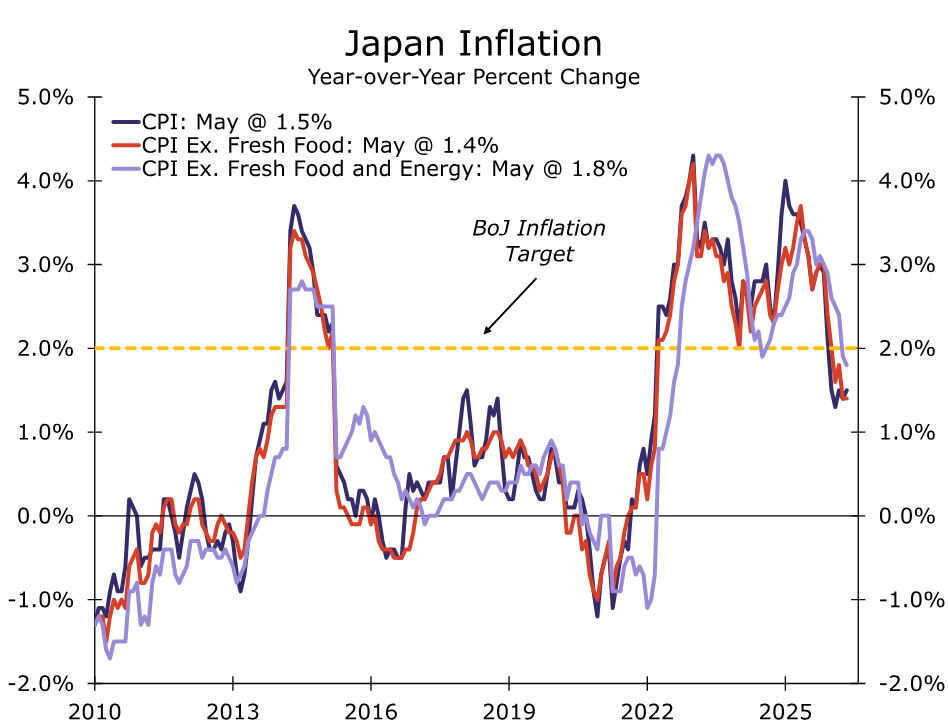
Japan CPI • Friday
Japan's June CPI release is due next week and should provide another test of whether underlying inflation remains strong enough to support further policy normalization. In recent months, inflation has moderated substantially where headline CPI is currently around 1.5% year over year in May, while core-core, the Bank of Japan's (BoJ) preferred gauge, has also trended lower to 1.8% year over year.
The BoJ's wage-price narrative remains somewhat mixed since labor cash earnings came in softer than expected, raising questions whether strong wage negotiations are fully translating into realized income growth. However, Tokyo CPI firmed in June at 1.7% year over year, providing a constructive signal given its strong historical relationship with nationwide CPI. Domestic demand indicators have also shown some improvement, with household spending strengthening on a sequential basis and services activity remaining supported by resilient PMI and non-manufacturing Tankan readings.
Even with inflation softer this year, the case for normalization remains intact. Policymakers are likely to focus on underlying inflation measures and wage developments, rather than headline CPI alone, particularly as energy-driven price swings can distort the near-term picture. Combined with strong Q1 GDP growth and a solid Q2 Tankan survey, a firmer inflation print would strengthen the case for further tightening. We continue to expect the BoJ to raise rates by 25 bps in Q4, most likely in October, bringing the policy rate to 1.25% by year-end.
EM Week Ahead
Mexico Economic Activity • Thursday
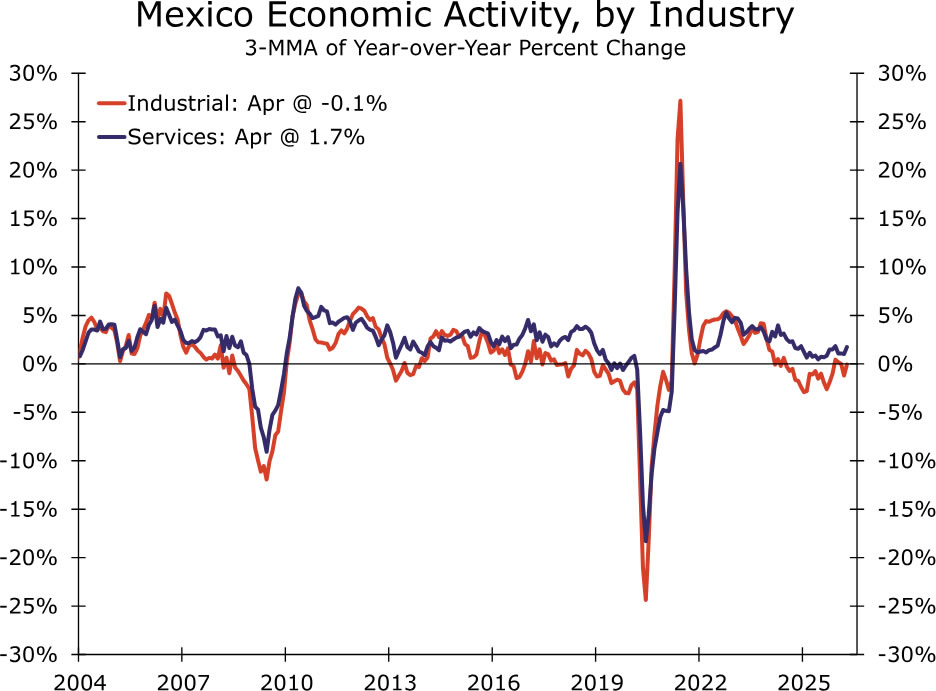
Next week's Economic Activity release for Mexico should provide further insight into whether growth stabilized in Q2 following a weak Q1. As a timely proxy for GDP, the data will help determine whether activity remains concentrated in services or is beginning to broaden into manufacturing.
Recent data suggests that services continue to support activity, aided by resilient retail sales and remittance inflows despite consumer confidence, wage growth and labor market conditions softening. The manufacturing outlook remains more nuanced. While industrial production has stayed subdued, manufacturing PMI has improved and U.S. manufacturing activity has generally remained resilient, raising the possibility that industrial activity is beginning to bottom out. That said, Mexico's manufacturing sector is still highly dependent on the U.S. cycle and faces ongoing uncertainty surrounding USMCA negotiations. We continue to expect that nearshoring momentum will gradually fade, which could weigh on investment and limit the scope for a broader manufacturing recovery.
We do not expect the release to materially alter Banxico's outlook and continue to expect rates to remain on hold at 6.50% through 2027. However, evidence of stronger and broadly based growth would reinforce the case for policymakers to remain comfortably on hold, while signs of renewed weakness could strengthen expectations for an eventual rate cut.
Summary 7/20 – 7/24
Monday, Jul 20, 2026
| GMT | Ccy | Events | Cons | Prev |
|---|---|---|---|---|
| 22:45 | NZD | Trade Balance (NZD) Jun | 800M | |
| 06:00 | CHF | Trade Balance (CHF) Jun | 6,110M | |
| 06:00 | EUR | Germany PPI M/M Jun | -0.20% | 0.30% |
| 06:00 | EUR | Germany PPI Y/Y Jun | 2.20% | |
| 12:30 | CAD | CPI M/M Jun | -0.20% | 1.00% |
| 12:30 | CAD | CPI Y/Y Jun | 3.20% | |
| 12:30 | CAD | CPI Median Y/Y Jun | 2.10% | |
| 12:30 | CAD | CPI Trimmed Y/Y Jun | 2.00% | |
| 12:30 | CAD | CPI Common Y/Y Jun | 2.70% |
| 22:45 | NZD |
| Trade Balance (NZD) Jun | |
| Consensus | |
| Previous | 800M |
| 06:00 | CHF |
| Trade Balance (CHF) Jun | |
| Consensus | |
| Previous | 6,110M |
| 06:00 | EUR |
| Germany PPI M/M Jun | |
| Consensus | -0.20% |
| Previous | 0.30% |
| 06:00 | EUR |
| Germany PPI Y/Y Jun | |
| Consensus | |
| Previous | 2.20% |
| 12:30 | CAD |
| CPI M/M Jun | |
| Consensus | -0.20% |
| Previous | 1.00% |
| 12:30 | CAD |
| CPI Y/Y Jun | |
| Consensus | |
| Previous | 3.20% |
| 12:30 | CAD |
| CPI Median Y/Y Jun | |
| Consensus | |
| Previous | 2.10% |
| 12:30 | CAD |
| CPI Trimmed Y/Y Jun | |
| Consensus | |
| Previous | 2.00% |
| 12:30 | CAD |
| CPI Common Y/Y Jun | |
| Consensus | |
| Previous | 2.70% |
Tuesday, Jul 21, 2026
| GMT | Ccy | Events | Cons | Prev |
|---|---|---|---|---|
| 22:45 | NZD | CPI Q/Q Q2 | 1.50% | 0.90% |
| 06:00 | GBP | Claimant Count Change Jun | 31.2K | |
| 06:00 | GBP | ILO Unemployment Rate (3M) May | 5.00% | 4.90% |
| 06:00 | GBP | Average Earnings Index 3M/Y | 4.50% | 4.40% |
| 09:00 | EUR | Germany ZEW Economic Sentiment Jul | 18 | 10.5 |
| 09:00 | EUR | Germany ZEW Current Situation Jul | -77.8 | -81 |
| 09:00 | EUR | Eurozone ZEW Economic Sentiment Jul | 10.2 | 9.5 |
| 22:45 | NZD |
| CPI Q/Q Q2 | |
| Consensus | 1.50% |
| Previous | 0.90% |
| 06:00 | GBP |
| Claimant Count Change Jun | |
| Consensus | |
| Previous | 31.2K |
| 06:00 | GBP |
| ILO Unemployment Rate (3M) May | |
| Consensus | 5.00% |
| Previous | 4.90% |
| 06:00 | GBP |
| Average Earnings Index 3M/Y | |
| Consensus | 4.50% |
| Previous | 4.40% |
| 09:00 | EUR |
| Germany ZEW Economic Sentiment Jul | |
| Consensus | 18 |
| Previous | 10.5 |
| 09:00 | EUR |
| Germany ZEW Current Situation Jul | |
| Consensus | -77.8 |
| Previous | -81 |
| 09:00 | EUR |
| Eurozone ZEW Economic Sentiment Jul | |
| Consensus | 10.2 |
| Previous | 9.5 |
Wednesday, Jul 22, 2026
| GMT | Ccy | Events | Cons | Prev |
|---|---|---|---|---|
| 23:50 | JPY | Trade Balance (JPY) Jun | -0.54T | -0.09T |
| 01:00 | AUD | Westpac Leading Index M/M Jun | 0.00% | |
| 06:00 | GBP | CPI M/M Jun | 0.20% | |
| 06:00 | GBP | CPI Y/Y Jun | 2.70% | 2.80% |
| 06:00 | GBP | Core CPI Y/Y Jun | 2.50% | 2.60% |
| 06:00 | GBP | RPI M/M Jun | 0.20% | |
| 06:00 | GBP | RPI Y/Y Jun | 3.00% | 3.10% |
| 06:00 | GBP | PPI Input M/M Jun | 0.20% | 0.20% |
| 06:00 | GBP | PPI Input Y/Y Jun | 8.70% | |
| 06:00 | GBP | PPI Output M/M Jun | 0.40% | 0.50% |
| 06:00 | GBP | PPI Output Y/Y Jun | 4% | |
| 06:00 | GBP | PPI Core Output M/M Jun | 0.80% | |
| 06:00 | GBP | PPI Core Output Y/Y Jun | 2.30% | |
| 14:30 | USD | Crude Oil Inventories (Jul 17) | -1.7M |
| 23:50 | JPY |
| Trade Balance (JPY) Jun | |
| Consensus | -0.54T |
| Previous | -0.09T |
| 01:00 | AUD |
| Westpac Leading Index M/M Jun | |
| Consensus | |
| Previous | 0.00% |
| 06:00 | GBP |
| CPI M/M Jun | |
| Consensus | |
| Previous | 0.20% |
| 06:00 | GBP |
| CPI Y/Y Jun | |
| Consensus | 2.70% |
| Previous | 2.80% |
| 06:00 | GBP |
| Core CPI Y/Y Jun | |
| Consensus | 2.50% |
| Previous | 2.60% |
| 06:00 | GBP |
| RPI M/M Jun | |
| Consensus | |
| Previous | 0.20% |
| 06:00 | GBP |
| RPI Y/Y Jun | |
| Consensus | 3.00% |
| Previous | 3.10% |
| 06:00 | GBP |
| PPI Input M/M Jun | |
| Consensus | 0.20% |
| Previous | 0.20% |
| 06:00 | GBP |
| PPI Input Y/Y Jun | |
| Consensus | |
| Previous | 8.70% |
| 06:00 | GBP |
| PPI Output M/M Jun | |
| Consensus | 0.40% |
| Previous | 0.50% |
| 06:00 | GBP |
| PPI Output Y/Y Jun | |
| Consensus | |
| Previous | 4% |
| 06:00 | GBP |
| PPI Core Output M/M Jun | |
| Consensus | |
| Previous | 0.80% |
| 06:00 | GBP |
| PPI Core Output Y/Y Jun | |
| Consensus | |
| Previous | 2.30% |
| 14:30 | USD |
| Crude Oil Inventories (Jul 17) | |
| Consensus | |
| Previous | -1.7M |
Thursday, Jul 23, 2026
| GMT | Ccy | Events | Cons | Prev |
|---|---|---|---|---|
| 01:30 | AUD | Employment Change Jun | 15.0K | 40.3K |
| 01:30 | AUD | Unemployment Rate Jun | 4.40% | 4.40% |
| 12:15 | EUR | ECB Rate On Deposit Facility | 2.25% | 2.25% |
| 12:15 | EUR | ECB Main Refinancing Operations Rate | 2.40% | 2.40% |
| 12:15 | EUR | ECB Monetary Policy Statement | ||
| 12:30 | CAD | Retail Sales M/M May | 1.00% | 0.50% |
| 12:30 | CAD | Retail Sales ex Autos M/M May | 0.40% | 0.10% |
| 12:30 | USD | Initial Jobless Claims (Jul 17) | 212K | 208K |
| 12:45 | EUR | ECB Press Conference | ||
| 14:00 | EUR | Eurozone Consumer Confidence Jul P | -17 | -18 |
| 14:30 | USD | Natural Gas Storage (Jul 17) | 41B |
| 01:30 | AUD |
| Employment Change Jun | |
| Consensus | 15.0K |
| Previous | 40.3K |
| 01:30 | AUD |
| Unemployment Rate Jun | |
| Consensus | 4.40% |
| Previous | 4.40% |
| 12:15 | EUR |
| ECB Rate On Deposit Facility | |
| Consensus | 2.25% |
| Previous | 2.25% |
| 12:15 | EUR |
| ECB Main Refinancing Operations Rate | |
| Consensus | 2.40% |
| Previous | 2.40% |
| 12:15 | EUR |
| ECB Monetary Policy Statement | |
| Consensus | |
| Previous | |
| 12:30 | CAD |
| Retail Sales M/M May | |
| Consensus | 1.00% |
| Previous | 0.50% |
| 12:30 | CAD |
| Retail Sales ex Autos M/M May | |
| Consensus | 0.40% |
| Previous | 0.10% |
| 12:30 | USD |
| Initial Jobless Claims (Jul 17) | |
| Consensus | 212K |
| Previous | 208K |
| 12:45 | EUR |
| ECB Press Conference | |
| Consensus | |
| Previous | |
| 14:00 | EUR |
| Eurozone Consumer Confidence Jul P | |
| Consensus | -17 |
| Previous | -18 |
| 14:30 | USD |
| Natural Gas Storage (Jul 17) | |
| Consensus | |
| Previous | 41B |
Friday, Jul 24, 2026
| GMT | Ccy | Events | Cons | Prev |
|---|---|---|---|---|
| 23:00 | AUD | Manufacturing PMI Jul P | 51.5 | |
| 23:00 | AUD | Services PMI Jul P | 50.5 | |
| 23:01 | GBP | GfK Consumer Confidence Jul | -21 | -23 |
| 23:30 | JPY | National CPI Y/Y Jun | 1.50% | |
| 23:30 | JPY | National CPI Core Y/Y Jun | 1.60% | 1.40% |
| 23:30 | JPY | National CPI Core-Core Y/Y Jun | 1.80% | |
| 00:30 | JPY | Manufacturing PMI Jul P | 54.5 | 54.8 |
| 00:30 | JPY | Services PMI Jul P | 52.2 | |
| 06:00 | EUR | Germany GfK Consumer Confidence Aug | -28.5 | -29.2 |
| 06:00 | GBP | Retail Sales M/M Jun | 0.20% | 1.20% |
| 07:15 | EUR | France Manufacturing PMI Jul P | 51 | 51.2 |
| 07:15 | EUR | France Services PMI Jul P | 48 | 46.8 |
| 07:30 | EUR | Germany Manufacturing PMI Jul P | 50.1 | 50.3 |
| 07:30 | EUR | Germany Services PMI Jul P | 48.8 | 48.6 |
| 08:00 | EUR | Eurozone Manufacturing PMI Jul P | 51.3 | 51.4 |
| 08:00 | EUR | Eurozone Services PMI Jul P | 49.8 | 49.4 |
| 08:30 | GBP | Manufacturing PMI Jul P | 52.1 | 52.5 |
| 08:30 | GBP | Services PMI Jul P | 49.6 | 48.8 |
| 12:30 | CAD | Industrial Product Price M/M Jun | 1.20% | |
| 12:30 | CAD | New Housing Price Index M/M Jun | -0.30% | |
| 12:30 | CAD | Raw Material Price Index Jun | 0.70% | |
| 13:45 | USD | Manufacturing PMI Jul P | 54.5 | 53.9 |
| 13:45 | USD | Services PMI Jul P | 51 | 51.2 |
| 14:00 | USD | New Home Sales M/M Jun | 617K | 580K |
| 23:00 | AUD |
| Manufacturing PMI Jul P | |
| Consensus | |
| Previous | 51.5 |
| 23:00 | AUD |
| Services PMI Jul P | |
| Consensus | |
| Previous | 50.5 |
| 23:01 | GBP |
| GfK Consumer Confidence Jul | |
| Consensus | -21 |
| Previous | -23 |
| 23:30 | JPY |
| National CPI Y/Y Jun | |
| Consensus | |
| Previous | 1.50% |
| 23:30 | JPY |
| National CPI Core Y/Y Jun | |
| Consensus | 1.60% |
| Previous | 1.40% |
| 23:30 | JPY |
| National CPI Core-Core Y/Y Jun | |
| Consensus | |
| Previous | 1.80% |
| 00:30 | JPY |
| Manufacturing PMI Jul P | |
| Consensus | 54.5 |
| Previous | 54.8 |
| 00:30 | JPY |
| Services PMI Jul P | |
| Consensus | |
| Previous | 52.2 |
| 06:00 | EUR |
| Germany GfK Consumer Confidence Aug | |
| Consensus | -28.5 |
| Previous | -29.2 |
| 06:00 | GBP |
| Retail Sales M/M Jun | |
| Consensus | 0.20% |
| Previous | 1.20% |
| 07:15 | EUR |
| France Manufacturing PMI Jul P | |
| Consensus | 51 |
| Previous | 51.2 |
| 07:15 | EUR |
| France Services PMI Jul P | |
| Consensus | 48 |
| Previous | 46.8 |
| 07:30 | EUR |
| Germany Manufacturing PMI Jul P | |
| Consensus | 50.1 |
| Previous | 50.3 |
| 07:30 | EUR |
| Germany Services PMI Jul P | |
| Consensus | 48.8 |
| Previous | 48.6 |
| 08:00 | EUR |
| Eurozone Manufacturing PMI Jul P | |
| Consensus | 51.3 |
| Previous | 51.4 |
| 08:00 | EUR |
| Eurozone Services PMI Jul P | |
| Consensus | 49.8 |
| Previous | 49.4 |
| 08:30 | GBP |
| Manufacturing PMI Jul P | |
| Consensus | 52.1 |
| Previous | 52.5 |
| 08:30 | GBP |
| Services PMI Jul P | |
| Consensus | 49.6 |
| Previous | 48.8 |
| 12:30 | CAD |
| Industrial Product Price M/M Jun | |
| Consensus | |
| Previous | 1.20% |
| 12:30 | CAD |
| New Housing Price Index M/M Jun | |
| Consensus | |
| Previous | -0.30% |
| 12:30 | CAD |
| Raw Material Price Index Jun | |
| Consensus | |
| Previous | 0.70% |
| 13:45 | USD |
| Manufacturing PMI Jul P | |
| Consensus | 54.5 |
| Previous | 53.9 |
| 13:45 | USD |
| Services PMI Jul P | |
| Consensus | 51 |
| Previous | 51.2 |
| 14:00 | USD |
| New Home Sales M/M Jun | |
| Consensus | 617K |
| Previous | 580K |
Canada’s Headline Inflation Likely Eased While Core Prices Held Steady
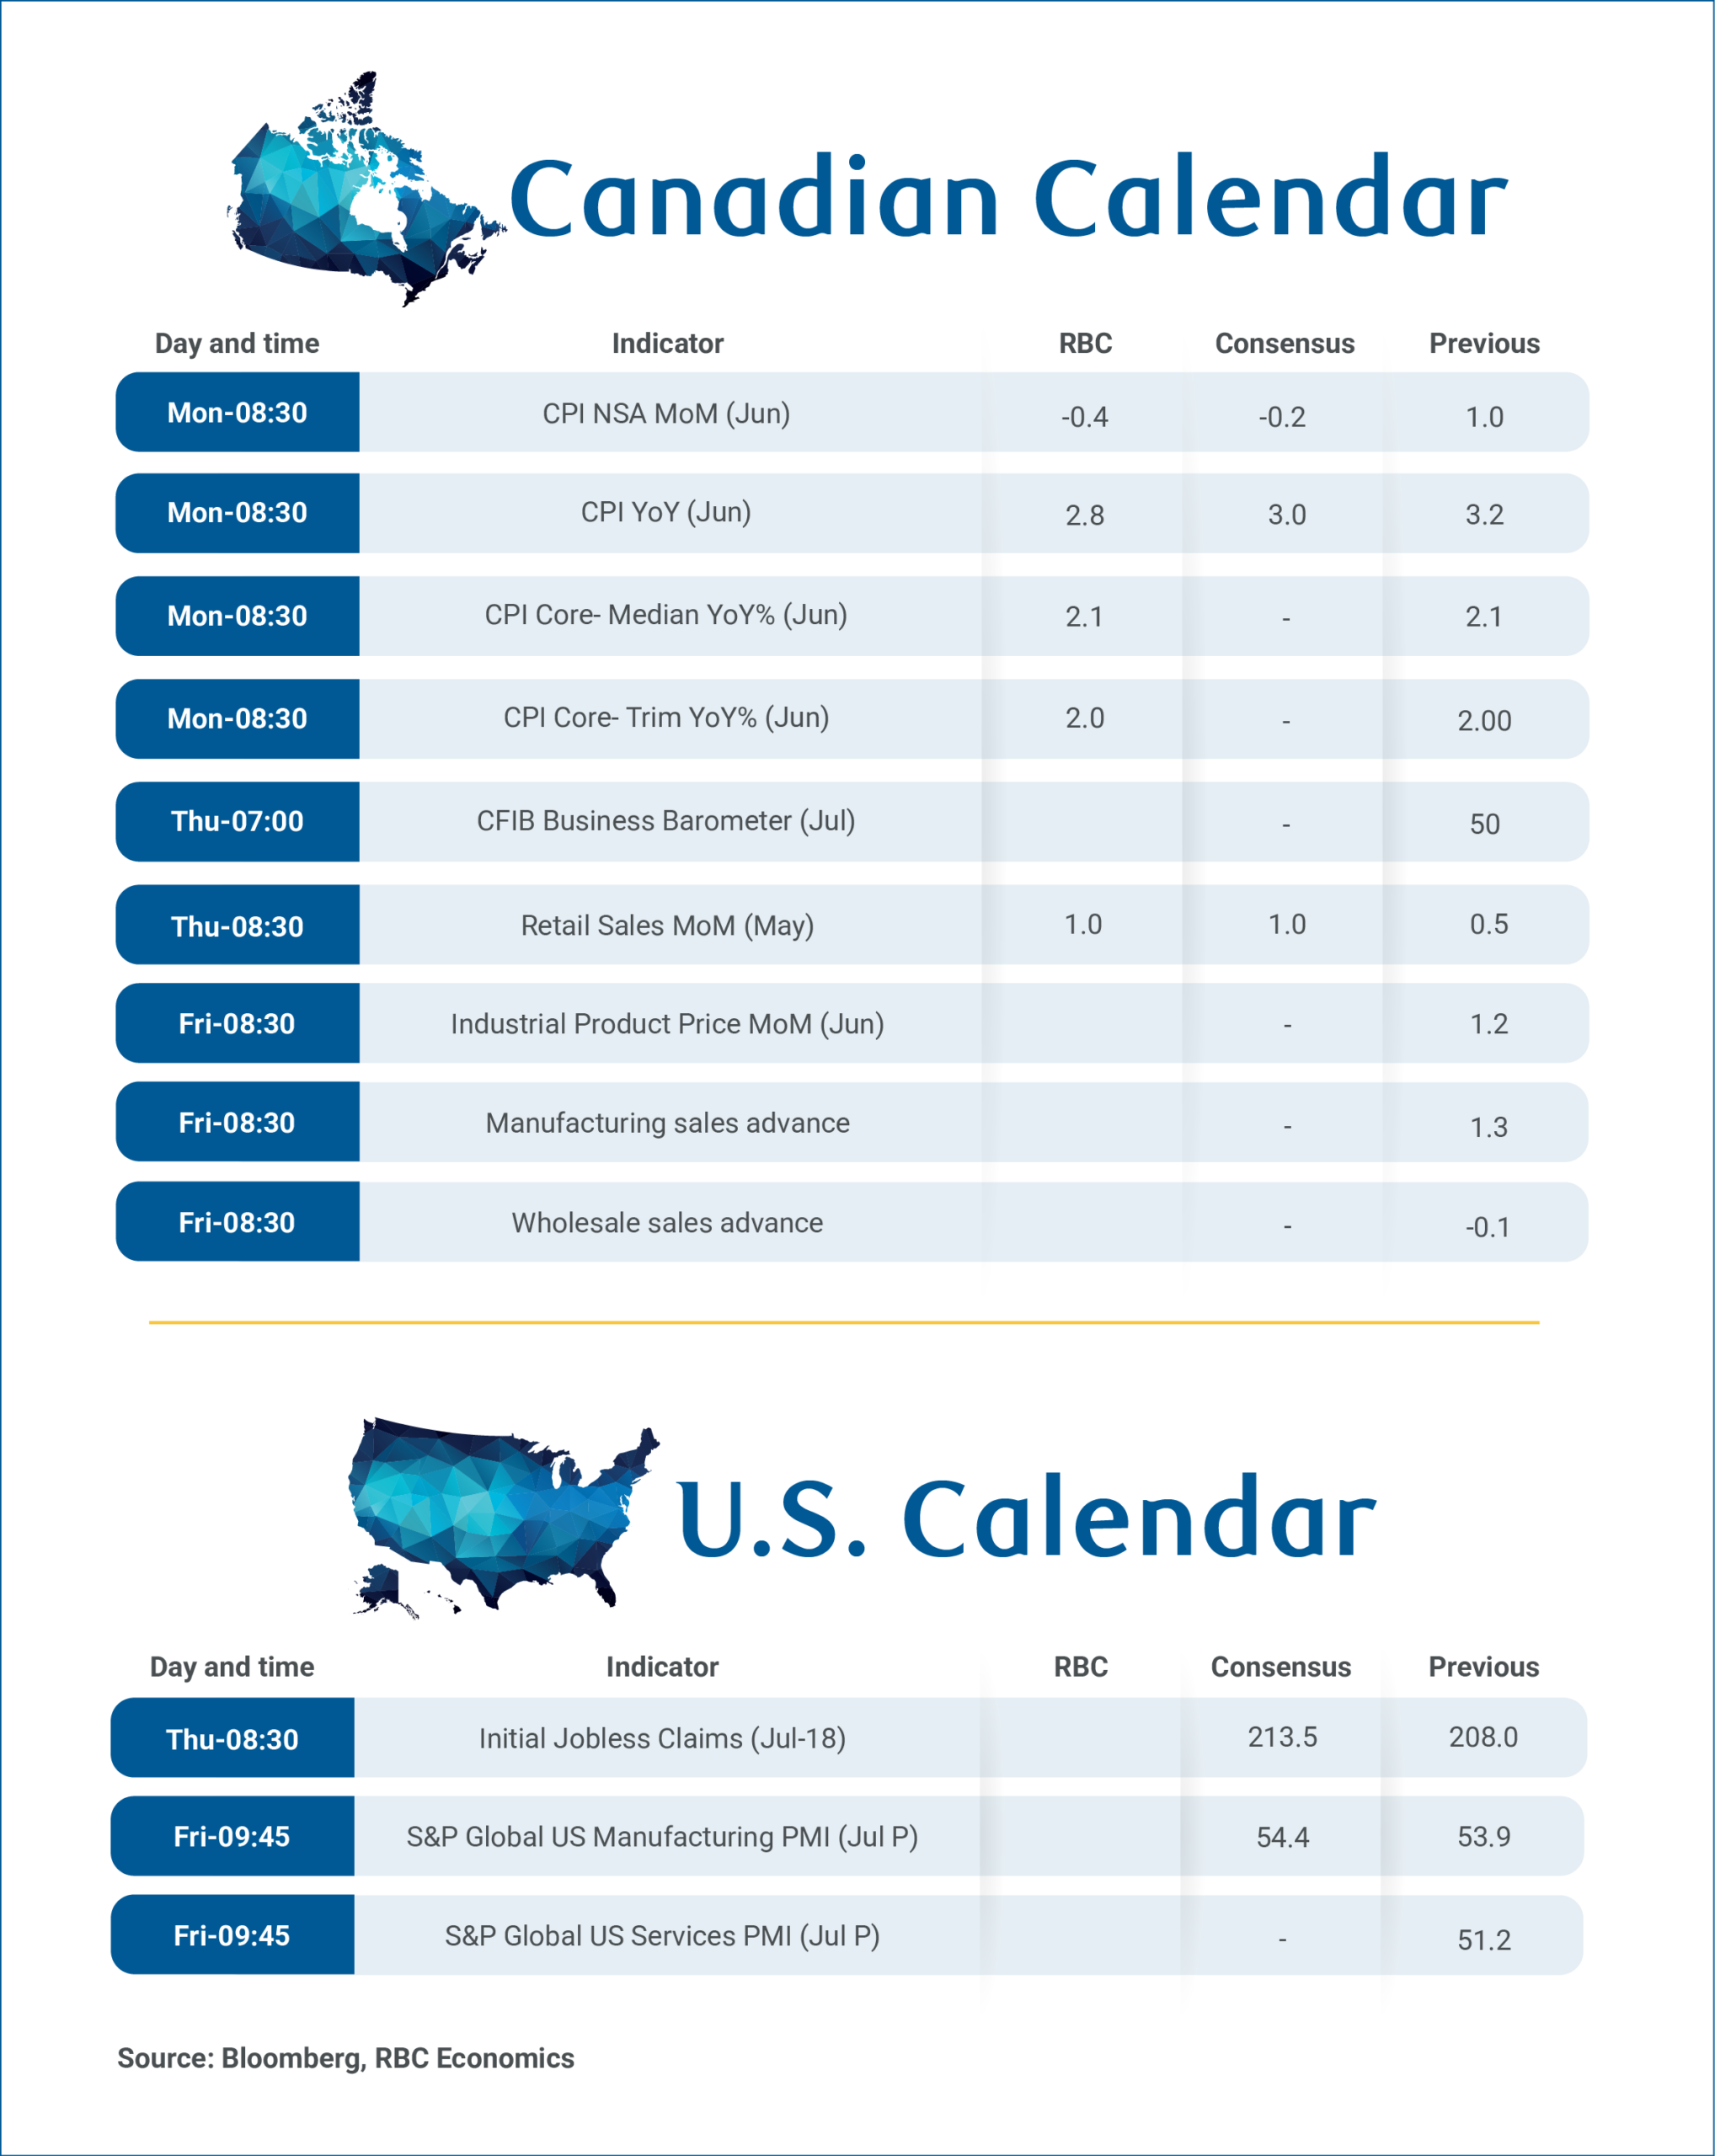
June’s Consumer Price Index report on Monday will provide an updated look at inflation trends following the Bank of Canada's decision to leave interest rates unchanged for a sixth consecutive meeting.
We expect headline inflation eased to 2.8% year-over-year, down from 3.2% in May. Much of the moderation is expected to reflect lower energy prices in June with gasoline and fuel prices declining 10% and 6.3%, respectively, from May.
Energy prices are still expected to remain higher from a year ago, but their contribution to headline inflation should moderate. Food price inflation, meanwhile, is expected to remain firm at 3.6%, easing only modestly from 3.8% in May.
Outside of more volatile components, inflation pressures are expected to remain broadly stable.
We expect inflation excluding food and energy to hold close to 1.6% y/y, little changed from May, while the BoC's preferred core inflation measures are likely to remain consistent with inflation running near the 2% target.
Recent inflation reports have continued to point to a divergence between headline and underlying inflation with headline readings boosted by elevated energy prices, while broader price pressures have stayed comparatively contained.
That distinction is likely to remain central to the BoC’s assessment of the inflation outlook. Policymakers have emphasized they are focused on whether higher energy costs spill over into broader consumer prices rather than on the direct impact of commodity price movements.
To date, there has been little evidence of such second-round effects, supporting the central bank’s view that underlying inflation remains consistent with price stability. This is in line with both the BoC's latest projections and our base case forecasts, which assume inflation will gradually return toward the 2% target over the forecast horizon while the central bank remains on hold through 2026.
Statistics Canada's preliminary estimate points to a 1% increase in nominal retail sales in June, led by stronger sales at gasoline stations and higher motor vehicle purchases. After adjusting for price effects, we estimate retail sales rebounded by about 0.5%, consistent with our tracking that household spending stays resilient despite higher energy prices.
Week Ahead – Could Technology Earnings Revive Equities as Geopolitical Risks Linger?
- Oil prices rise, but the dollar posts losses as Middle East tensions persist.
- US earnings, the ECB and UK newsflow dominate next week's agenda.
- US equity markets face a pivotal test as focus shifts to technology earnings.
- Pound strength could be challenged, while Euro rally relies on a hawkish ECB surprise.
Dollar weakens, Oil jumps and equities underperform
Amidst a mixed trading week, the US dollar, oil and US equities have been in the spotlight. Following a mixed start to July, the softer CPI and PPI reports put the greenback under pressure, overshadowing the persistent hawkish rhetoric from Fed Chair Warsh. However, equity weakness and some degree of safe haven flows linked to renewed Middle East tensions eventually limited dollar losses.
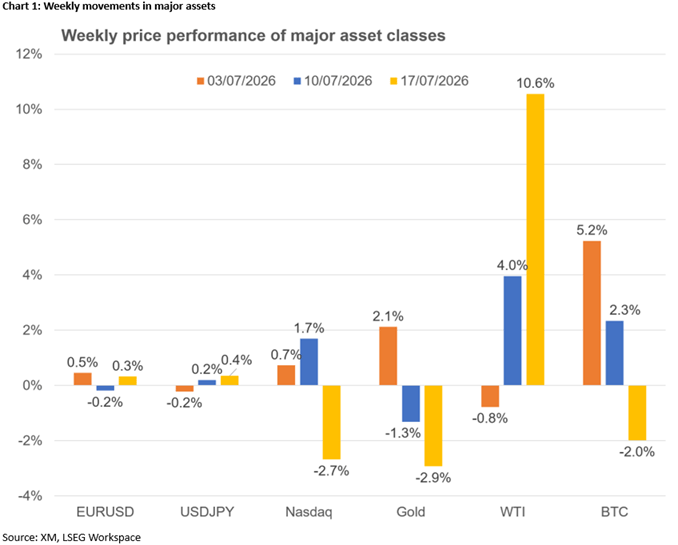
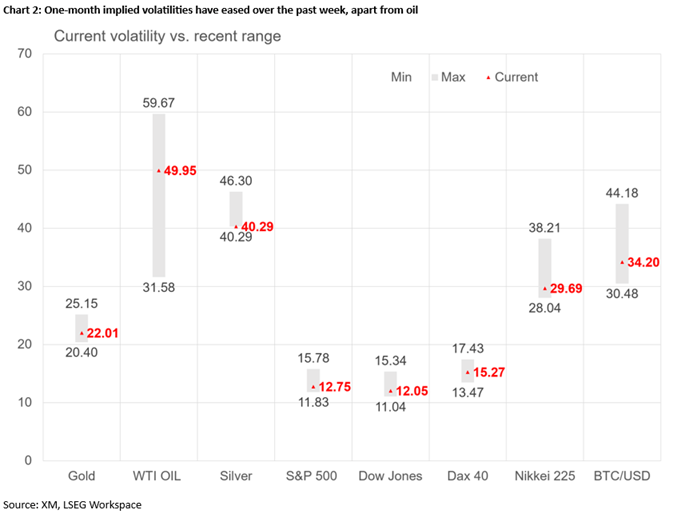
Geopolitical tensions have also woken up oil prices, with both spot WTI and December 2026 WTI oil futures posting solid gains as the risk premium jumped, pushing volatility to fresh highs. A contributing factor to these price increases has been the barrage of Ukrainian attacks on Russian oil installations, especially oil refineries, as the four-year-old conflict has entered a new phase of escalation lately.
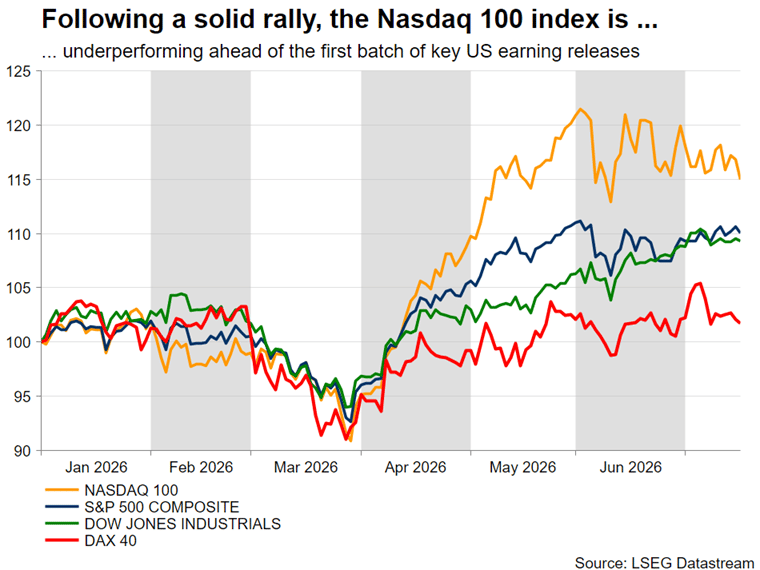
More importantly, despite the reduced chances of a September Fed rate hike, and the fact that the first earnings reports from US banking institutions and technology firms have been optimistic, beefed-up expectations for a stellar earnings season eventually led to a profit-taking correction. The Nasdaq 100 index bore the brunt, with European equities also failing to recover from last week's weak performance.
Looking ahead, despite the lack of pivotal US data releases, investors are expected to focus on three main events next week: earnings, the ECB meeting and the busy UK calendar, both data-wise and politically.
Strong earnings could help equities recover
The earnings season picks up speed next week, with dozens of companies announcing their Q2 results. However, technology stocks will be in the spotlight, as Alphabet and Tesla report on Wednesday, after US markets close, followed by Intel on Thursday.
Thursday's equities decline was another reminder of market nervousness and lingering concerns about the actual implementation of the substantial AI investments already announced and their true profitability. That said, a series of robust earnings results, along with further solid AI investment commitments, could prove the decisive factor for a revival of the Nasdaq 100 index, which has been underperforming so far in July. An initial climb to 29,731 would open the door to a retest of the upper boundary of the forming symmetrical triangle at 30,300, pulling other risk assets like bitcoin higher.
Crucially, persistent nervousness due to solid signs of a weaker outlook and/or a slower pace of AI investments would support the current bearish momentum. A drop below 28,180-28,400 could snowball, with Nasdaq 100 bears aiming for a decline towards the 100-day simple moving average (SMA) at 27,550.
Could the ECB pave the way for a September hike?
Following a difficult first half of the month, the euro managed to benefit from softer US inflation, advancing versus the dollar this week. This move, though, might prove short-lived if next Friday's preliminary PMI surveys remain soft and the ECB fails to deliver a hawkish surprise on Thursday.
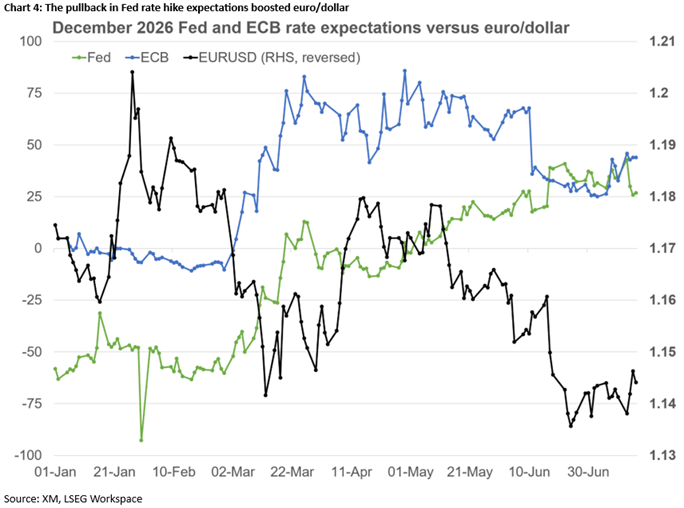
To be fair, chances of a hawkish surprise almost completely faded after the July 1 euro area inflation report, keeping the euro under bearish pressure, as markets priced out rate hikes during 2026. However, the restart of hostilities in the Middle East and the escalation in the Russia-Ukraine conflict, have reignited inflation concerns, supporting rate hike expectations. Markets are almost fully pricing in a 25bps rate hike in September, but assign only a 15% probability to such a move next week.
A hawkish press conference, with the usual post-meeting insider article solidifying September rate hike expectations, could help euro/dollar return inside the wide 1.1474-1.1830 range, with euro bulls targeting a rally towards 1.1530. However, a more likely scenario of a balanced meeting with few clues about September could reverse the current upward glide, especially if earnings boost demand for US stocks. A decline towards this week's trough at 1.1375 could act as a basis for a retest of the one-year low of 1.1324.
Will data and politics upset the recent Pound strength?
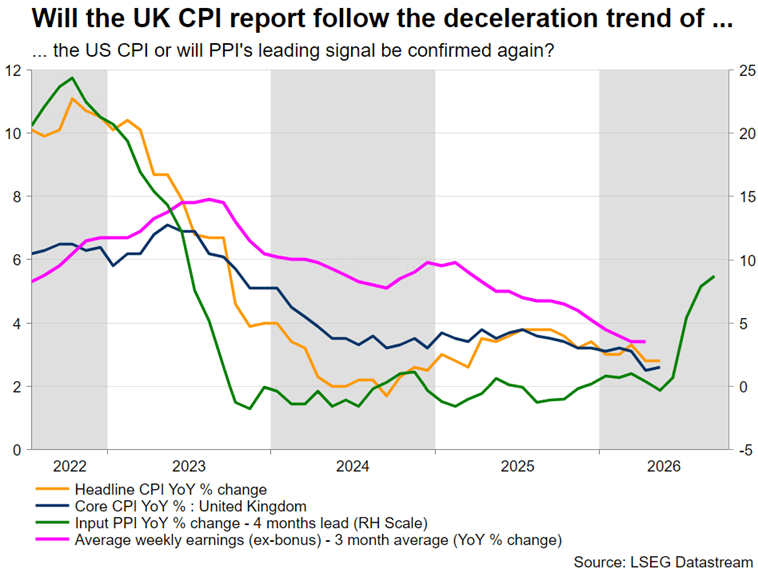
The fourth consecutive weekly pound gains against the euro could be challenged next week. The busy data calendar includes key releases such as Tuesday's claimant count and Friday's retail sales figures and the preliminary PMIs, although Wednesday's CPI report, which may surprise on the downside, could prove more market-moving.
Meanwhile, despite the positive market reaction so far, Andy Burnham's arrival at Downing Street remains a risk factor. Burnham is scheduled to take office on July 20, deliver his first speech and announce his first cabinet that day. Confirmation of reports that Shabana Mahmood will become the next Chancellor should keep bondholders happy, although there are many gaps to be filled about Burnham's mix of economic policy, particularly the funding sources of his public investment plans.
Pending a hawkish surprise from the ECB, the current bearish trend in euro/pound might have legs. Specifically, a softer UK CPI report, coupled with a healthy labour market and strong retail sales – partly due to the good performance of the English football team in the FIFA World Cup – could boost the pound's momentum, assuming that Burnham does not upset markets. In this case, pound bulls may be eager to test the busy 0.8400 area. On the flip side, a tax-heavy fiscal agenda would outweigh any upbeat data prints, putting the pound into a tailspin. A climb above 0.8538 could open the door to a more protracted rally in euro/pound.
Loonie and Aussie eye data, Dollar/Yen stabilizes while Gold craves bullish catalysts
Both the loonie and the Aussie took great advantage of Dollar vulnerability. Looking ahead, with the BoC failing to appear hawkish this week, a soft Canadian CPI report on Monday could put a temporary stop to the loonie's rally, while strong Australian jobs data, along with more information on the upcoming Chinese Politburo meeting, could extend the Aussie's advance. The next key support level for dollar/loonie stands at 1.3977, while a rising aussie/dollar could test the 0.7050 region. Alternatively, a break of 1.4100 and 0.6890 respectively could spell trouble for peripheral currencies as dollar bulls would regain the upper hand.
Meanwhile, dollar/yen continues to aimlessly hover above 162. Volatility has crashed to year-to-date lows, potentially reducing the urgency from Japanese authorities to intervene. A persistent dollar weakness might wake up the yen, with 161.20 potentially acting as the first support level.
Finally, gold's battle for $4,000 persists. A possible continuation of the Middle East hostilities would push gold towards the key support area at $3,886, a move that could snowball if equity weakness gains momentum. Only fresh tariff headlines, since the Section 301 investigations are scheduled to be completed before the Section 122 tariffs expire on July 24, could restore gold demand in the short-term.
Sunset Market Commentary
Markets
The second round of the US-Iran conflict entered its sixth consecutive day with strikes intensifying from both sides. Iran retaliated against water desalination and power generation plants in Kuwait and doesn't seem to let go of its renewed grip over Hormuz. The threat to drag Houthi rebels and Bab-al-Mandab into conflict remains in place as well. Brent crude currently changes hands above $86/b compared to this week's high of $87.45/b and an early July low around $70/b. The European reference contract for gas prices, Dutch TTF, rises from €55/Mwh to almost €58. At the height of the war back in March, it only traded for four days above €60/Mwh. The duration of the energy price shock is one of the key considerations for the ECB in deciding policy calibration. A benign June CPI print created some breathing space going into next week's policy meeting. Money markets only attach 6.5% probability to a back-to-back rate hike scenario. They are nevertheless prepared for a vigilant message including readiness to act again in September, when the ECB updates its scenario analysis. Such move is 90% discounted with a third (this cycle) priced in by March 2027.
The impact of the new phase in the war on other markets is modest today. Core bond yield curves flatten slightly with the front end slightly higher and the (very) long end grinding lower. The dollar takes a small advantage over its main trading partners but is going nowhere at EUR/USD 1.1425. If any, this week's trading implies that the USD-downside is protected with relatively small losses following CPI and PPI numbers. European stock markets join the downbeat mood from the US yesterday and Asia this morning with the EuroStoxx50 currently 1.25% lower. From a technical point of view, the index is testing the neckline of a head-and-shoulders formation at 6200. The final target (in case of a break) stands at 5970. US stock markets open 1% to 1.75% lower with the Nasdaq (25413) underperforming. Key support stands at 25k (neckline closing triangle formation).
News & Views
Japanese Prime Minister Sanae Takaichi joined the recent debate in which members of the government elaborated on the Government Pension Investment Fund (GPIF) potentially allocating a bigger share of its reserves into domestic assets, including Japanese government bonds. The discussion occurs against a background where both Japanese government bonds and the yen are facing ongoing selling pressure of late. Even as GPIF has its own rules and procedures to set its asset allocation, also PM Takaichi repeated arguments that earlier were brought forward by Fin Min Katayama. In this respect, she advocated that with Japan moving to a growth-oriented economy, it could be beneficial to invest more in Japanese assets. "With stock markets also performing steadily, we should pursue measures that encourage households and pension funds, including GPIF, to make further investments in Japanese financial assets so that the public can enjoy the benefits of Japan's economic growth," the Japanese PM said.
Reuters reported that the government will maintain the formulation that decisions on specific monetary policy tools should be left to the Bank of Japan. Within the government, there is debate on the degree of policy cooperation that is necessary between the BoJ and the government to be put against the principle of central bank independence. According to Reuters, the blueprint in this respect states that "to achieve a strong economy, it is very important for monetary policy to be conducted appropriately to see stable price rises". Before Parliament, Fin Min Katayama said that there is "no change to the government's stance that specific monetary policy means fall under the jurisdiction of the BoJ". The comments at least suggest that the government turns more cautious on any action to interfere with central bank policy. Japanese government bonds and the yen were under pressure early in the trading session this morning, but both closed off the intraday lows. The yield on the 30-y JGB in the end added 2.9 bps, but the 10-y JGB yield eased 2 bps. USD/JPY briefly dropped to the 162.15 area, but at currently 162.35, the yen still trades within reach of the multi-year lows (162.84 area).
US Consumer Sentiment Jumps to Five-Month High as Gas Price Relief Lifts Confidence
US Consumer sentiment improved again in July, with the University of Michigan's preliminary index rising from 49.5 to 54.4, its highest level since February. The gain was driven largely by easing gasoline prices in recent weeks, helping lift all five components of the survey. Buying conditions for durable goods and expectations for business conditions over the coming year each surged by around 20%, while sentiment improved broadly across age, income, wealth and political affiliations. Even so, overall confidence remained well below year-ago levels, underscoring that many households continue to feel the strain of elevated prices.
The survey suggests that softer energy costs provided a meaningful boost to consumer optimism, but that improvement may prove fragile. Interviews were conducted between June 23 and July 13, with more than 70% completed before the resumption of US strikes against Iran on July 7 and the subsequent rebound in gasoline prices. As a result, the latest reading may not fully capture the impact of renewed geopolitical tensions on household expectations, particularly if higher energy prices begin feeding back into broader inflation concerns.
Inflation expectations nevertheless moderated in July. Consumers' one-year inflation outlook eased from 4.6% to 4.2%, though it remained well above the 3.4% reading recorded in February before the Iran conflict began and above levels seen throughout 2024. Longer-term inflation expectations were unchanged at 3.3%, remaining slightly above the 2.8% to 3.2% range prevailing last year. The combination of improving confidence and still-elevated inflation expectations suggests households are becoming less pessimistic about near-term economic conditions, but have yet to regain confidence that inflation will return sustainably to the Fed's target.
Economic Data
| Indicator | Actual | Expected | Previous |
|---|---|---|---|
| Michigan Consumer Sentiment (Jul P) | 54.4 | 51.0 | 49.5 |
| Current Economic Conditions | 54.9 | — | 47.7 |
| Consumer Expectations | 54.0 | — | 50.7 |
| 1-Year Inflation Expectations | 4.2% | — | 4.6% |
| Long-Run Inflation Expectations | 3.3% | — | 3.3% |
Key Takeaways
- Consumer sentiment rose to its highest level since February.
- All five survey components improved, led by roughly 20% gains in buying conditions for durable goods and year-ahead business conditions.
- Confidence improved across age, income, wealth and political affiliations, with particularly strong gains among consumers without a bachelor's degree.
- Despite the rebound, sentiment remained 11.8% below July 2025 levels, indicating consumers are still cautious.
- One-year inflation expectations eased from 4.6% to 4.2%, though they remain well above pre-Iran conflict and 2024 levels.
- Long-run inflation expectations were unchanged at 3.3%, staying above the 2.8%-3.2% range seen through most of 2024.
- The survey may understate the impact of renewed Middle East tensions, as more than 70% of interviews were completed before US strikes on Iran resumed on July 7.
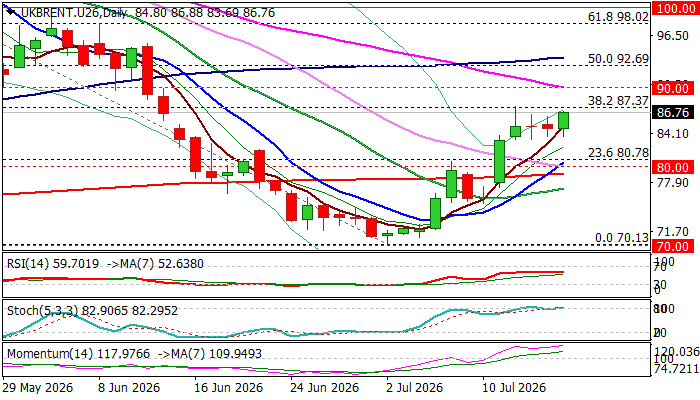
Brent Oil Price Rises After a Brief Consolidation
Oil prices regained traction and rose on Friday, advancing over 1.5% during European session, after being in a quiet mode in past two days.
Double tight Doji candles on Wed/Thu signaled that traders were on hold after the latest rally and awaiting fresh signals.
Escalation of the conflict between the US and Iran has again drastically reduced flows through Hormuz strait and raised fears of deeper crisis, particularly after Iran warned of closing the access to the Red Sea, in case the US attacks Iran’s power sites that would have a domino effect on global supply chains.
Although the oil price jumped on Friday, it still holds within the perimeter of near-term congestion, with key barrier at $87.37 (Fibo 38.2% retracement of $115.26/$70.13, where the recent advance was capped) being in focus.
Firm break here to signal bullish continuation (recovery leg from $70.13) and expose targets at $90 (psychological, reinforced by 55DMA), $92.69 (50% retracement) and $93.71 (100DMA).
Strong positive momentum on daily chart and multiple MA null-crosses (10/20; 10/200; 10/30DMA) support scenario.
Recent range floor ($83.32) offers solid support which should continue to protect the downside and keep bulls intact.
Res: 87.37; 88.00; 90.00; 91.28
Sup: 83.32; 82.39; 80.00; 79.00