Sample Category Title
Markets Turn Defensive Ahead of Weekend as US-Iran Conflict Nears New Escalation
Markets headed into the final US session of the week with a distinctly defensive tone as investors weighed two converging risks: a deepening global semiconductor selloff and growing concern that the US-Iran conflict could enter a far more dangerous phase over the weekend. While US equity futures pointed sharply lower after heavy losses in Asian technology stocks, broader cross-asset moves suggested investors were becoming reluctant to carry risk into the weekend amid heightened geopolitical uncertainty.
The semiconductor rout continued to pressure sentiment after spreading from South Korea to Japan and Taiwan, while NASDAQ futures points to notably lower open. Yet the technology selloff appeared to be only part of the story. Markets were also focused on developments in the Middle East, where the conflict broadened beyond military installations to include infrastructure targets. The latest US strikes reportedly hit bridges, a train station and an airport in southern Iran, while US Central Command referred to attacks on "military logistics infrastructure" for the first time in more than a week, signaling a widening scope of operations.
Iran responded by announcing strikes against US bases in Kuwait, Qatar and Bahrain, as well as a US radar station in Oman. Tehran also said it had targeted what it described as a US special forces base at Tanf in Syria, marking another geographical expansion of the conflict. Together with reports that power and desalination facilities in Kuwait had been hit, the latest exchanges suggested both sides were becoming more willing to target infrastructure with broader economic and logistical significance rather than focusing solely on military assets.
Even so, traditional defensive assets were moving only gradually. Dollar recovered broadly, oil edged mildly higher and remained on track for its strongest weekly gain since April, while Gold continued to decline. The restrained nature of these moves suggests investors have not yet priced in a worst-case scenario. Instead, many appear to be reducing exposure ahead of the weekend, aware that any significant geopolitical development could trigger a sharp repricing when markets reopen. In that sense, markets resemble a loaded gun—cocked, but still waiting for a trigger.
Currency markets reflected this cautious positioning. Canadian Dollar outperformed on support from firmer oil prices, while Australian Dollar and New Zealand Dollar came under renewed pressure as investors reduced exposure to risk-sensitive currencies. Sterling also lagged, while Euro, Swiss Franc and Yen traded more neutrally, highlighting that markets were not yet engaged in a full-scale flight to safety.
Whether that changes may depend less on Friday's price action than on headlines emerging after markets close. With the conflict expanding both geographically and operationally, traders appear increasingly unwilling to head into the weekend with aggressive risk positions.
Chip Rout Spreads from KOSPI to Nikkei. Will NASDAQ Be Next?
KOSPI broke first, Nikkei followed, and NASDAQ could be next. The geographical spread of the chip rout suggests markets are reassessing the AI investment cycle rather than simply taking profits after a strong rally. Read More.
Ethereum Leads Bitcoin Again. Is Crypto Finally Turning the Corner?
Ethereum has emerged as crypto's clear leader following softer US inflation data, outperforming Bitcoin by a wide margin over the past week and lifting the ETH/BTC ratio nearly 9% from its June low. While similar leadership has preceded previous crypto recoveries, the latest rally still lacks confirmation that a new bull market has begun. Read More.
Eurozone June CPI Confirms Inflation Cooled to 2.8%, Services and Core Price Pressures Moderate
Eurozone inflation slowed to 2.8% in June from 3.2% in May, confirming the flash estimate as underlying price pressures continued to ease. Core inflation and services inflation both moderated, reinforcing signs that domestic inflation is gradually cooling even as energy prices remain elevated. Read More.
AUD/USD Daily Report
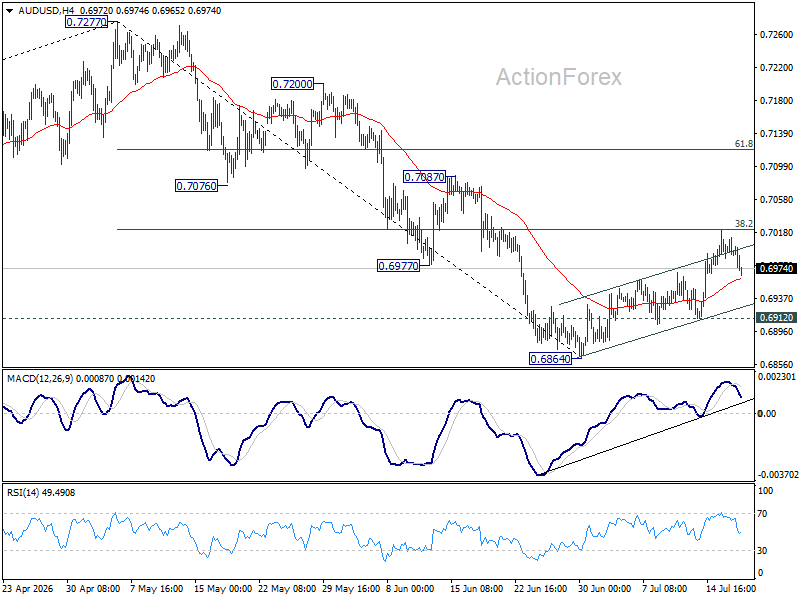
Intraday bias in AUD/USD is turned neutral with current retreat. On the upside, firm break of 38.2% retracement of 0.7277 to 0.6864 at 0.7022 will target 61.8% retracement at 0.7119 next. On the downside, however, below 0.6912 minor support will turn bias back to the downside for 0.6864 low.
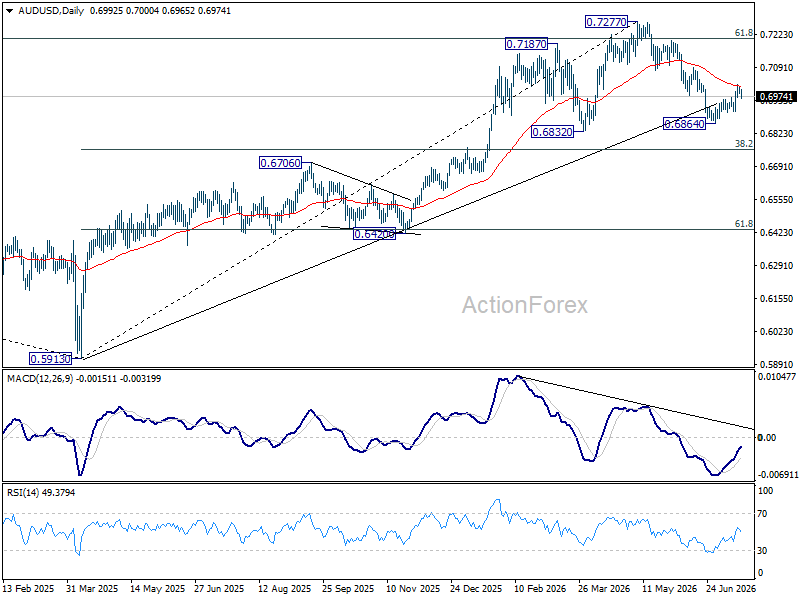
In the bigger picture, considering bearish divergence condition in D MACD, a medium term top could be formed at 0.7277 after failing to sustain above 61.8% retracement of 0.8006 (2021 high) to 0.5913 (2024 low) at 0.7206. Deeper fall could be seen to 38.2% retracement of 0.5913 to 0.7277 at 0.6756 as a correction. But strong support should be seen there to bring rebound. Consolidations would continue below 0.7277 for a while.
EUR/USD Daily Outlook
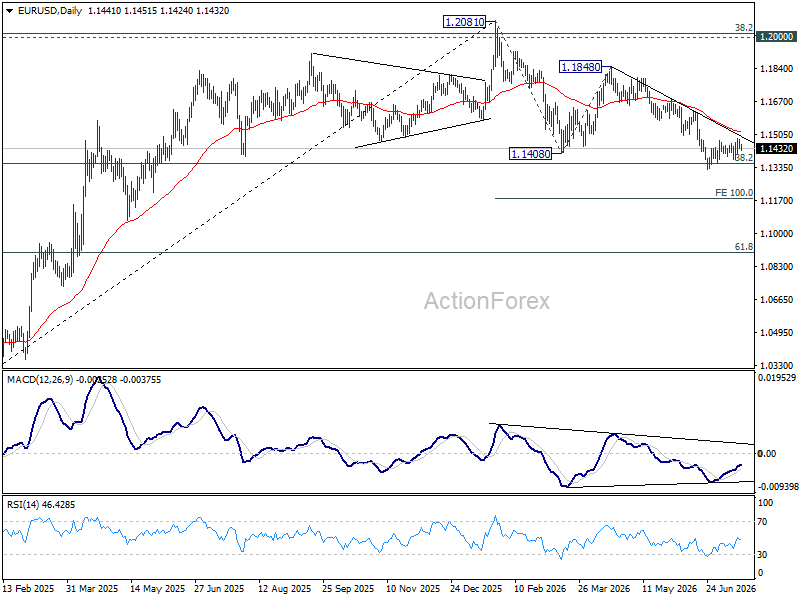
No change in EUR/USD's outlook. Consolidations from 1.1323 is extending and intraday bias remains neutral. With 1.1499 support turned resistance intact, further decline is expected. On the downside, break of 1.1323 will resume the fall from 1.2081 to 100% projection of 1.2081 to 1.1408 from 1.1848 at 1.1175. However, decisive break of 1.1499 will turn bias back to the upside for 1.1621 resistance.
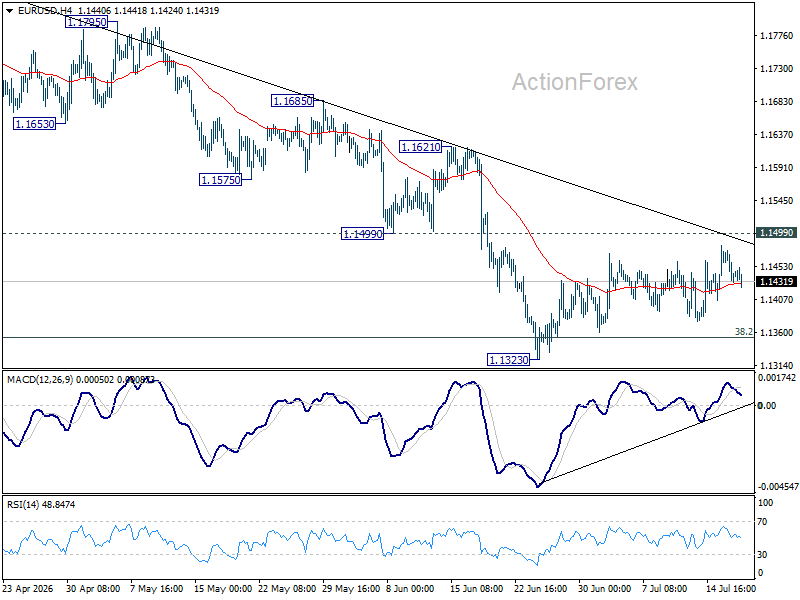
In the bigger picture, focus is back on 38.2% retracement of 1.0176 to 1.2081 at 1.1353. Decisive break there will revive the case of medium term bearish trend reversal after rejection by 1.2 key cluster resistance level. Further fall should be seen to 61.8% retracement at 1.0904. Nevertheless, strong rebound from 1.1353, followed by break of 1.1621 resistance, will retain medium term bullishness.
USD/JPY Daily Outlook
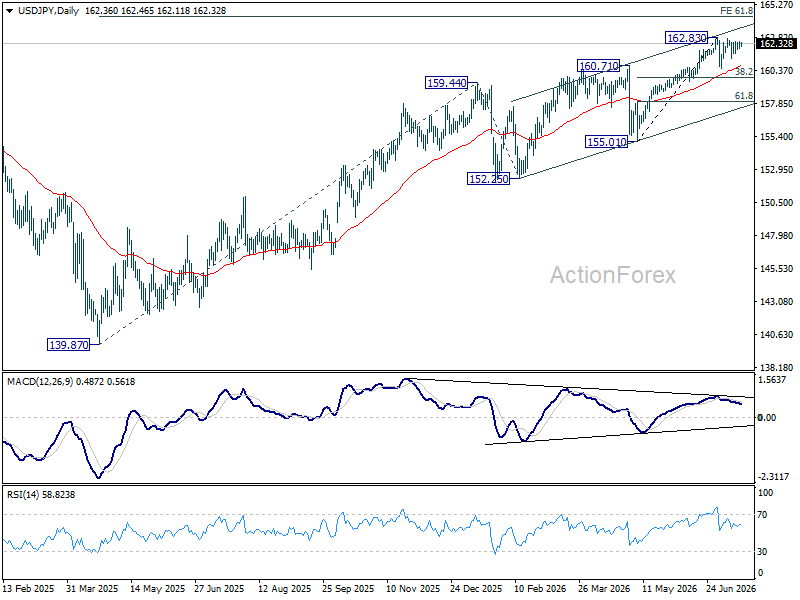
Intraday bias in USD/JPY remains neutral as consolidation continues below 162.83. In case of another fall, downside should be contained by 38.2% retracement of 155.01 to 162.83 at 159.84. On the upside, firm break of 162.83 will resume larger up trend to 164.34 projection level.
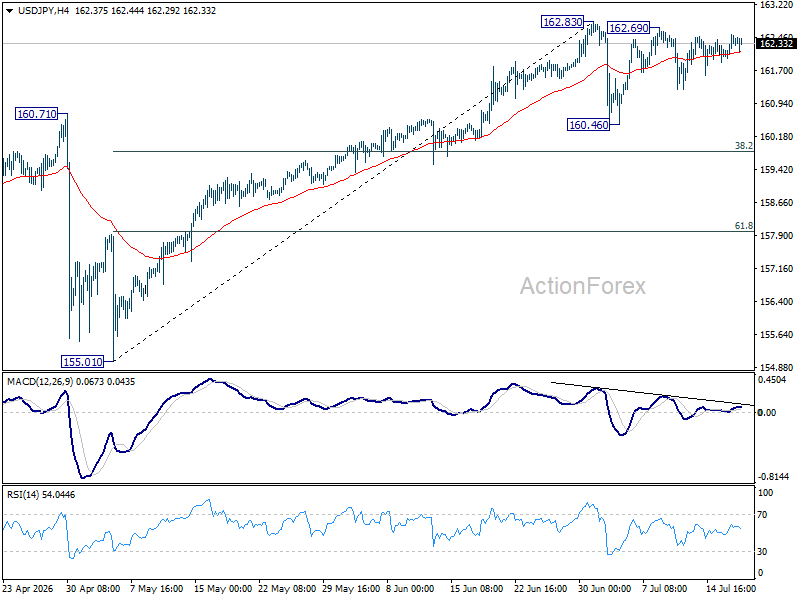
In the bigger picture, rise from 139.87 (2025 low) is seen as another rising leg of the long term up trend. Next target is 61.8% projection of 139.87 to 159.44 from 152.25 at 164.34. For now, outlook will remain bullish as long as 155.01 support holds, even in case of deep pullback.
GBP/USD Daily Outlook
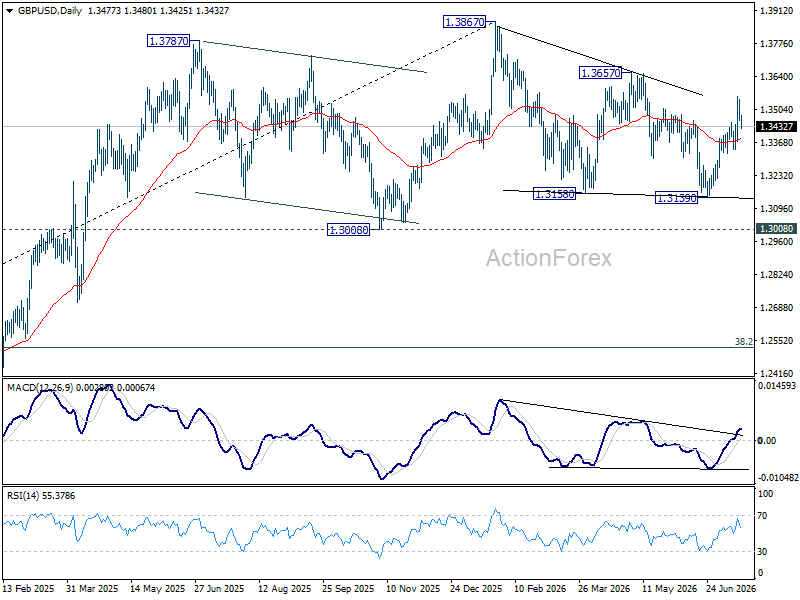
Intraday bias in GBP/USD is turned neutral with current retreat and some consolidations would be seen below 1.3557. Further rally is expected as long as 1.3339 support holds. Above 1.3557 will target 1.3657 resistance. Firm break there should confirm that whole corrective pattern from 1.3867 has completed at 1.3139 already.
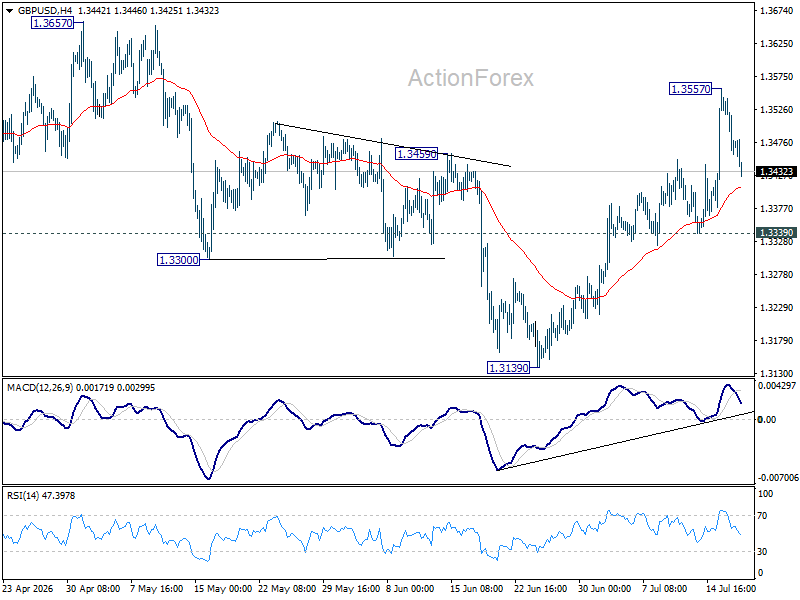
In the bigger picture, price actions from 1.3867 are a corrective pattern within the broader up trend from 1.0351 (2022 low). With 1.3008 support intact, medium term bullishness is maintained and break of 1.3867 is in favor for a later stage, towards 1.4248 key resistance (2021 high). However, firm break of 1.3008 will at least bring deeper fall to 38.2% retracement of 1.0351 to 1.3867 at 1.2524, with increased risk of bearish reversal.
USD/CHF Daily Outlook
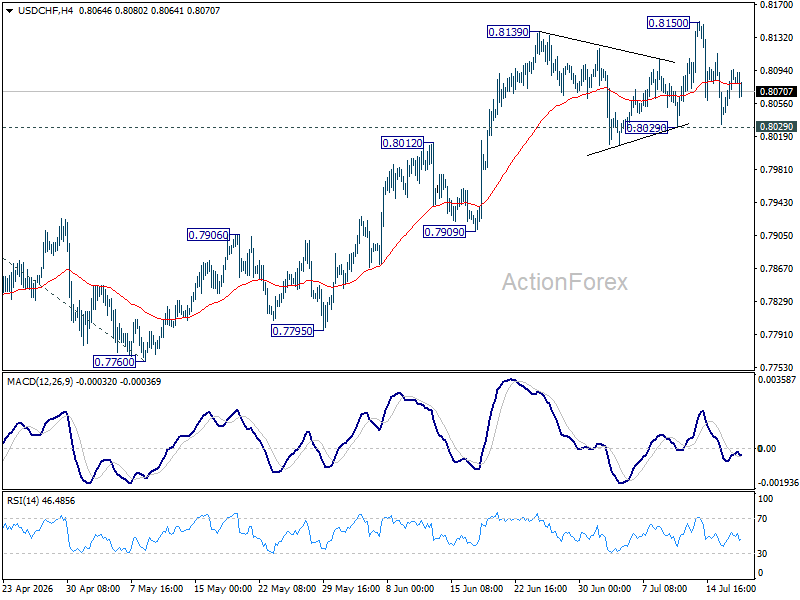
Range trading continues in USD/CHF and intraday bias remains neutral. On the upside, break of 0.8150 will resume the rally from 0.7660 and target 100% projection 0.7603 to 0.8041 from 0.7600 at 0.8198. However, firm break of 0.8029 support will confirm short term topping, and turn bias back to the downside for 55 DEMA (now at 0.7985) and below.
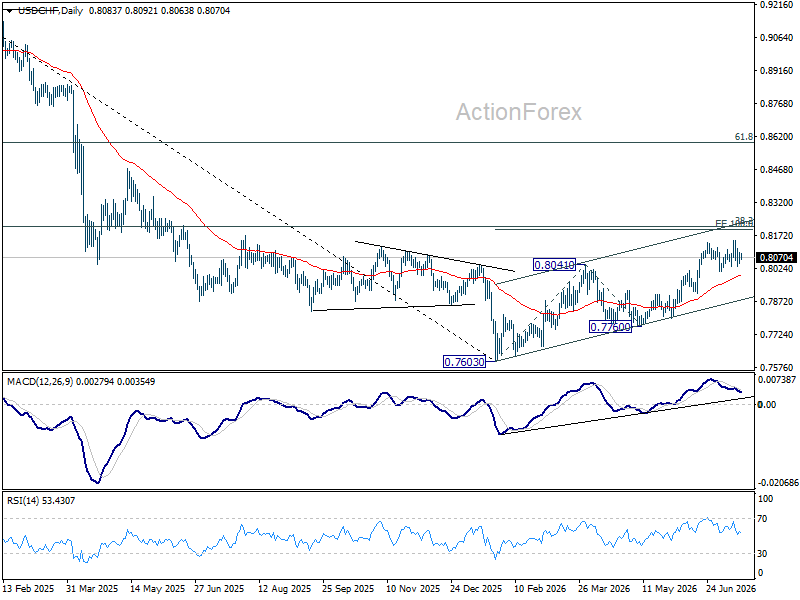
In the bigger picture, while a medium term bottom was formed at 0.7603, it's still early to call for bullish trend reversal. As long as 38.2% retracement of 0.9200 (2025 high) to 0.7603 at 0.8213 holds, the larger down trend could still continue through 0.7603 at a later stage. However, firm break of 0.7603 will argue that the trend has reversed and turn focus to 0.8332 support turned resistance (2023 low) for confirmation.
AUD/USD Daily Report
Intraday bias in AUD/USD is turned neutral with current retreat. On the upside, firm break of 38.2% retracement of 0.7277 to 0.6864 at 0.7022 will target 61.8% retracement at 0.7119 next. On the downside, however, below 0.6912 minor support will turn bias back to the downside for 0.6864 low.
In the bigger picture, considering bearish divergence condition in D MACD, a medium term top could be formed at 0.7277 after failing to sustain above 61.8% retracement of 0.8006 (2021 high) to 0.5913 (2024 low) at 0.7206. Deeper fall could be seen to 38.2% retracement of 0.5913 to 0.7277 at 0.6756 as a correction. But strong support should be seen there to bring rebound. Consolidations would continue below 0.7277 for a while.
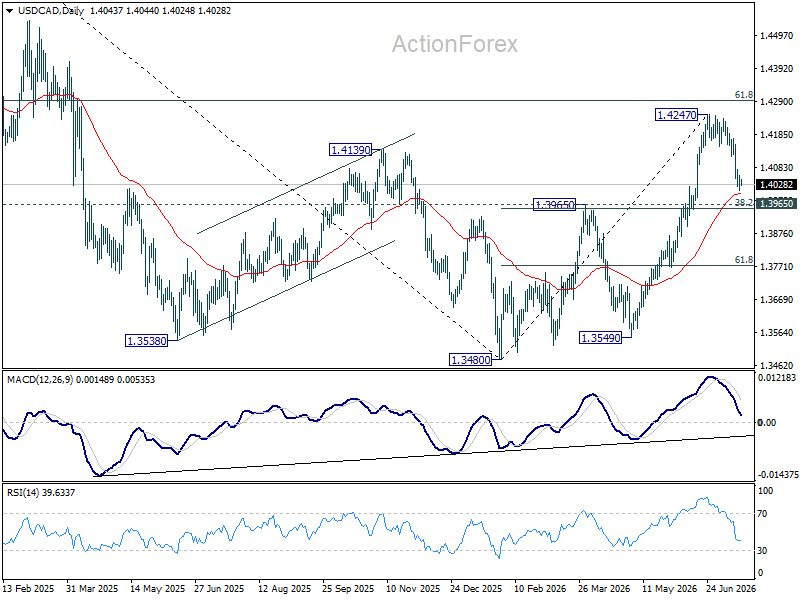
USD/CAD Daily Outlook
Intraday bias in USD/CAD remains neutral first. While correction from 1.4247 might extend lower, downside should be contained by 1.3965 cluster support (38.2% retracement of 1.3480 to 1.4247 at 1.3954 to bring rebound. On the upside, above 1.4159 minor resistance will bring retest of 1.4247 high. Firm break there will target 61.8% retracement of 1.4791 to 1.3480 at 1.4290.
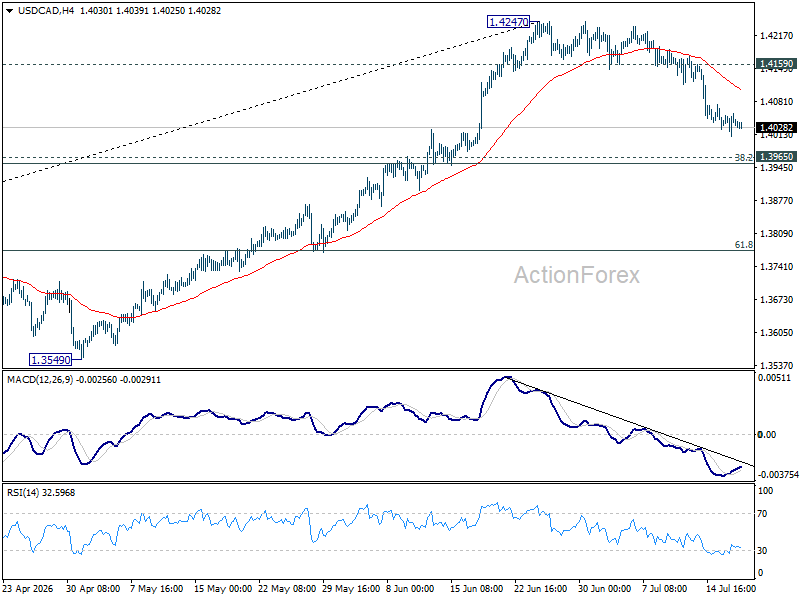
In the bigger picture, current development suggests that fall from 1.4791 has completed as a three wave correction to 1.3480. It's still early to judge if rise from there a corrective bounce, or resumption of the larger up trend from 1.2005 (2021 low). But in either case, retest of 1.4791 high should be seen next.
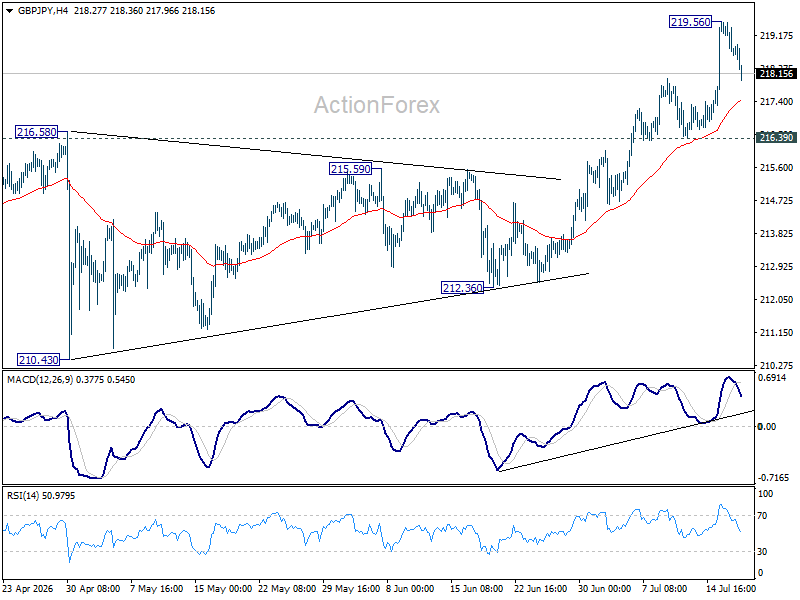
GBP/JPY Daily Outlook
Intraday bias in GBP/JPY is turned neutral with with current retreat, and some consolidations would be seen below 219.56. Downside should be contained by 216.39 support to bring another rally. On the upside, break of 219.56 will extend larger up trend to 220.90 fibonacci projection level next.
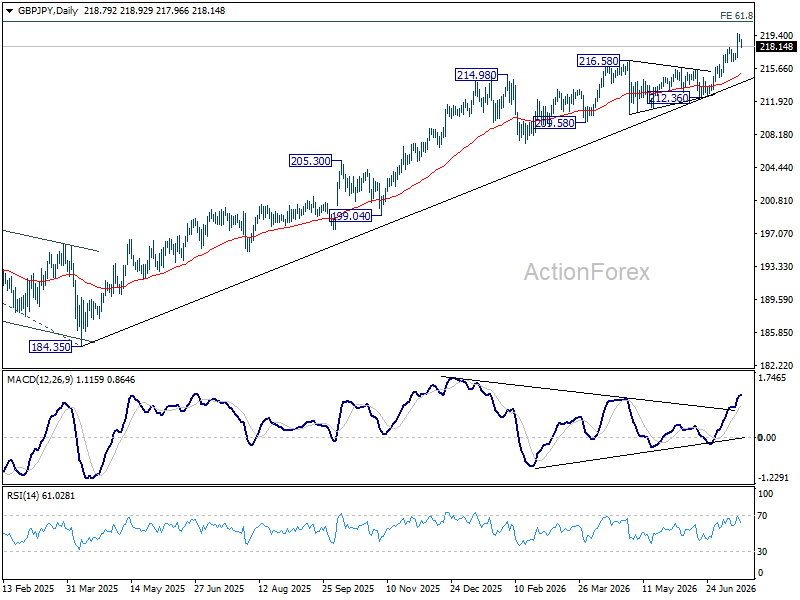
In the bigger picture, the long term up trend is in progress. Next target is 61.8% projection of 148.93 (2022 low) to 208.09 (2024 high) from 184.35 at 220.90. For now, outlook will remain bullish as long as 55 W EMA (now at 208.22) holds, in case of pullback.
EUR/JPY Daily Outlook
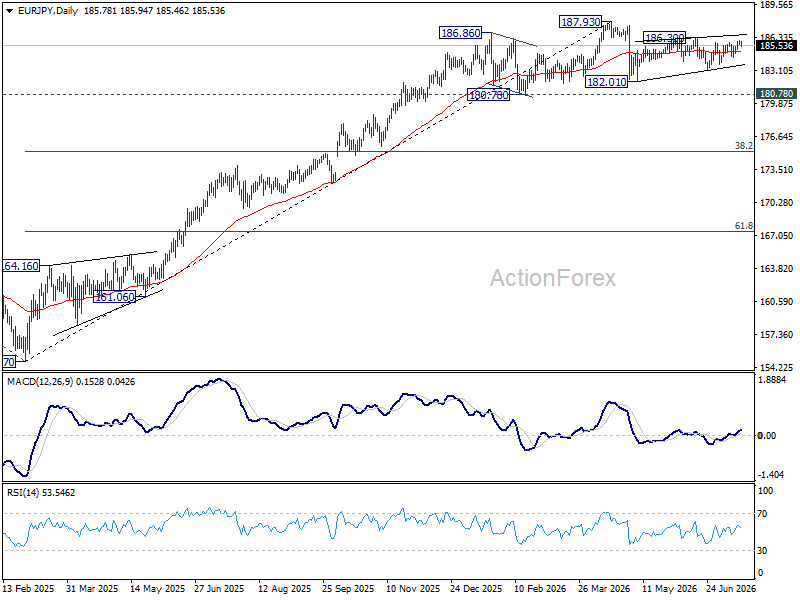
EUR/JPY is still bounded in sideway trading and intraday bias stays neutral. While the price actions from 182.10 are looking corrective, stronger rebound cannot be ruled out. On the upside, firm break of 186.30 will resume the rebound from 182.10 towards 187.93 high. On the downside, break of 183.14 will bring deeper fall to retest 182.10.
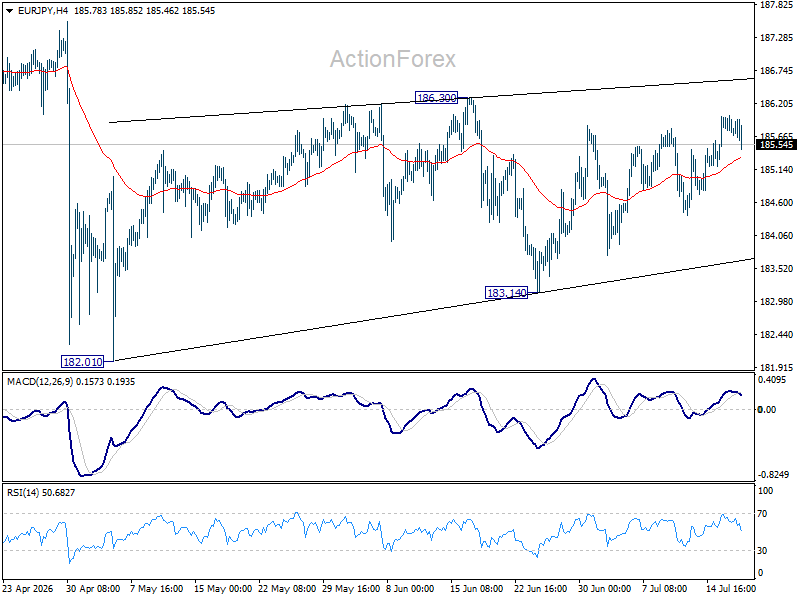
In the bigger picture, there is no sign of reversal yet. Uptrend from 114.42 (2020 low) is still expected to resume at a later stage to 78.6% projection of 124.37 (2022 low) to 175.41 (2025 high) from 154.77 at 194.88. However, sustained break of 55 W EMA (now at 179.93) will argue that it's already in a medium term down trend to 175.41 resistance turned support and below.
EUR/GBP Daily Outlook
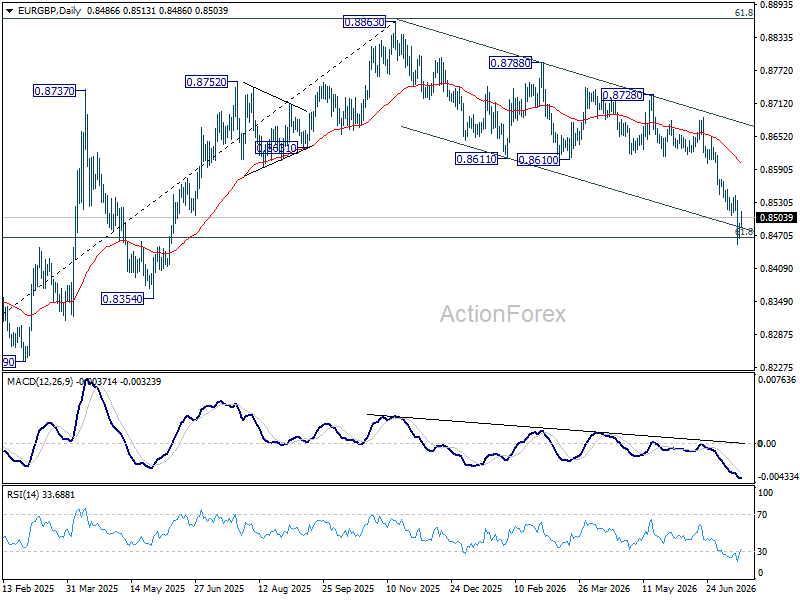
Intraday bias in EUR/GBP is turned neutral first with current recovery. Some consolidations would be seen above 0.8453. But outlook will stay bearish as long as 0.8615 support turned resistance holds. Sustained break of 61.8% retracement of 0.8221 to 0.8863 at 0.8466 will pave the way to 0.8221 support.
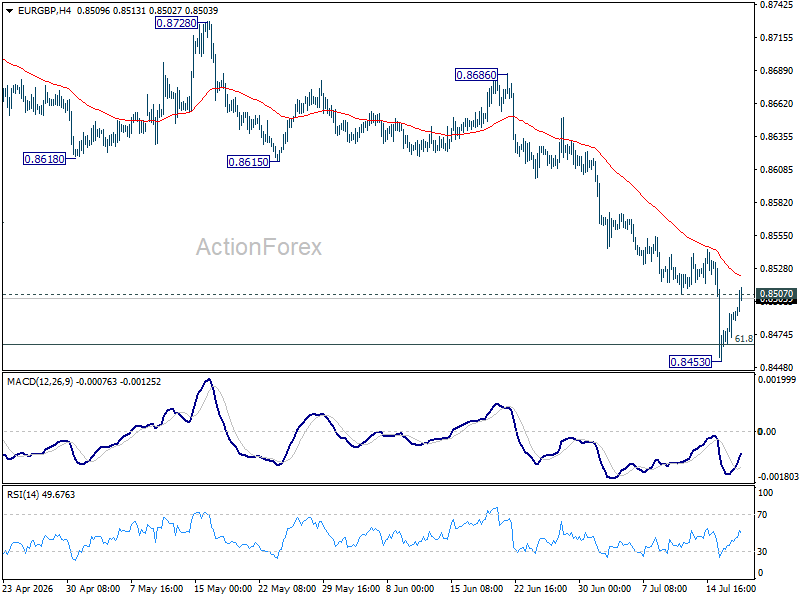
In the bigger picture, current development suggests that rise from 0.8221 (2024 low) has completed at 0.8863, just ahead of 38.2% retracement of 0.8221 (2024 low) to 0.8863 (2025 high) at 0.8618. Deeper fall would be seen back to 0.8201 (2022 low). For now, outlook will be neutral at best as long as 0.8863 hold.