Sample Category Title
Pound Rises on Trump Healthcare Setback
GBP/USD has posted gains in the Monday, as the pair has hit 7-week highs. In the North American session, GBP/USD is trading at 1.2570. On the release front, it's a quiet start to the week. There are no UK events on the schedule. In the US, we'll hear from two FOMC members – Charles Evans and Robert Kaplan. There are no US indicators until Tuesday, with the release of CB Consumer Confidence.
Donald Trump's stunning ascendancy to the presidency last November triggered an impressive rally by the US dollar. However, market euphoria over Trump's election win is long past. The inquiry into the Trump administration's links with Russia continues to make headlines, and is another cause for concern for nervous investors. Trump has been in office for over two months, but he has yet to provide any details over even an outline of economic policy. Last week, Trump's proposed bill to change Obamacare was not even voted on, as the White House could not garner enough support to pass the bill. This latest setback for the beleaguered Trump administration has boosted GBP/USD in the Monday session.
In the UK, last week's consumer indicators pointed to stronger spending and inflation. Retail Sales sparkled in February with a gain of 1.4%, its highest gain since October 2016. At the same time, for the three months to February, retail sales suffered their biggest slide since 2010. This points to an erosion in consumer spending due to the weak pound, which has fallen 16 percent since the Brexit vote last June. The weak currency and higher oil prices have also sent inflation higher. CPI climbed 2.3% in February, beating the forecast of 2.1%. This is a significant reading, as it surpassed the BoE's inflation target of 2.0% for the first time in three years. Higher inflation levels have increased speculation that the Bank of England, which has had a neutral stance on rate policy, could raise rates this year. BoE deputy governor Ben Broadbent acknowledged that a rate hike was a possibility in 2017, and the BoE will be under further pressure to make a move if inflation continues to head upwards.
Trade Idea Wrap-up: USD/CHF – Sell at 0.9910
USD/CHF - 0.9833
Most recent candlesticks pattern : N/A
Trend : Near term down
Tenkan-Sen level : 0.9837
Kijun-Sen level : 0.9864
Ichimoku cloud top : 0.9932
Ichimoku cloud bottom : 0.9921
Original strategy :
Sell at 0.9910, Target: 0.9800, Stop: 0.9945
Position : -
Target : -
Stop : -
New strategy :
Sell at 0.9900, Target: 0.9800, Stop: 0.9935
Position : -
Target : -
Stop : -
The greenback only recovered to 0.9960 on Friday before meeting renewed selling interest and the subsequent selloff below previous support at 0.9861 adds credence to our bearish view that recent decline is still in progress and may extend weakness to 0.9810-15 (50% projection of 1.01710.9882 measuring from 0.9960), then 0.9795-00, however, loss of downward momentum should prevent sharp fall below 0.9770-75 (100% projection of 1.0171-0.9942 measuring from 1.0003), bring rebound later.
In view of this, would not chase this fall here and we are looking to sell dollar on subsequent rebound as 0.9900-10 should limit upside. Only above said resistance at 0.9960 would abort and signal low is formed, bring retracement of recent decline towards indicated previous resistance at 1.0003.

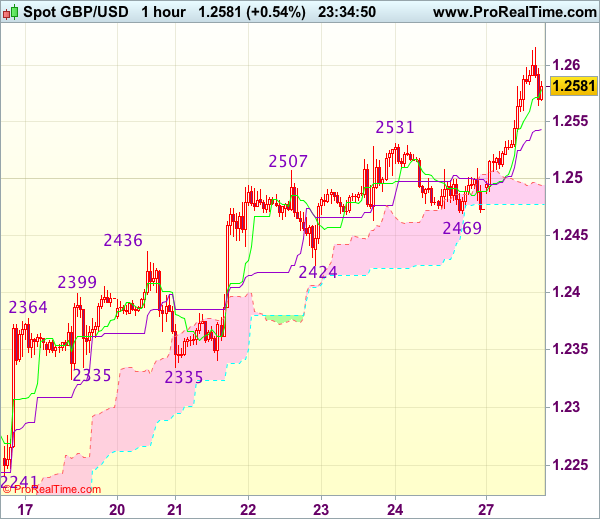
Trade Idea Wrap-up: GBP/USD – Buy at 1.2490
GBP/USD - 1.2587
Most recent candlesticks pattern : N/A
Trend : Near term up
Tenkan-Sen level : 1.2579
Kijun-Sen level : 1.2543
Ichimoku cloud top : 1.2494
Ichimoku cloud bottom : 1.2478
Original strategy :
Buy at 1.2490, Target: 1.2600, Stop: 1.2455
Position : -
Target : -
Stop : -
New strategy :
Buy at 1.2490, Target: 1.2600, Stop: 1.2455
Position : -
Target : -
Stop : -
As cable has eased after rising to 1.2616 in NY morning, adding credence to our bullish view that recent upmove from 1.2109 is still in progress and upside bias remains for this move to extend further gain to 1.2635-40, however, loss of upward momentum should prevent sharp move beyond 1.2670-80 and price should falter below previous resistance at 1.2706, risk from there is seen for a retreat later.
In view of this, would not chase this rise here and would be prudent to buy cable on subsequent retreat. Only below support at 1.2469 (Friday’s low) would abort and signal top is formed, bring retracement of recent upmove towards previous support at 1.2424 which is likely to hold from here.
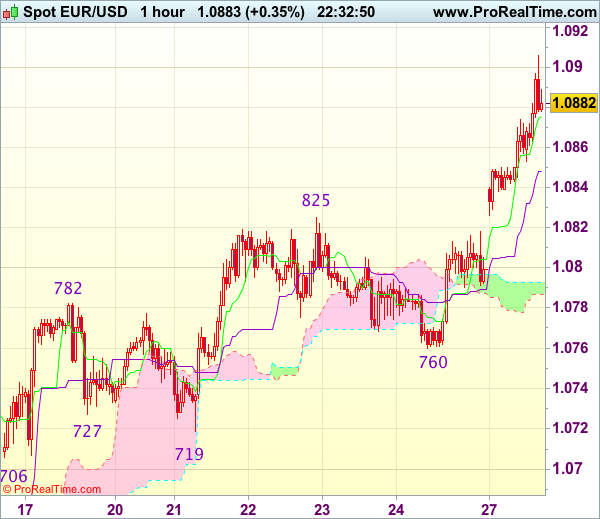
Trade Idea Wrap-up: EUR/USD – Buy at 1.0800
EUR/USD - 1.0886
Most recent candlesticks pattern : N/A
Trend : Near term up
Tenkan-Sen level : 1.0880
Kijun-Sen level : 1.0849
Ichimoku cloud top : 1.0793
Ichimoku cloud bottom : 1.0787
Original strategy :
Buy at 1.0800, Target: 1.0900, Stop: 1.0765
Position : -
Target : -
Stop : -
New strategy :
Buy at 1.0800, Target: 1.0900, Stop: 1.0765
Position : -
Target : -
Stop : -
The single currency also opened higher today on dollar’s broad-based weakness and the the subsequent rally signals recent upmove is still in progress, hence bullishness remains for further gain to 1.0900 and possibly 1.0930-35 (61.8% Fibonacci retracement of 1.1300-1.0340), however, loss of near term upward momentum should prevent sharp move beyond 1.0955-60 and price should falter below 1.0990-00, risk from there has increased for a retreat to take place later.
In view of this, would not chase this rise here and we are looking to buy euro on subsequent pullback as 1.0800-10 should limit downside. Only below support at 1.0760 would abort and signal top is formed, bring retracement of recent upmove to 1.0730 but 1.0719 support should remain intact.
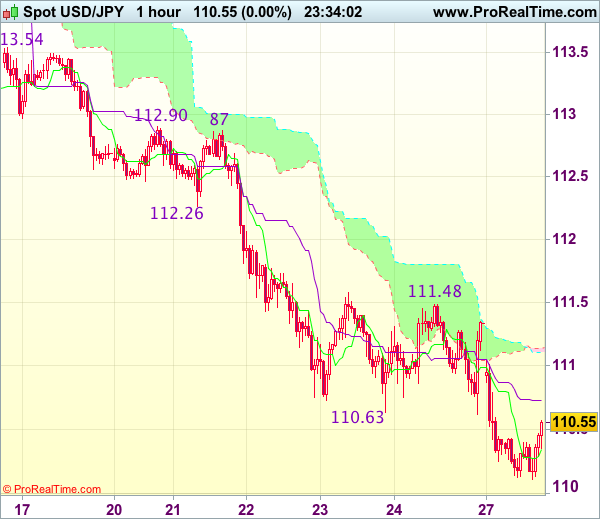
Trade Idea Wrap-up: USD/JPY – Sell at 111.10
USD/JPY - 110.54
Most recent candlesticks pattern : N/A
Trend : Down
Tenkan-Sen level : 110.34
Kijun-Sen level : 110.73
Ichimoku cloud top : 111.13
Ichimoku cloud bottom : 111.11
Original strategy :
Sell at 111.00, Target: 110.00, Stop: 111.35
Position : -
Target : -
Stop : -
New strategy :
Sell at 111.00, Target: 110.00, Stop: 111.35
Position : -
Target : -
Stop : -
The greenback opened lower earlier today and has dropped again, adding credence to our bearish view that recent selloff is still in progress and may extend weakness to 110.00, however, loss of downward momentum should prevent sharp fall below 109.70-75 and reckon 109.50 would hold from here, risk from there has increased for a rebound to take place later.
In view of this, would not chase this fall here and would be prudent to sell dollar on recovery as 111.00 should limit upside. Above 111.30-35 would risk test of resistance at 111.48 but break there is needed to signal low is formed instead, bring retracement of recent decline to 111.75-80 first.
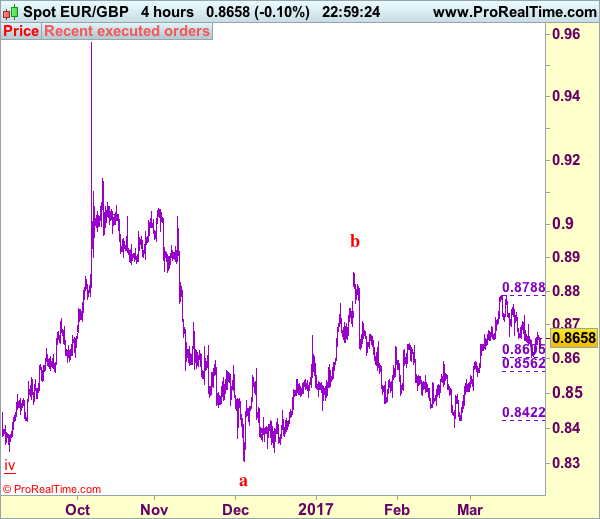
Trade Idea: EUR/GBP – Hold long entered at 0.8620
EUR/GBP - 0.8652
Recent wave: Major double three (A)-(B)-(C)-(X)-(A)-(B)-(C) is unfolding and 2nd (A) has possibly ended at 0.6936.
Trend: Near term down
Original strategy :
Bought at 0.8620, Target: 0.8750, Stop: 0.8580
Position : - Long at 0.8620
Target : - 0.8750
Stop : - 0.8580
New strategy :
Hold long entered at 0.8620, Target: 0.8720, Stop: 0.8600
Position : - Long at 0.8620
Target : - 0.8720
Stop : - 0.8600
Although the single currency retreated after meeting resistance at 0.8676, as long as support at 0.8605 (last week’s low) holds, mild upside bias remains for another rebound, a break of said resistance at 0.8700 would bring test of 0.8727, above there would suggest low is formed, then gain to 0.8760 would follow, break there would suggest the pullback from 0.8788 has ended, bring retest of this level, a breach there would extend the rise from 0.8403 low to 0.8800 and later 0.8825-30.
In view of this, we are holding on to our long position entered at 0.8620. A firm break below 0.8605 (50% Fibonacci retracement of 0.8422-0.8788) would defer and suggest top has possibly been formed at 0.8788, risk test of 0.8560-65 (61.8% Fibonacci retracement) but support at 0.8547 should remain intact.
Our preferred count is that, after forming a major top at 0.9805 (wave V), (A)-(B)-(C) correction is unfolding with (A) leg ended at 0.8400 (A: 0.8637, B: 0.9491 and 5-waver C ended at 0.8400. Wave (B) has ended at 0.9413 and impulsive wave (C) has either ended at 0.8067 or may extend one more fall to 0.8000 before prospect of another rally. Current breach of indicated resistance at 0.9043 confirms our view that the (C) leg has ended and bring stronger rebound towards 0.9150/54, then towards 0.9240/50.
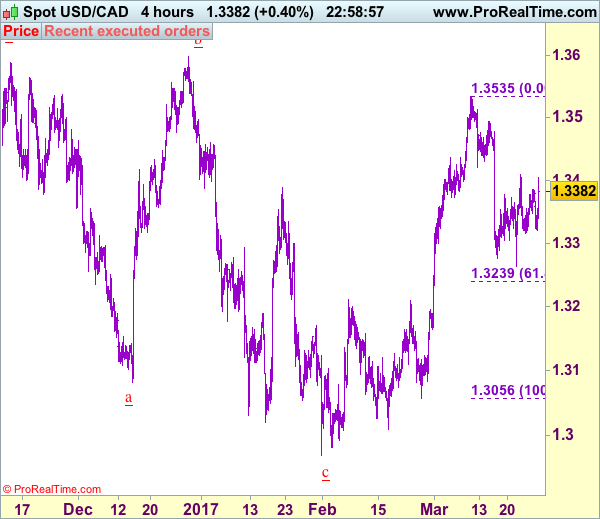
Trade Idea: USD/CAD – Exit short entered at 1.3400
USD/CAD - 1.3368
Recent wave: Only wave v of c has ended at 0.9407 and wave C of major A-B-C correction is underway for headway to 1.4700
Trend: Near term up
Original strategy :
Sold at 1.3400, Target: 1.3240, Stop: 1.3410
Position: - Short at 1.3400
Target: - 1.3240
Stop: - 1.3410
New strategy :
Exit short entered at 1.3400,
Position: - Short at 1.3400
Target: -
Stop:-
The greenback held above support at 1.3326 and has rebounded, suggesting further consolidation would be seen and test of 1.3409 resistance cannot be ruled out, however, break there is needed to signal low has been formed at 1.3264 last week, bring a stronger rebound to 1.3450 and possibly test of resistance at 1.3479 but only break of 1.3495 resistance would indicate the pullback from 1.3535 has ended and bring retest of this level later.
In view of this, would be prudent to exit short entered at 1.3400 and stand aside for now. Below 1.3326 would revive bearishness, bring retest of said last week’s low at 1.3264, break there would add credence to our view that top has been made at 1.3535 earlier this month, bring further fall to 1.3235-40 (61.8% Fibonacci retracement of 1.3056-1.3535) but previous resistance at 1.3210 would hold due to loss of downward momentum.
To recap, wave B from 1.3066 is unfolding as an a-b-c and is sub-divided as a: 1.2192, b: 1.2716 and wave c is a 5-waver with i: 1.1983, ii: 1.2506, extended wave iii with minor iii at 1.0206, wave iv ended at 1.0781 and wave v as well as wave iii has ended at 0.9931, hence the subsequent choppy trading is the wave iv which is unfolding as (a)-(b)-(c) with (a) leg of iv ended at 1.0854, followed by (b) leg at 1.0108 and (c) leg as well as the wave iv ended at 1.0674. The wave v is sub-divided by minor wave (i): 0.9980, (ii): 1.0374, (iii): 0.9446, (iv): 0.9913 and (v) as well as v has possibly ended at 0.9407, therefore, consolidation with upside bias is seen for major correction, indicated target at 1.3700 and 1.4000 had been met and further gain to 1.4700 would be seen later.
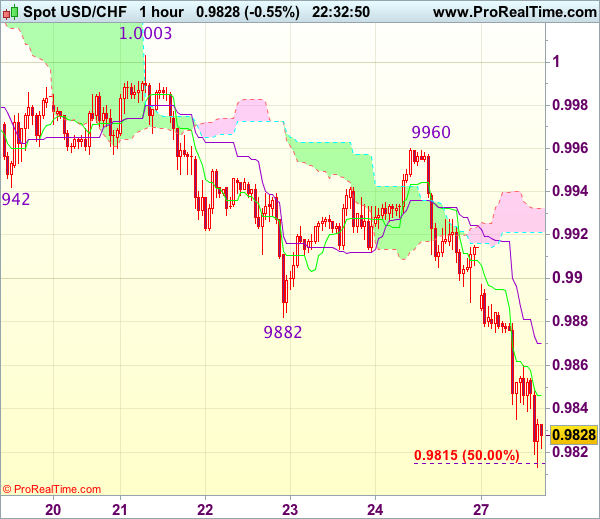
Trade Idea Update: USD/CHF – Sell at 0.9910
USD/CHF - 0.9836
Original strategy :
Sell at 0.9910, Target: 0.9800, Stop: 0.9945
Position : -
Target : -
Stop : -
New strategy :
Sell at 0.9910, Target: 0.9800, Stop: 0.9945
Position : -
Target : -
Stop : -
The greenback only recovered to 0.9960 on Friday before meeting renewed selling interest and the subsequent selloff below previous support at 0.9861 adds credence to our bearish view that recent decline is still in progress and may extend weakness to 0.9810-15 (50% projection of 1.01710.9882 measuring from 0.9960), then 0.9795-00, however, loss of downward momentum should prevent sharp fall below 0.9770-75 (100% projection of 1.0171-0.9942 measuring from 1.0003), bring rebound later.
In view of this, would not chase this fall here and we are looking to sell dollar on subsequent rebound as 0.9900-10 should limit upside. Only above said resistance at 0.9960 would abort and signal low is formed, bring retracement of recent decline towards indicated previous resistance at 1.0003.
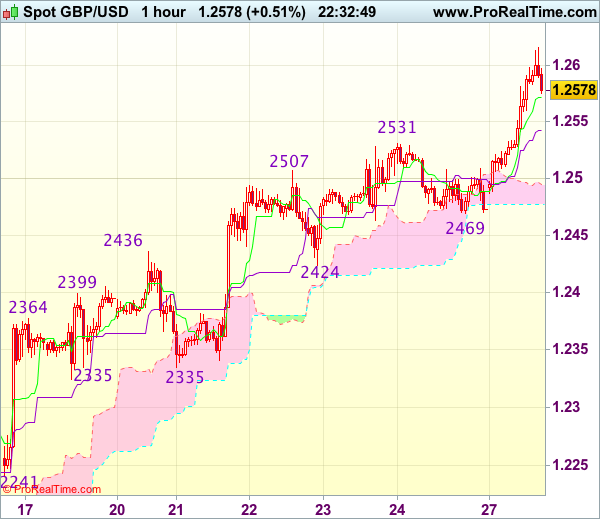
Trade Idea Update: GBP/USD – Buy at 1.2490
GBP/USD - 1.2576
Original strategy :
Buy at 1.2490, Target: 1.2600, Stop: 1.2455
Position : -
Target : -
Stop : -
New strategy :
Buy at 1.2490, Target: 1.2600, Stop: 1.2455
Position : -
Target : -
Stop : -
As cable has surged again today, adding credence to our bullish view that recent upmove from 1.2109 is still in progress and upside bias remains for this move to extend further gain to 1.2600, then towards 1.2635-40, however, loss of upward momentum should prevent sharp move beyond 1.2670-80 and price should falter below previous resistance at 1.2706, risk from there is seen for a retreat later.
In view of this, would not chase this rise here and would be prudent to buy cable on subsequent retreat. Only below support at 1.2469 (Friday’s low) would abort and signal top is formed, bring retracement of recent upmove towards previous support at 1.2424 which is likely to hold from here.
Trade Idea Update: EUR/USD – Buy at 1.0800
EUR/USD - 1.0880
Original strategy :
Buy at 1.0800, Target: 1.0900, Stop: 1.0765
Position : -
Target : -
Stop : -
New strategy :
Buy at 1.0800, Target: 1.0900, Stop: 1.0765
Position : -
Target : -
Stop : -
The single currency also opened higher today on dollar’s broad-based weakness and the the subsequent rally signals recent upmove is still in progress, hence bullishness remains for further gain to 1.0900 and possibly 1.0930-35 (61.8% Fibonacci retracement of 1.1300-1.0340), however, loss of near term upward momentum should prevent sharp move beyond 1.0955-60 and price should falter below 1.0990-00, risk from there has increased for a retreat to take place later.
In view of this, would not chase this rise here and we are looking to buy euro on subsequent pullback as 1.0800-10 should limit downside. Only below support at 1.0760 would abort and signal top is formed, bring retracement of recent upmove to 1.0730 but 1.0719 support should remain intact.