
Sample Category Title
EUR/AUD Daily Outlook
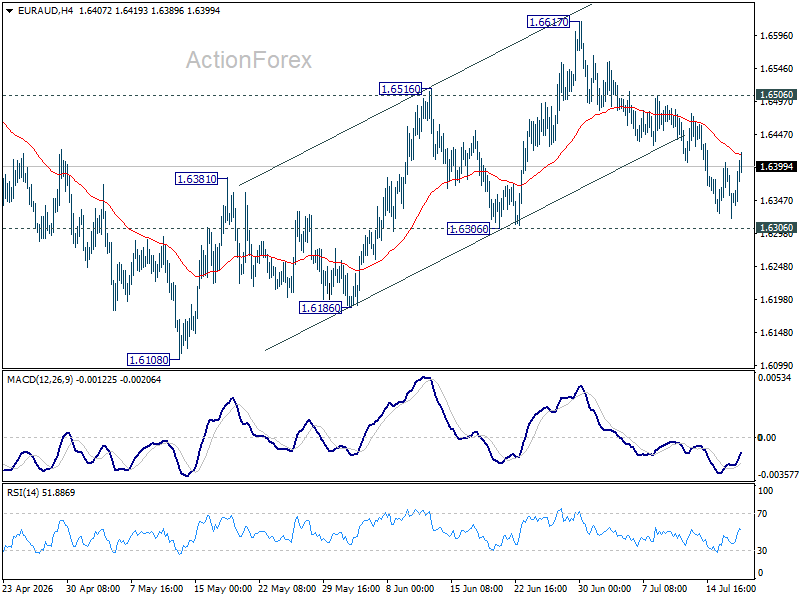
Intraday bias in EUR/AUD remains neutral first. On the downside, firm break of 1.6307 support that rebound from 1.6108 has completed at 1.6617. Deeper decline should the be seen to retest this low. On the upside, break of 1.6506 will turn bias back to the upside for 1.6617.
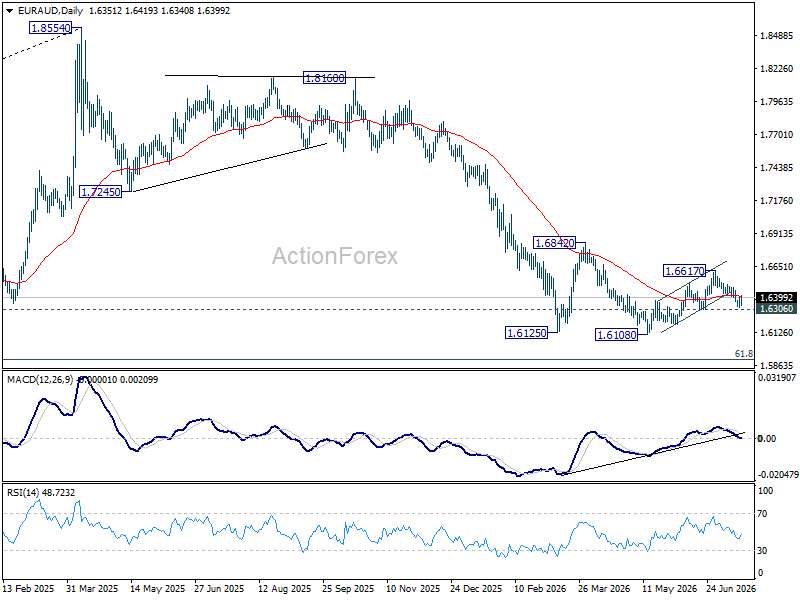
In the bigger picture, outlook will stay bearish as long as 1.6842 resistance holds. Fall from 1.8554 (2025 high) is expected to continue to 61.8% retracement of 1.4281 to 1.8554 at 1.5913. Decisive break there will pave the way back to 1.4281 (2022 low). However, firm break of 1.6842 should confirm medium term bottoming, and bring stronger rally.
EUR/CHF Daily Outlook
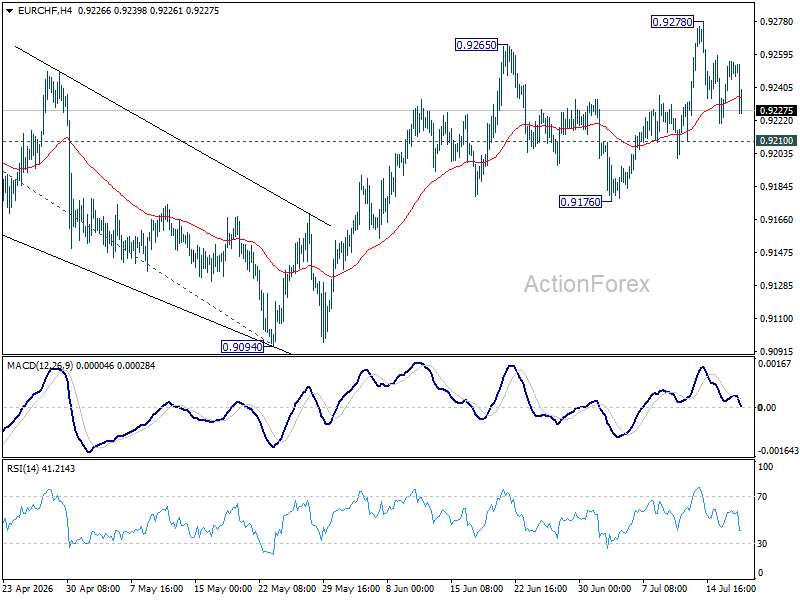
EUR/CHF is staying in consolidations below 0.9278 and intraday bias remains neutral. Downside should be contained by 0.9210 support to bring another rise. Above 0.9278 will resume whole rally from 0.8979 to 100% projection of 0.8979 to 0.9264 from 0.9094 at 0.9379. However, break of 0.9210 will bring deeper fall back to 0.9176 support instead.
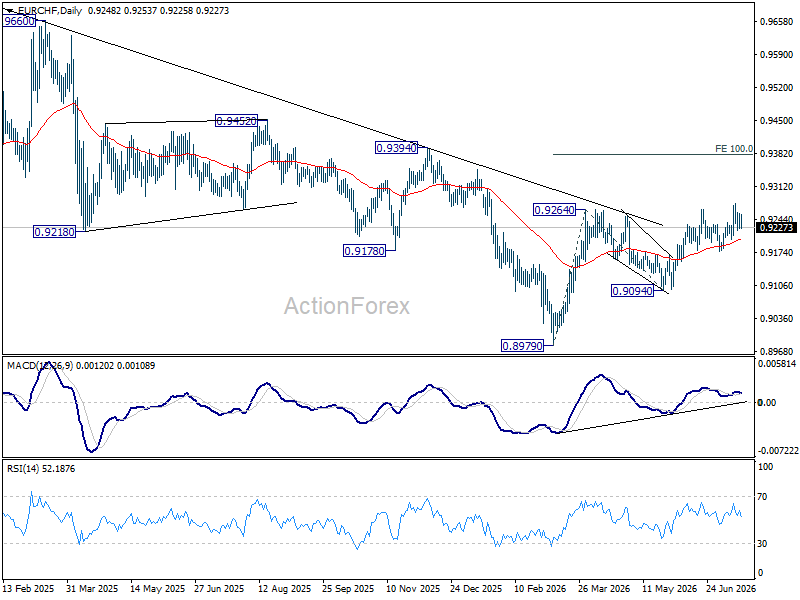
In the bigger picture, the break of medium term falling trend line resistance indicates that 0.8979 is already a medium term bottom. Considering bullish convergence condition in W MACD, rise from there should at least be reversing the fall from 0.9928, with prospect of developing into a medium term up trend. Firm break of 0.9394 resistance will add more credence to this case. For now risk will remain on the upside as long as 0.9094 support holds, in case of retreat.
AUD/CAD: Months of Indecision — Is a Breakout Finally Coming?
The Australian dollar has clawed back most of its end-of-June losses, when it touched three-month lows against the greenback amid escalating Middle East tensions. Since then, sentiment has improved: the RBA's Assistant Governor Sarah Hunter signalled the board stands ready to tighten further if the recent oil shock feeds into inflation expectations. Still, resilient business surveys and a modest improvement in consumer confidence point to an economy holding up better than feared.
The Bank of Canada told a similarly nuanced story this week. Policymakers held the overnight rate steady at 2.25% and struck a cautiously optimistic tone on the domestic economy, upgrading medium-term growth expectations. At the same time, officials were careful to flag that instability in the Middle East continues to weigh heavily on the broader outlook, keeping the door open to both risks and opportunities depending on how the conflict evolves.
The result: two central banks watching the same geopolitical flashpoint, each balancing early signs of domestic resilience against a risk backdrop neither can fully control.
AUD/CAD Technical Analysis
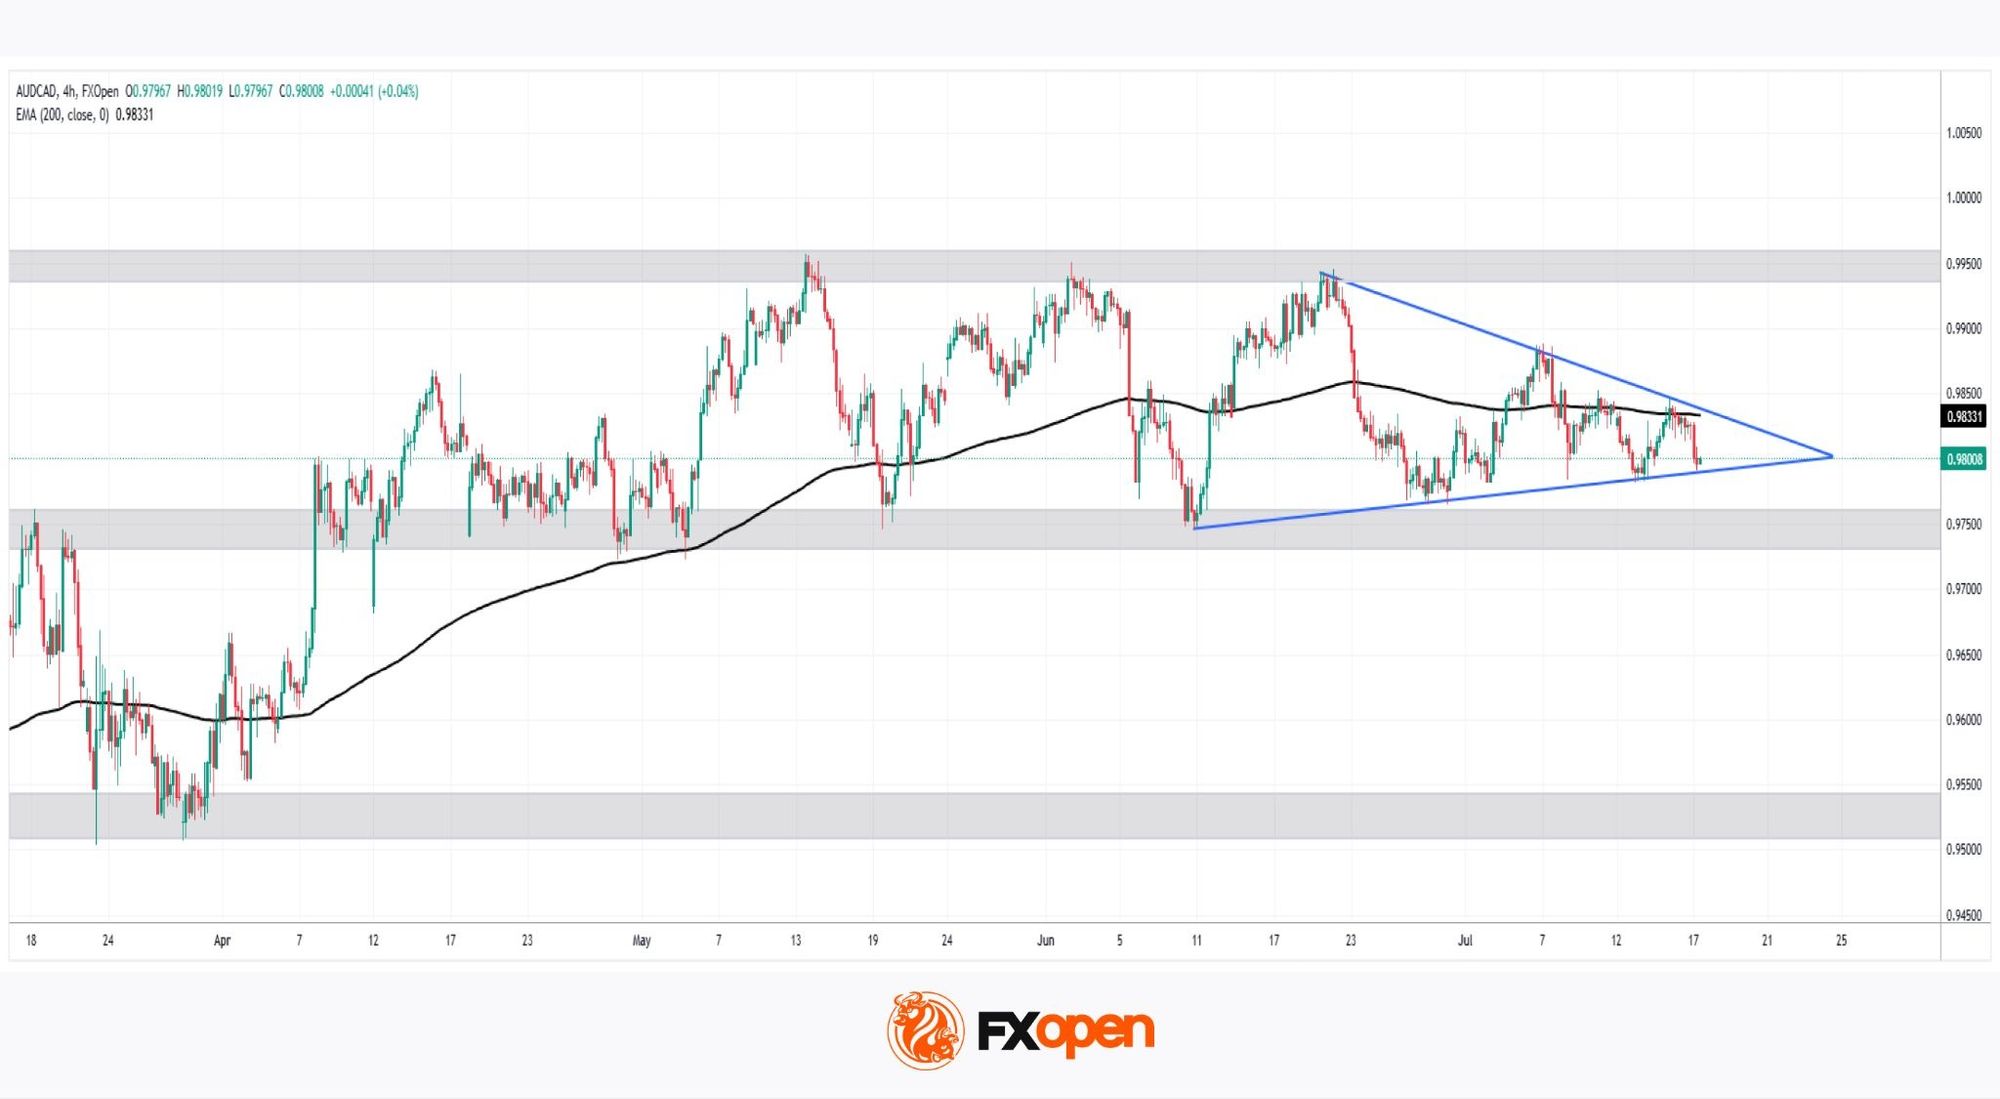
As the 4-hour chart shows, AUD/CAD has been trading within a broader range between the 0.9750 support and 0.9950 resistance since April, with price action compressing into a tighter symmetrical triangle since June. This narrowing structure suggests a breakout could soon define the pair's direction over the medium term.
Bullish Scenario
Price continues finding support along the ascending trendline, having bounced off it multiple times and testing it once again. A renewed sign of strength here—breaking both the 200-period EMA and the descending trendline—would open the path back towards the 0.9950 resistance, the acid test for whether this level finally gives way or rejects price once more.
Bearish Scenario
Should the ascending trendline finally break, price would quickly face the critical 0.9750 support, a level traders have been watching closely for months. A bounce here keeps the pair locked within its consolidation range, but a decisive break after so many failed attempts would likely signal a medium-term trend shift, opening the door toward the next area of interest between 0.9500 and 0.9550.
Will AUD/CAD finally commit to a direction after months of indecision?
Trade over 50 forex markets 24 hours a day with FXOpen. Take advantage of low commissions, deep liquidity, and spreads from 0.0 pips (additional fees may apply). Open your FXOpen account now or learn more about trading forex with FXOpen.
This article represents the opinion of the Companies operating under the FXOpen brand only. It is not to be construed as an offer, solicitation, or recommendation with respect to products and services provided by the Companies operating under the FXOpen brand, nor is it to be considered financial advice.
Gold Probes Again Through Key $4000 Support
Gold trades below $4000 level on Friday following Thursday’s break and daily close below this level (the first close well below the mark since 6 November 2025), after the price moved around 4K for almost one month, but all attacks failed to register a clear break lower.
Fresh violation of very significant 4K support may signal an end of extended directionless phase and continuation of larger downtrend from new record high, if break is sustained.
The metal came under fresh pressure as the latest escalation in the Middle East fuels inflationary risk (also partially offsets optimism from better than expected US June inflation numbers) that underpins the US dollar.
Loss of $4K support zone (including recent spike low at $3942) would expose immediate support at $3886 (28 Oct 2025), followed by $3666 (weekly Ichimoku cloud base) and $3606 (50% retracement of $1613/$5598 uptrend).
Gold is on track for the second consecutive weekly loss, with bearish daily studies contributing to negative scenario.
Conversely, failure to hold gains below $4000 would weaken developing bearish signal and keep the price in prolonged directionless mode, but biased lower as long as recent range top ($4203) stays intact.
Res: 4067; 4134; 4162; 4203
Sup: 3970; 3942; 3886; 3717
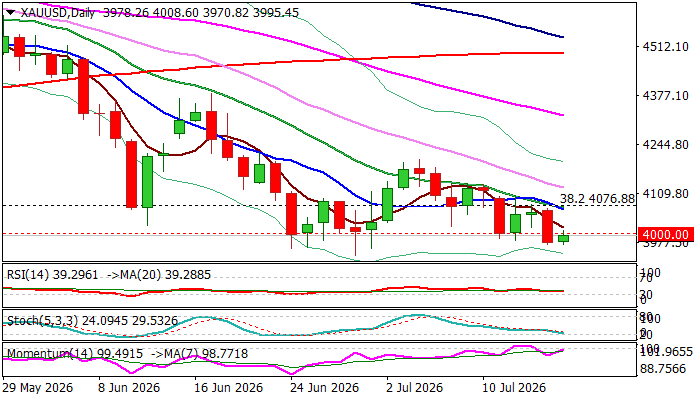
Chart Alert: NASDAQ 100 at Risk of Triggering a Multi-Week Corrective Decline Leg
Key takeaways
- The Nasdaq 100 has become the weakest major US equity benchmark this week, underperforming the S&P 500, Dow Jones Industrial Average, and Russell 2000 as investors rotate away from richly valued AI and semiconductor leaders despite robust Q2 bank earnings.
- AI infrastructure stocks are entering a valuation reset, as leveraged unwinding in major memory-chip names, concerns over excessive capital expenditure, and delayed AI monetisation shift investor focus from growth narratives toward sustainable cash flow and earnings quality.
- Rising volatility in semiconductor stocks is flashing a broader market warning, with the PHLX Semiconductor ETF breaking below its 50-day moving average while realised volatility expands, increasing the risk of a negative feedback loop into the Nasdaq 100.
- Technically, the Nasdaq 100 is approaching a critical inflexion point, with the 28,200 neckline support of a potential medium-term double-top pattern becoming the key downside trigger. A decisive break could signal the start of a multi-week corrective decline.
The Nasdaq 100 has been the weakest among the major US benchmark stock indices since the start of this week.
The tech-heavy index has declined 2.7% week-to-date as of Thursday, 16 July 2026, versus the S&P 500 (-0.6%), Dow Jones Industrial Average (-0.2%), and the small-cap Russell 2000 (-0.1%), amid the stellar Q2 earnings results of major US Wall Street banks such as Goldman Sachs and JPMorgan Chase that smashed expectations.
AI capex fatigue and multiple compression threats
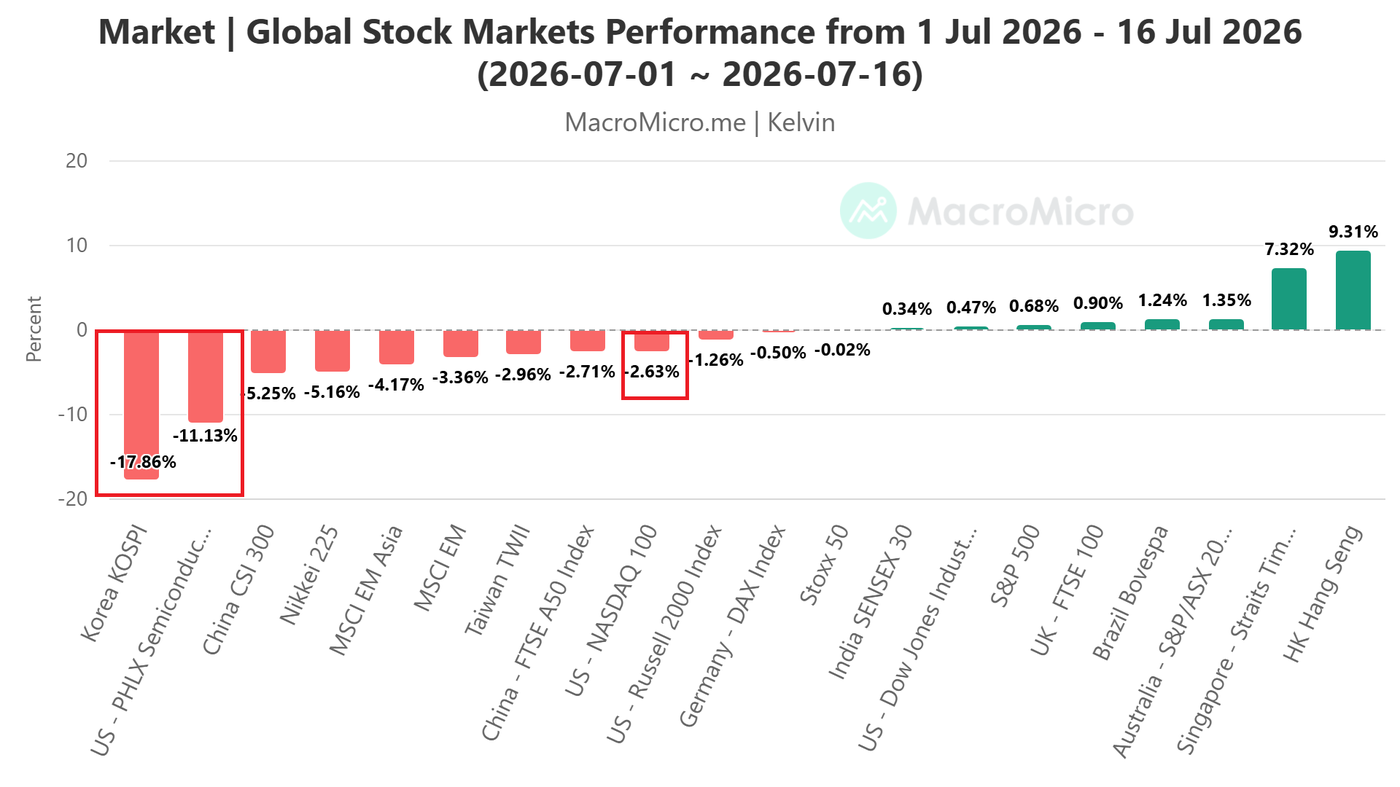
Fig. 1: Month-to-date global stock indices performance as of 16 Jul 2026 (Source: MacroMicro). The information presented is historical information, and past performance is not indicative of future performance.
One of the primary drivers of the Nasdaq 100’s current lackluster performance has been the “elevator up, elevator down” effect from AI infrastructure-related and high memory bandwidth semiconductor stocks that recorded triple-digit returns in the first half of 2026.
Right now, these stocks are facing an “elevator down” effect due to the unwinding of a significant amount of leveraged long financial products tied to two major global bellwethers, high memory bandwidth semiconductor stocks, South Korea’s SK Hynix and Samsung Electronics, that plummeted by 15.5% and 10.5% for the week of 13 July 2026.
Secondly, the semiconductor landscape is signalling a vital transition in risk appetite from unanchored thematic speculation to strict cash-flow discipline. While near-term corporate earnings confirm that chip demand is blistering, elevated capital expenditure forecasts from suppliers like TSMC have sparked deep anxieties about industry-wide supply overbuilding.
Despite a solid quarterly outlook and strong earnings beat from Taiwan Semiconductor Manufacturing Co. (TSMC), its concurrent higher capital spending forecast triggered a "sell the news" shockwave. Consequently, TSMC’s American Depositary Receipts (ADRs) plummeted 4.5% on Thursday, 16 July 2026.
Thirdly, if tech hyperscalers continue to spend capital aggressively on back-end hardware infrastructure while delaying the commercial execution and monetisation of consumer-facing models (as vividly illustrated by recent product pipeline delays from major players like Google), high-beta growth multiples will be compressed.
Valuation metrics will increasingly demand realised revenue rather than forward capex visibility, putting the tech-heavy Nasdaq 100 at severe risk of mean reversion decline.
Since the start of July 2026, AI infrastructure and high-memory-bandwidth semiconductor thematic benchmark stock indices have been the worst performers among major stock indices
South Korea’s KOSPI was punished with a horrendous month-to-date decline of 17%, and the US PHLX Semiconductor Index recorded a double-digit loss of 11.1% over the same period (see Fig. 1).
Let’s now unpack the relevant technicals.
Expanding volatility in US semiconductor stocks is dragging down Nasdaq 100
Fig. 2: iShares PHLX SOX Semiconductor major trend with volatility signal as of 16 Jul 2026 (Source: TradingView). The information presented is historical information, and past performance is not indicative of future performance.
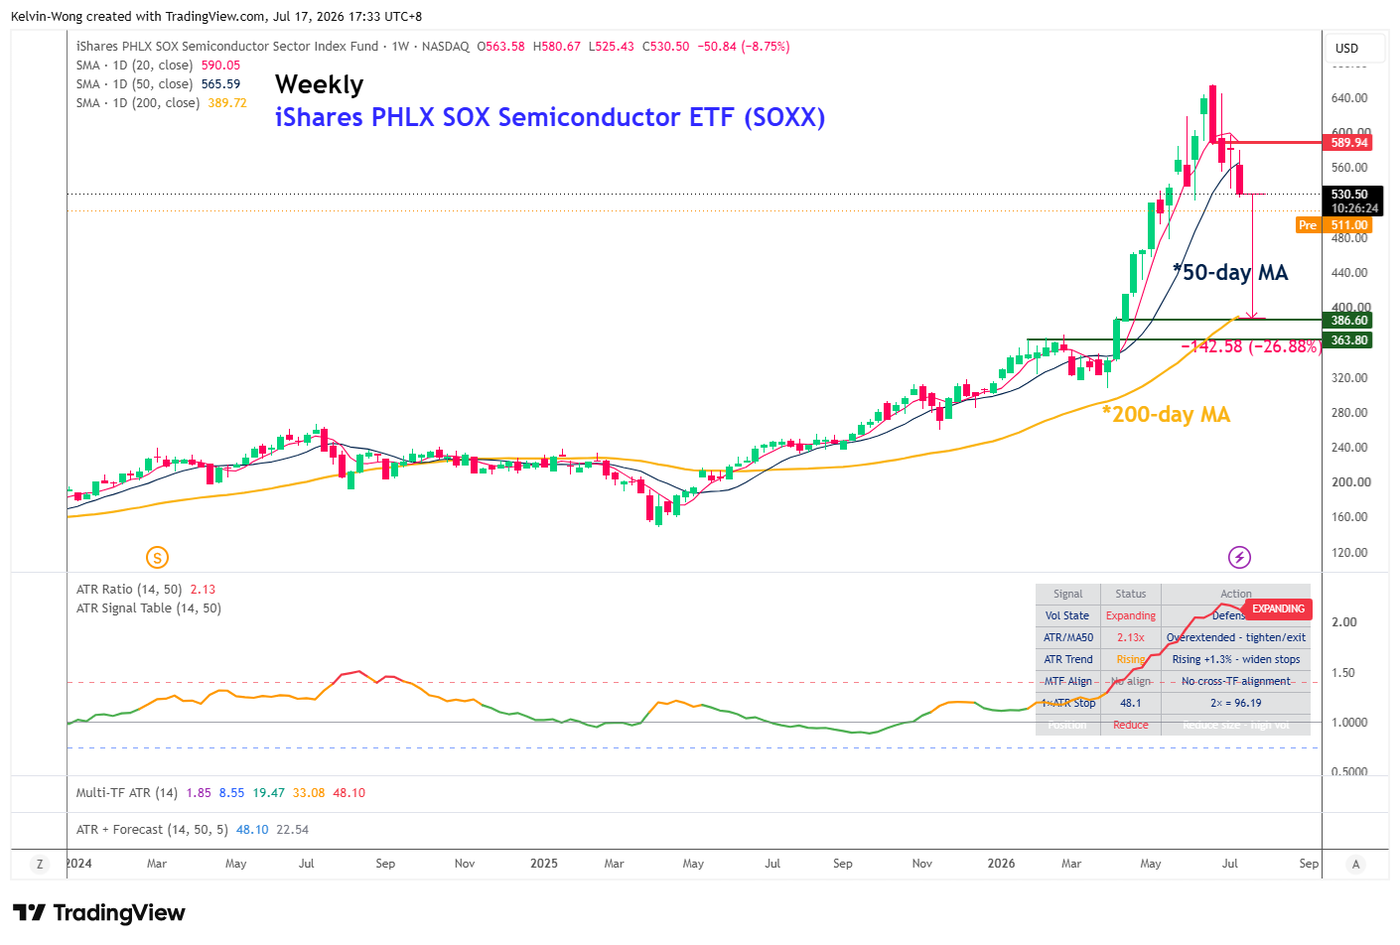
Fig. 3: iShares PHLX SOX Semiconductor ETF direct correlation with Nasdaq 100 as of 16 Jul 2026 (Source: TradingView). The information presented is historical information, and past performance is not indicative of future performance.
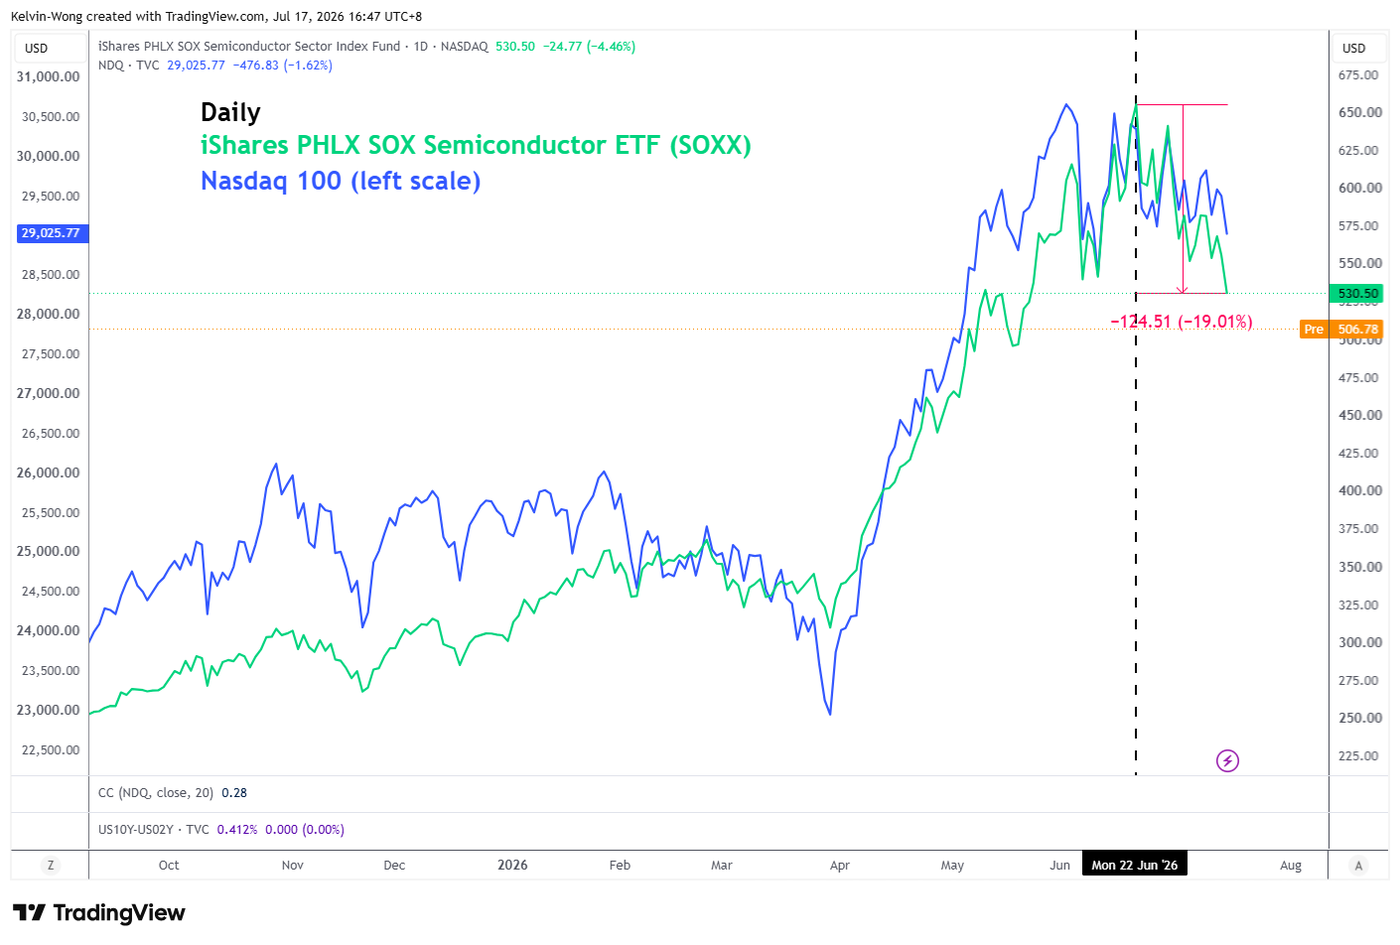
Based on the weekly price actions of the iShares PHLX SOX Semiconductor exchange-traded fund (SOXX), its realised volatility, measured by the distance between its 14-period Average True Range (ATR) and its corresponding 50-period moving average, has reached an expanding state of 2.13 times (see Fig. 2).
Given that SOXX has broken below its 50-day moving average, coupled with expanding realised volatility and its high direct correlation with the Nasdaq 100 since 22 June 2026 (see Fig. 3), SOXX is now facing an increased risk of a medium-term, multi-week corrective decline phase that may trigger a negative feedback loop into the Nasdaq 100.
Watch the 28,200 support on the US Nasdaq 100 CFD for further downside
Fig. 4: US Nasdaq 100 CFD minor trend as of 17 Jul 2026 (Source: TradingView). The information presented is historical information, and past performance is not indicative of future performance.
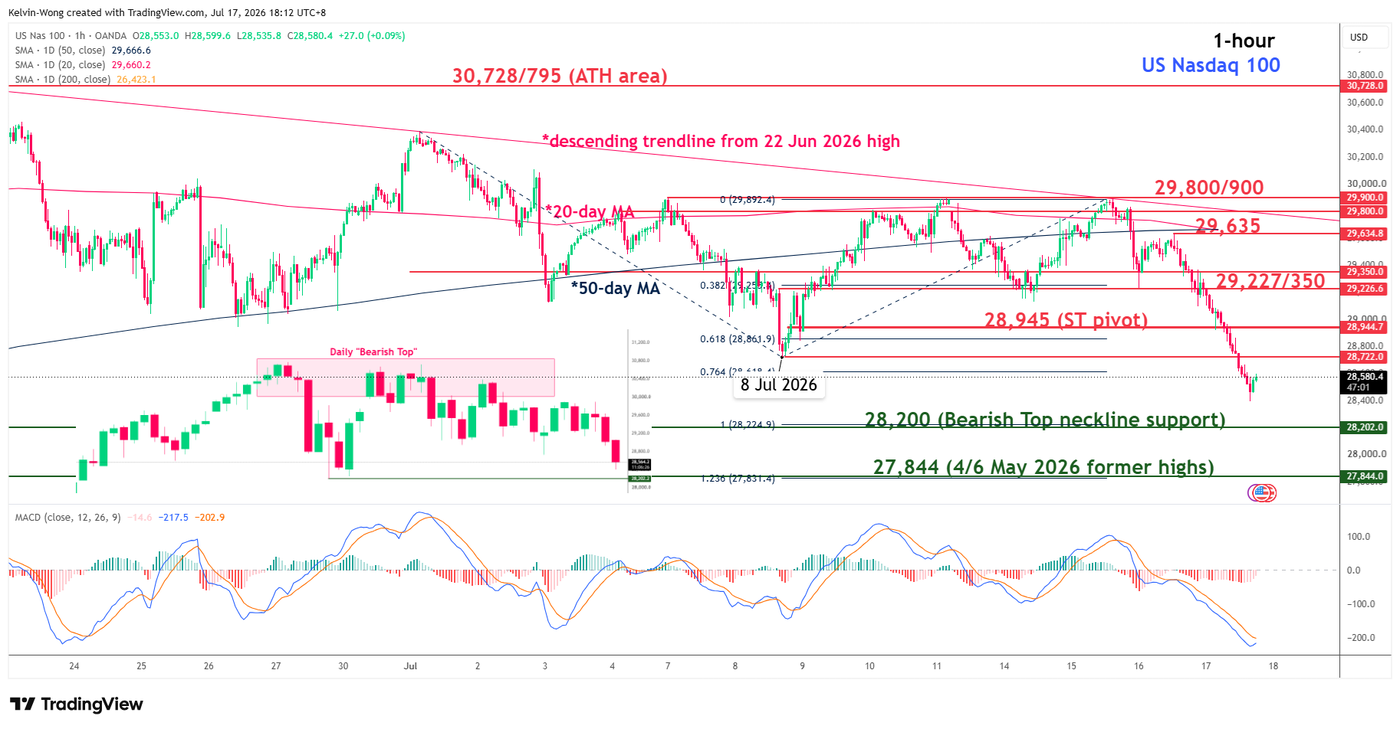
The 4% rebound seen on the US Nasdaq 100 CFD (a proxy of the Nasdaq 100 E-mini futures) may have run its course and face a terminal point on Wednesday, 15 July 2026, after it staged a bearish reaction from the descending trendline resistance from the 22 June 2026 high and traded back below both the 20-day and 50-day moving averages.
In addition, current price action (28,563 intraday at this time of writing) is now approaching the key 28,200 neckline support of a potential medium-term “Double Top” that has been forming on the daily time frame since the current all-time high was printed on 3 June 2026 (see Fig. 4).
Watch the 28,945 key short-term pivotal resistance to maintain a potential multi-day bearish trend bias, and a break below 28,200 may expose the next intermediate support at 27,844 (also a Fibonacci extension) in the first step.
Only a clearance with an hourly close above 28,945 damages the minor bearish trend for a mean reversion rebound towards the next intermediate resistances at 29,227/350 and 29,635 (also the intersection of the 20-day and 50-day moving averages).
The Dollar: Don’t Bet Against the US
- The US economy is strong and outperforming its rivals.
- USDJPY could reach 170, as FX interventions are not a concern.
The US dollar has managed to recoup some of the losses incurred over the previous two days, thanks to a decline in global risk appetite and FOMC hawkish tilt. They are preparing to hike the rate if inflation does not continue to move towards the 2% target. Against the backdrop of the renewed escalation in the Middle East, this seems an unlikely prospect.
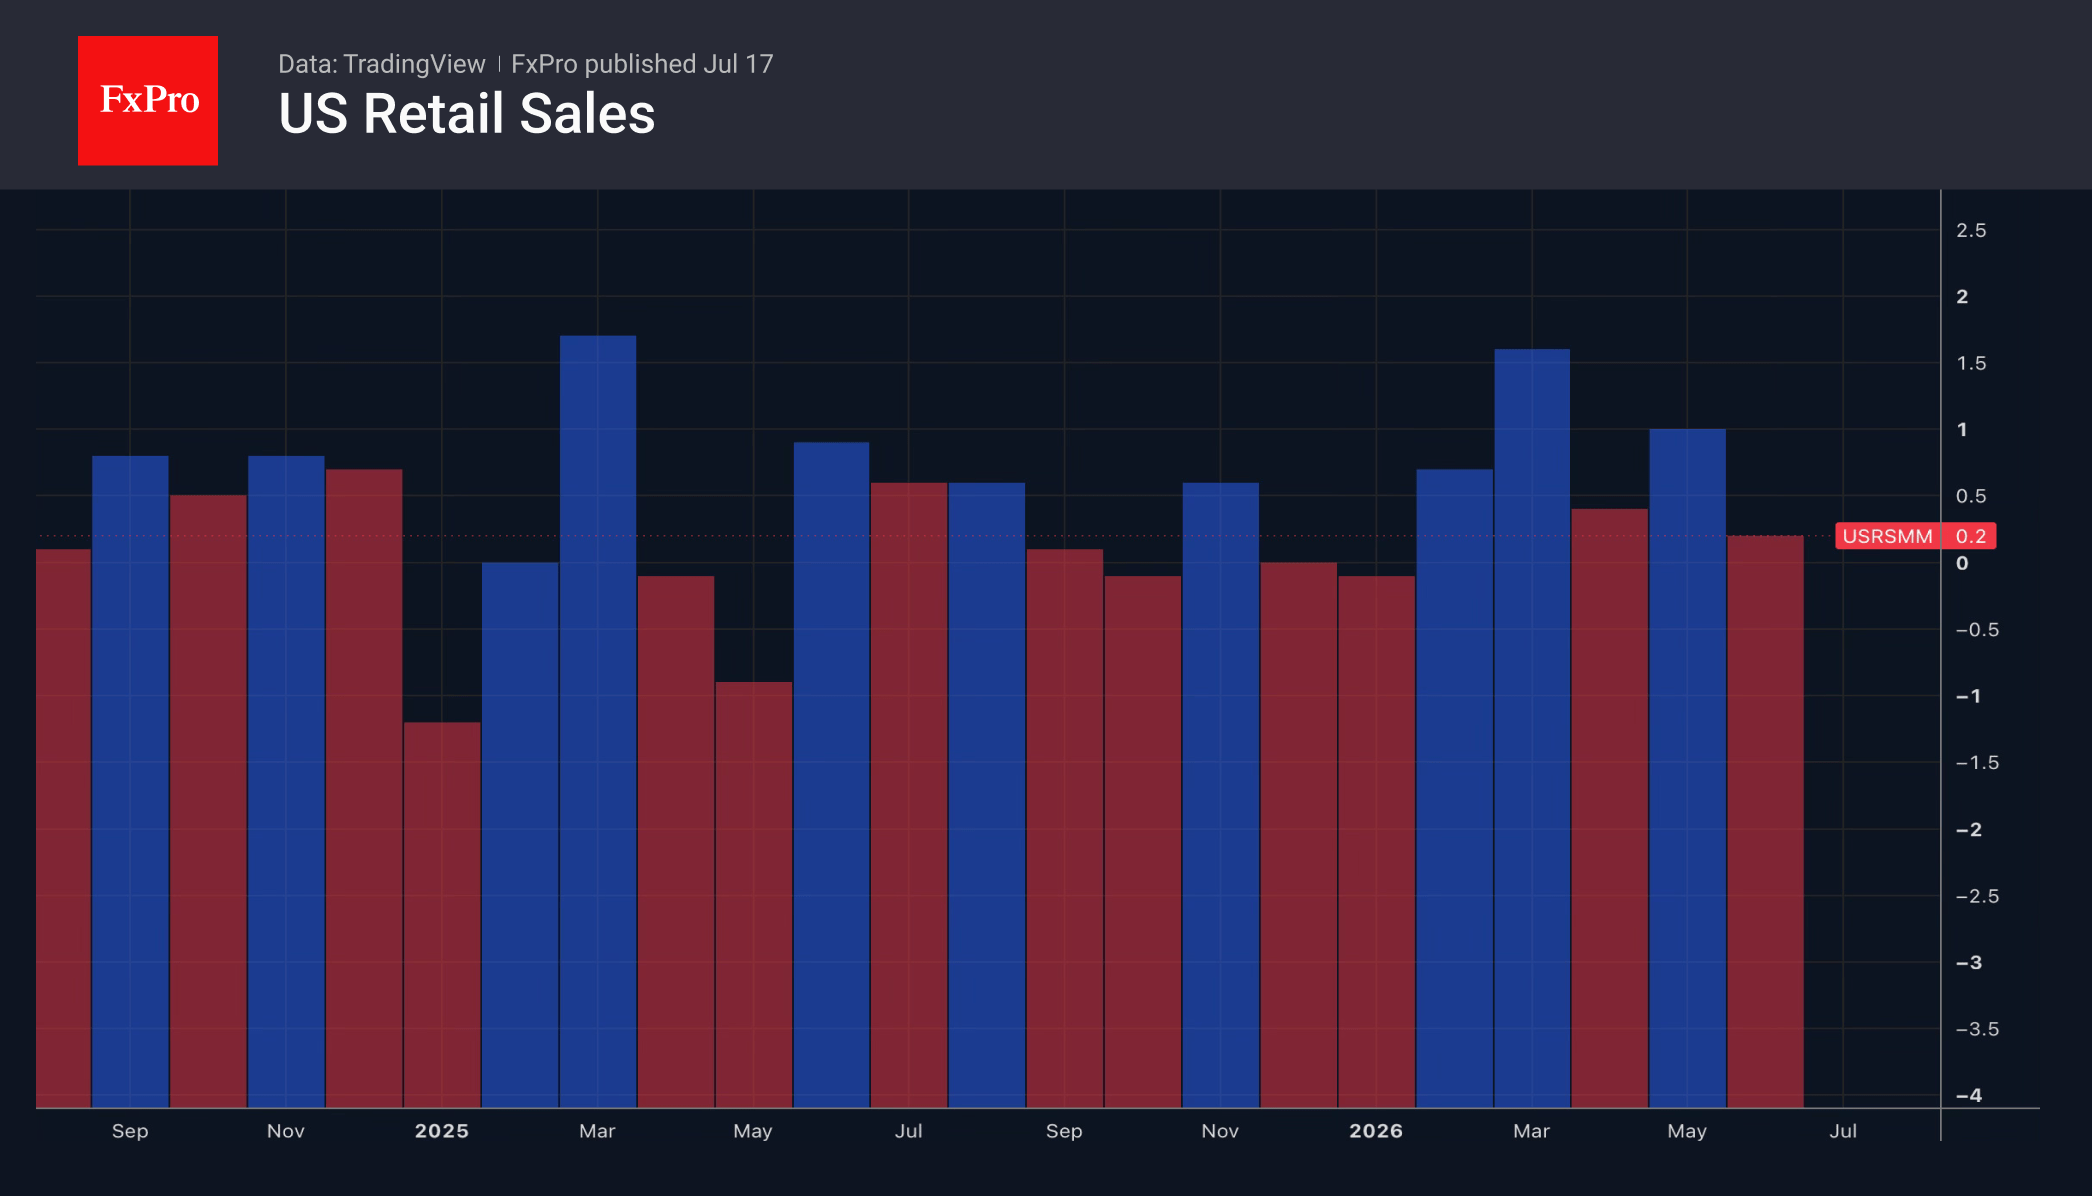
The growth in US retail sales in June, the eighth consecutive month of growth and the eleventh out of the last twelve, is a sign of the economy’s strength. According to Wells Fargo, if you bet against the American consumer, you will lose. This time, the improvement in demand was linked to falling gas and petrol prices; however, this factor is hardly a long-term trend. The resumption of conflict in the Middle East threatens to worsen the state of the retail sector soon.
However, the health of other global economies risks deteriorating even more rapidly. This is particularly true of those dependent on oil and gas, such as the eurozone. Traders may anticipate a tighter ECB monetary policy in 2026, but a slowdown in GDP will pose a peril for this plan. The interest rate differential with the Fed will remain wide, allowing Goldman Sachs to lower its forecast for the EURUSD to 1.12 from 1.18 in six months, and to 1.12 from 1.2 in 12 months.
The US dollar found support as global risk appetite weakened. A sell-off in Big Techs caused stock indices to retreat, and the escalation of the conflict in the Middle East boosted demand for the greenback as a safe-haven.
The strengthening of the US dollar allowed USDJPY to resume its rally. As a result, Sakuki Katayama returned to verbal interventions. According to the finance minister, the government will take decisive action at any time if necessary. The comments came ahead of the weekend in Japan, allowing the country to take advantage of the thin market to intervene in the forex market.
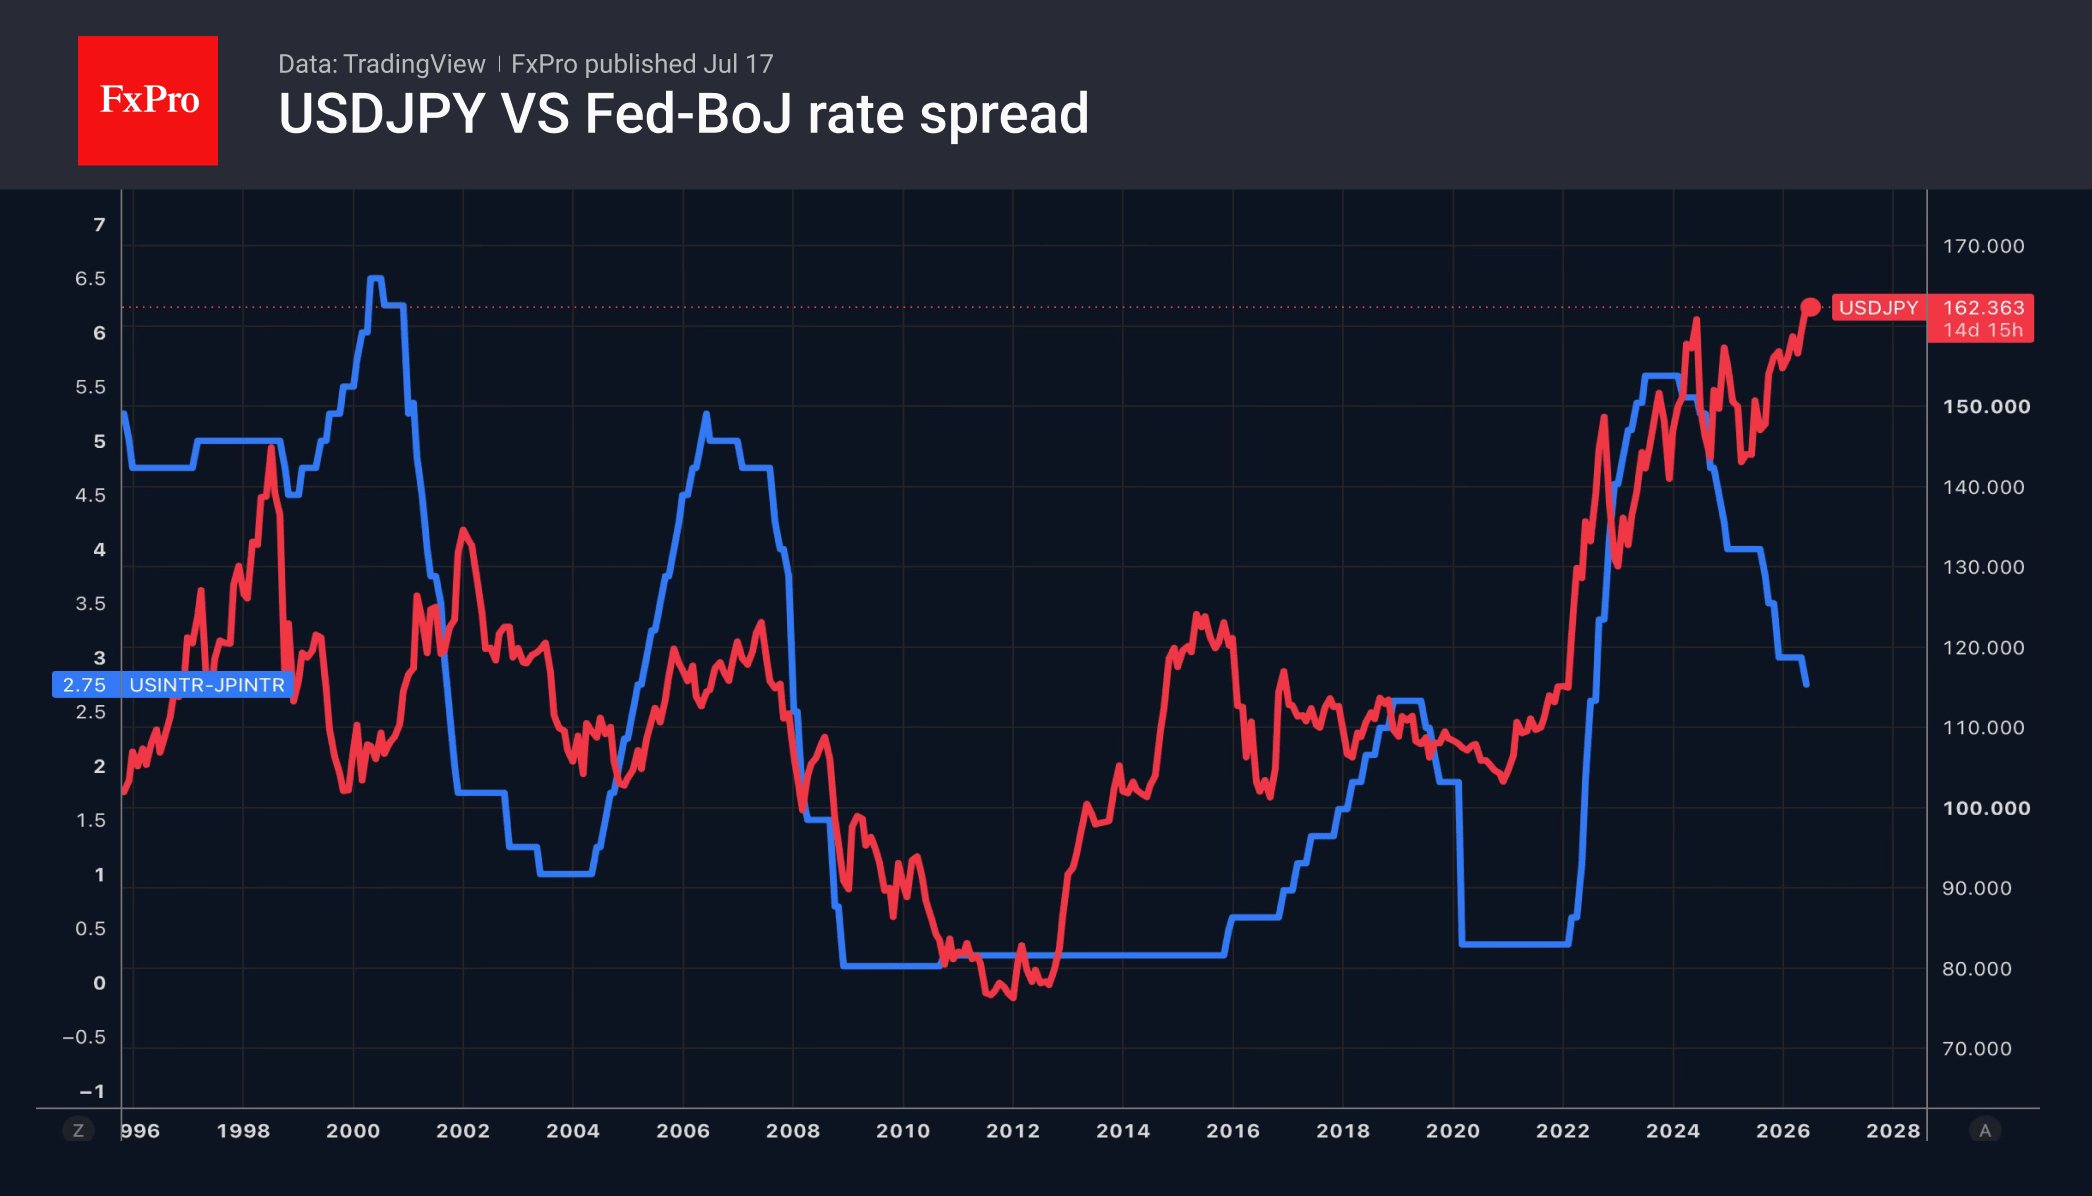
According to Kshitij Consultancy Services, Bloomberg’s most accurate forecaster for the yen in the second quarter, currency interventions will not help. USDJPY is set to rise to 170 by 2027, as indicated by US and Japanese stock index performance, the interest rate differential between the Fed and the BoJ, and the CNHJPY exchange rate.
The FxPro Analyst Team
A False Bullish Breakout for Bitcoin?
Market Overview
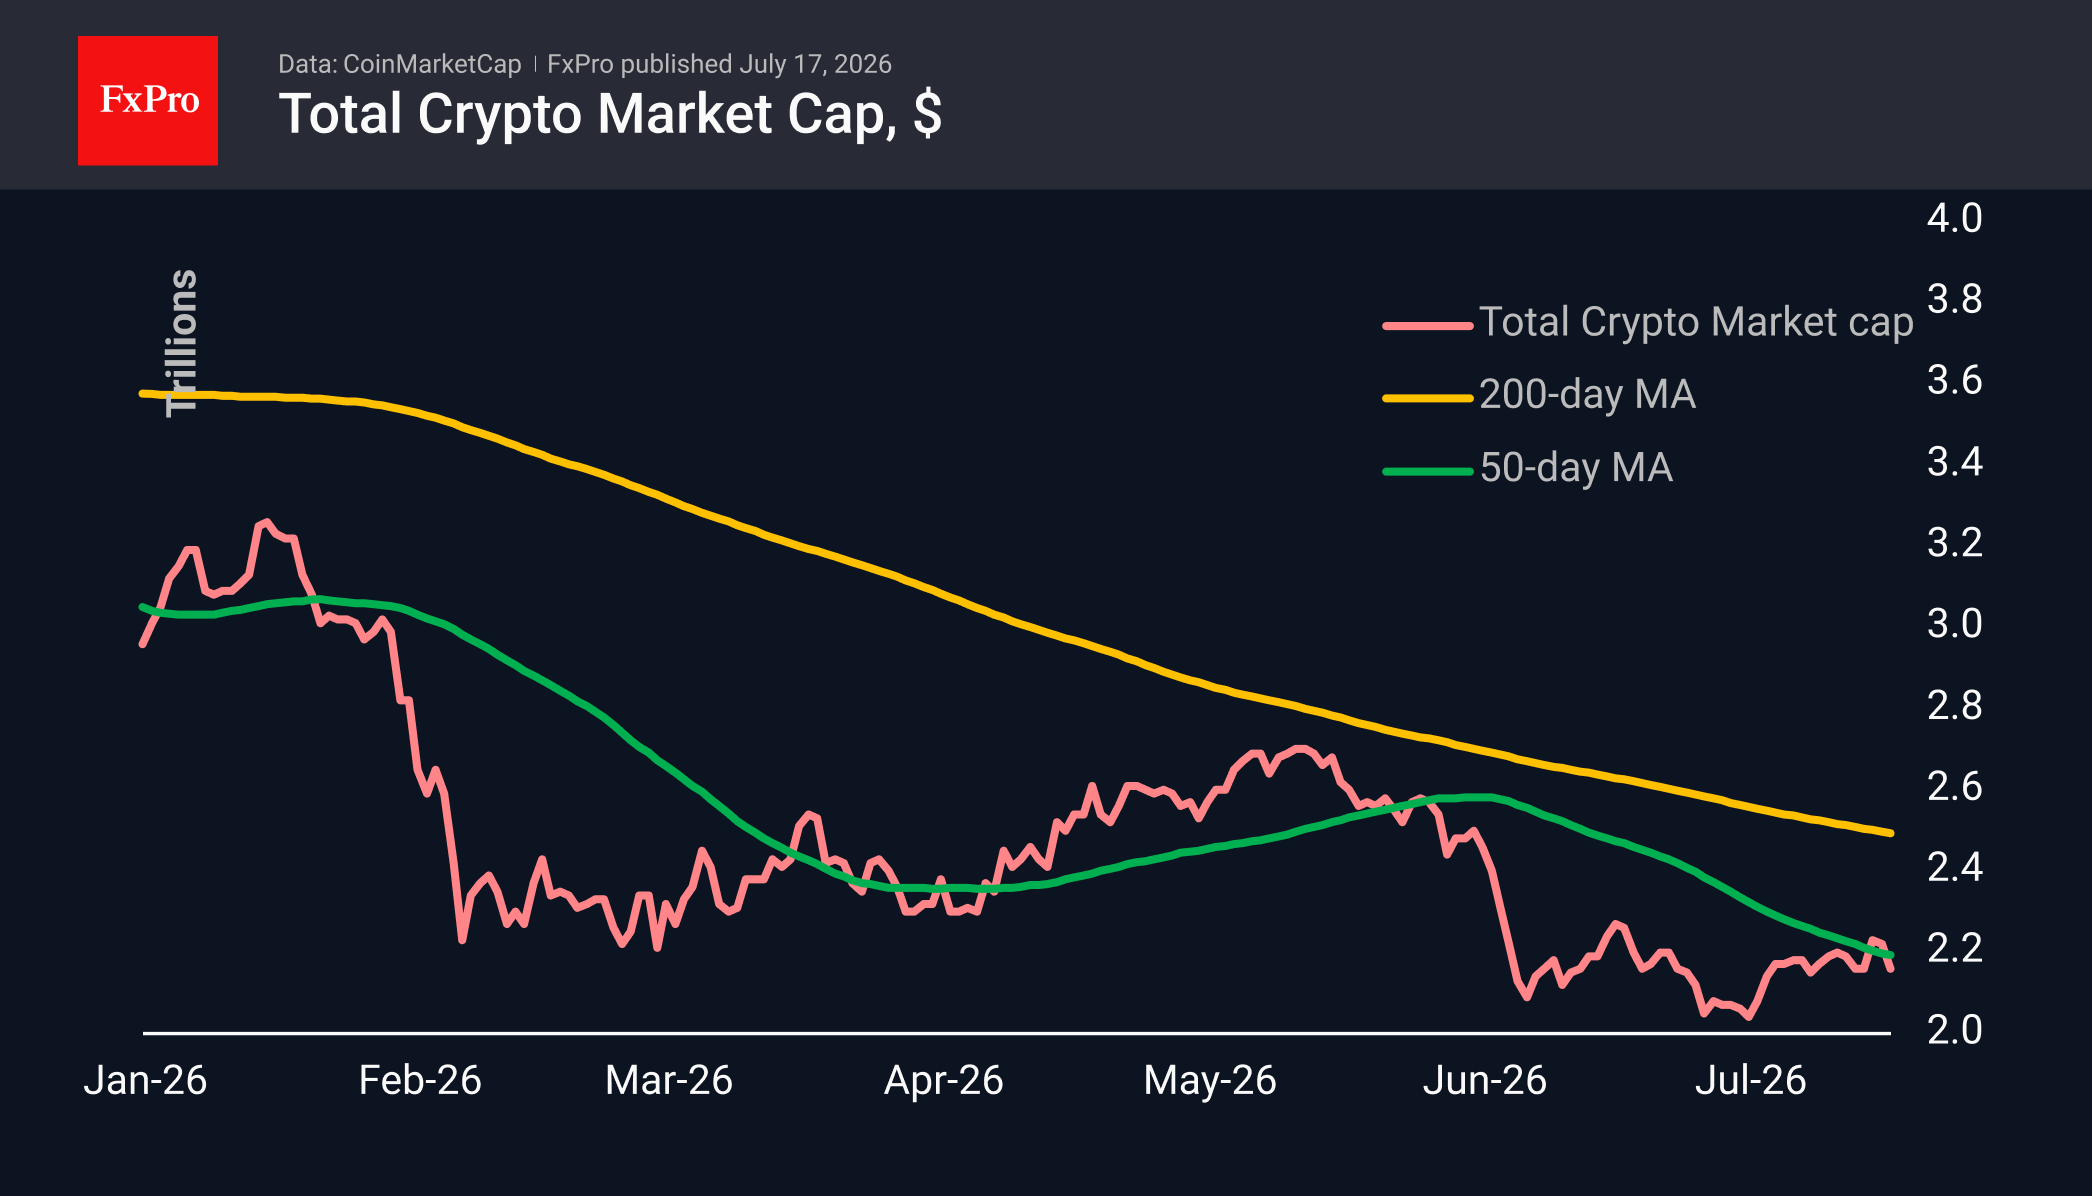
The crypto market capitalisation fell by 2.7% to $2.16T amid growing nervousness in traditional financial markets, where concerns over AI spending have intensified. The crypto market has returned to the levels seen at the start of the week, while the Nasdaq 100 is testing the region of its June lows. Furthermore, the crypto market capitalisation is trading near its 50-day moving average as the Nasdaq 100 is being sold off with alarming determination after dipping below it. At present, the situation appears to be a short-term sign of strength for cryptocurrencies following several months of pressure; however, sustained declines in shares and bonds have repeatedly forced investors to rebalance their portfolios, leading to painful selloffs in cryptocurrencies. Among the top coins, the biggest fallers include Zcash (-6.4%), Near Protocol (-5.3%) and Tezos (-5%). Polkadot (+1.1%), Litecoin (-0.2%) and Bitcoin Cash (-0.8%) are temporarily outperforming the market.
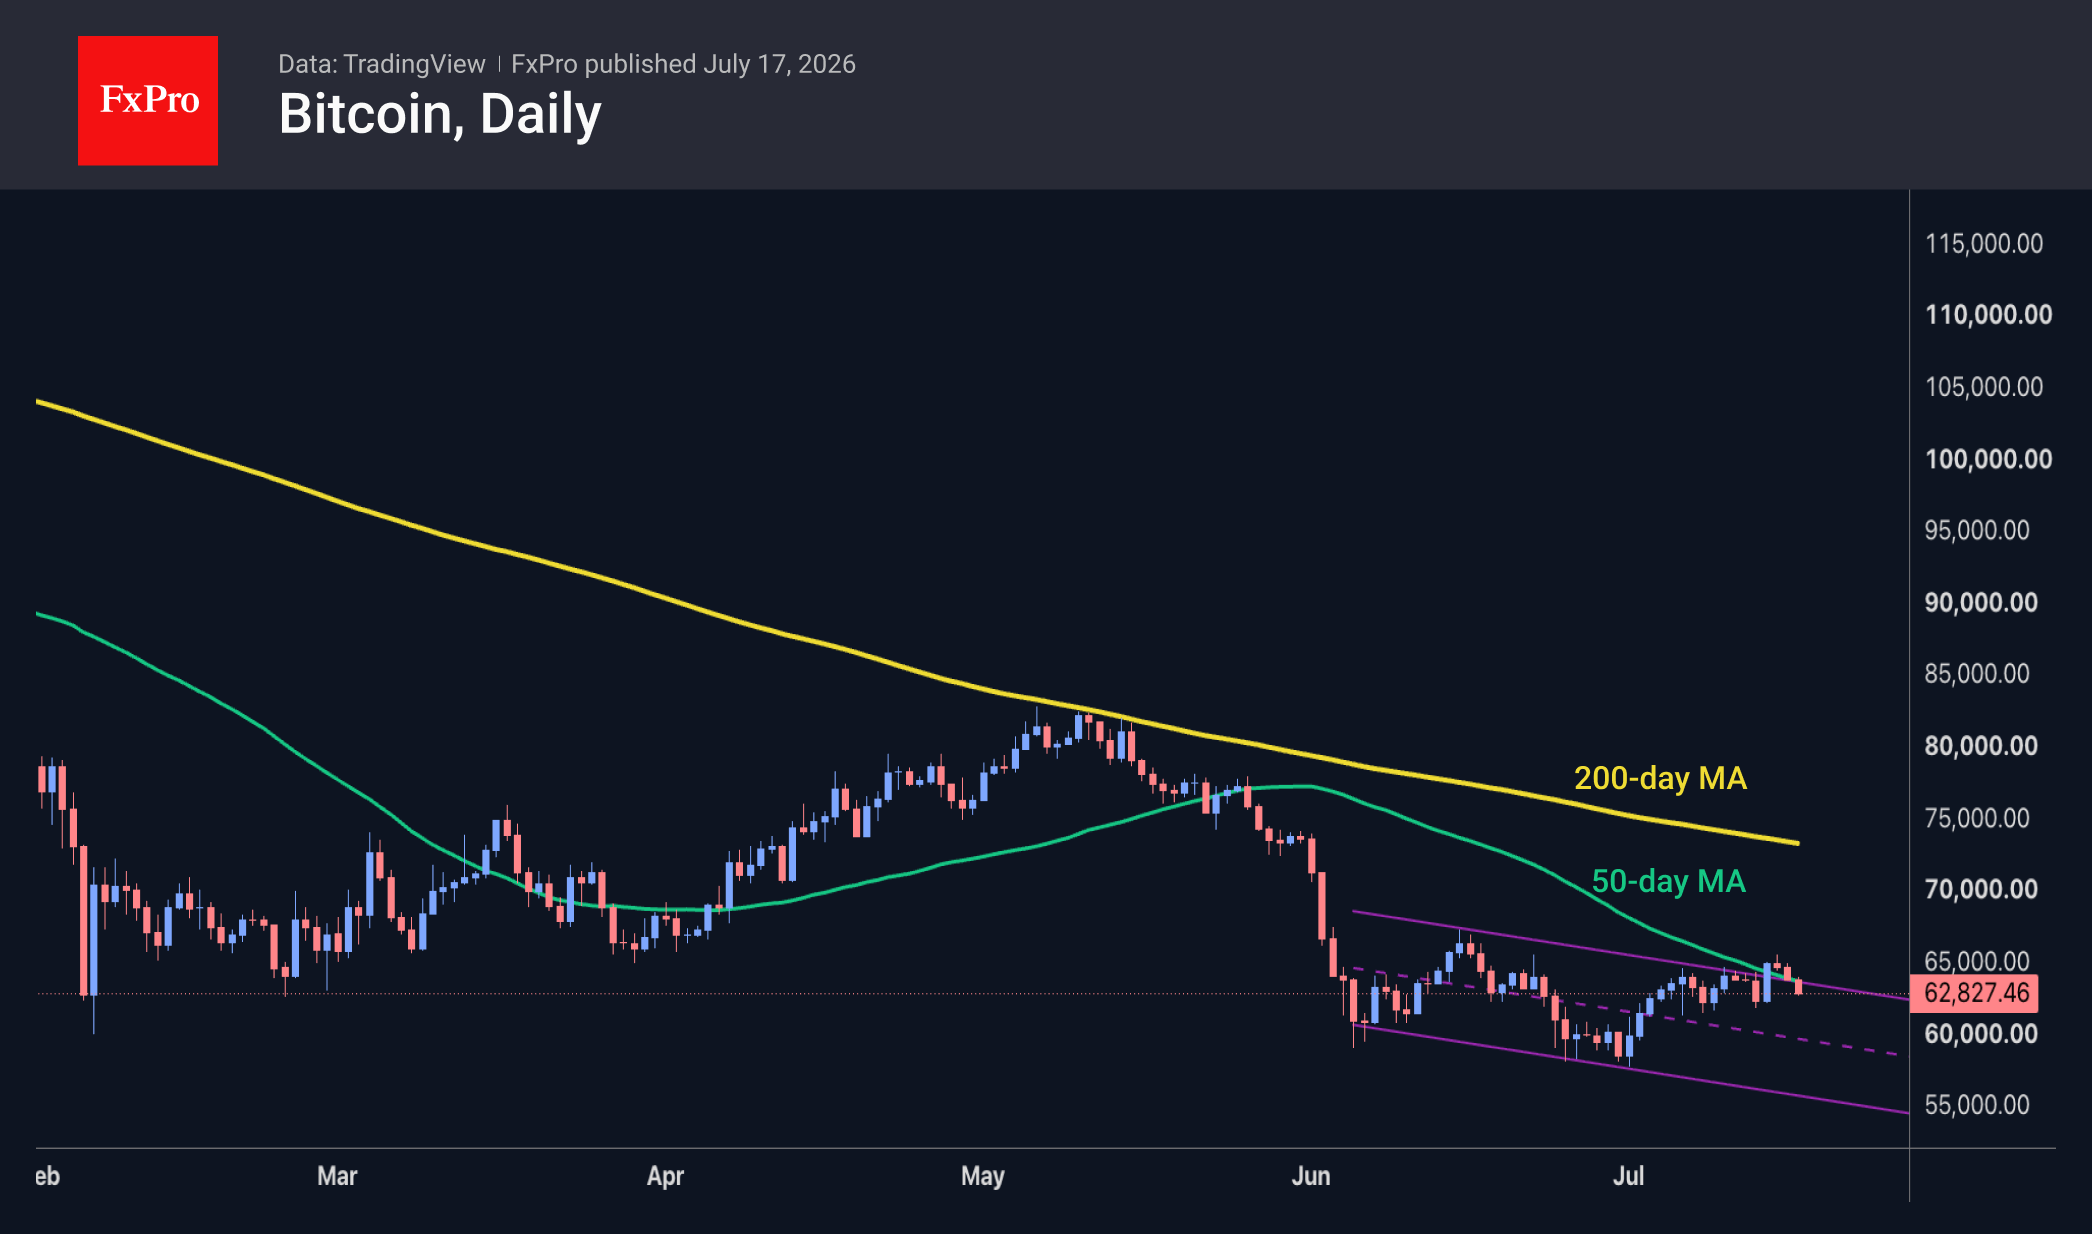
Bitcoin has lost 2.9% over the past 24 hours, falling back to $62.8K. Due to external pressure, the leading cryptocurrency has failed to confirm a reversal of the downtrend, as higher highs were not formed, and the price quickly fell back below the 50-day MA, returning to the downtrend channel in place since June. The lower boundary of this range is currently near $56K, but support should also be expected near $61K and $59K, at previous local lows.
News Background
The proportion of long-term investors selling Bitcoin at a loss has stopped rising, which may be an early sign that the sell-off is coming to an end. The market is forming a bottom, but has not yet received signals for sustained growth, according to Glassnode. To confirm a recovery, BTC needs to consolidate above $65K and break through the key $69K level (the average price of short-term holders).
Strategy has no intention of abandoning its long-term holding strategy for the leading cryptocurrency. Still, it will only resume buying BTC once its preferred shares (STRC) have recovered to their par value of $100, having refrained from buying Bitcoin for the past three weeks. The company will only consider debt-related risks should BTC fall to $8K–$10K, the company stated.
Bitcoin appears ‘stable’ at this stage, largely due to a reduction in market participants’ leverage, said Larry Fink, CEO of BlackRock, the world’s largest asset management firm. In his view, the next 12 months look “very optimistic” for global markets as a whole.
Peter Schiff, head of Euro Pacific Capital and a crypto-sceptic, has urged investors to sell off all their bitcoins before the leading cryptocurrency breaks through the $58K support level. It could then fall below $50K, before plummeting to $30K or even $20K if the market fails to find new drivers for growth.
The FxPro Analyst Team
EUR/USD Subdued by Data: Chances of Fed Rate Hike Diminish
Weaker-than-expected US inflation data led markets to scale back expectations of an imminent Federal Reserve rate hike. At the same time, escalating US-Iran tensions continue to sustain inflationary concerns.
The United States has launched several strikes against Iran this week, while Tehran has responded with attacks on US bases in neighbouring countries.
US consumer inflation came in softer than forecast in June, while producer prices unexpectedly fell. Retail sales increased in line with expectations: lower petrol prices reduced gas station revenues, while spending from car dealers and online retailers remained stable.
The number of initial jobless claims fell to a two-month low of 208,000. Markets have now all but ruled out a Fed rate hike in July, though views remain mixed on the possibility of a move in September.
Technical Analysis
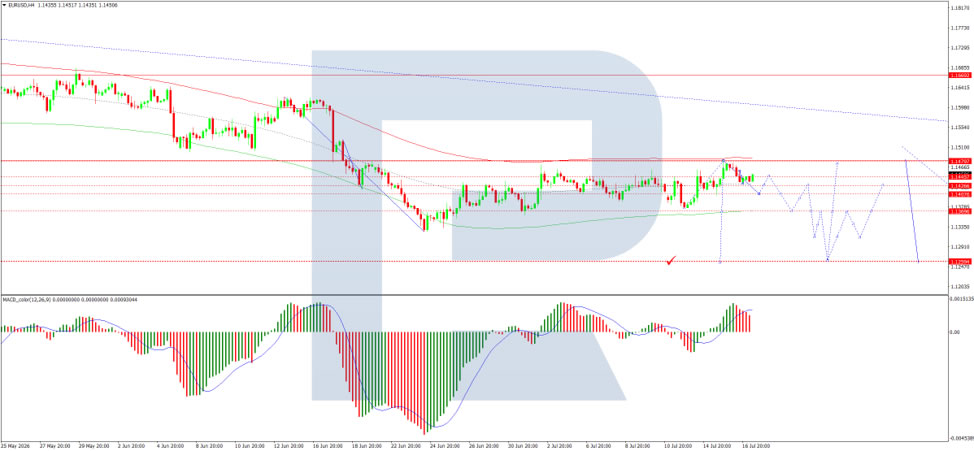
On the H4 chart of EUR/USD, the market has formed a consolidation range around the 1.1458 level, currently extending down to 1.1430 and up to 1.1455. A consolidation range around this level is practically complete. An upside breakout would suggest a corrective wave developing to 1.1465, followed by a decline to 1.1260. A direct downside breakout would open potential for a downward wave to 1.1260. Technically, this scenario is confirmed by the MACD indicator-its signal line is above zero but pointing strictly downwards, reflecting continued bearish momentum with the potential for the trend to continue lower.
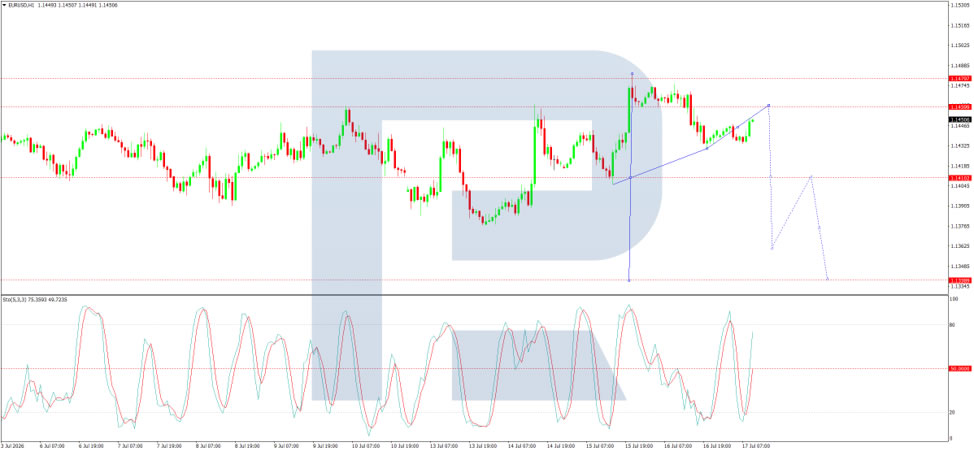
On the H1 chart, the market has completed the next downward wave to the 1.1430 level. A consolidation range is currently forming above this level. Today, a range expansion up to 1.1455 and down to 1.1400 is expected, followed by a decline to 1.1260. Technically, this scenario is confirmed by the Stochastic oscillator-its signal line is above the 20 level and pointing strictly upwards to 80.
Conclusion
EUR/USD is drifting lower on Friday as markets digest a mixed bag of US data. Softer-than-expected inflation figures-with consumer prices easing and producer prices unexpectedly falling-have reduced the likelihood of an imminent Fed rate hike. However, escalating US-Iran tensions continue to underpin inflationary fears, adding a layer of complexity to the policy outlook. Retail sales met expectations, with lower petrol prices offset by stable spending elsewhere, while jobless claims fell to a two-month low. Markets have priced out a July hike but remain divided on September. Technically, the bearish outlook for EUR/USD remains intact, with downside potential towards 1.1260 in the medium term, though near-term consolidation around current levels is possible.
Chip Rout Spreads from KOSPI to Nikkei. Will NASDAQ Be Next?
Semiconductor selloff has evolved from a regional correction into a broader test of confidence in AI investment cycle. South Korea appears to have delivered first warning earlier this month, when semiconductor-heavy KOSPI broke below its 55 D EMA. Selling then spread through US chipmakers on Thursday before accelerating across Japan and Taiwan on Friday. Nikkei slumped -4%, led by a -16% plunge in Kioxia, -9% fall in Murata and -3.8% decline in TDK, while NASDAQ futures dropped more than -2% during European morning. Focus now shifts back to Wall Street and whether weakness completes a full circuit from Asia to US.
Price action in TSMC offered clearest evidence that investor psychology toward AI trade is changing. Company reported a 77% annual earnings increase and raised its 2026 capital expenditure guidance from USD 52-56B to USD 60-64B. Yet its shares still fell more than -7% in Taiwan today. Strong earnings and greater AI investment would previously have been enough to lift semiconductor valuations. Latest reaction suggests investors are not prepared to reward spending alone and are instead demanding clearer evidence that record capital expenditure will generate corresponding profit and productivity gains.
Alphabet's delay of flagship Gemini 3.5 Pro model provided an important trigger for renewed anxiety. Delay revived questions over pace of AI commercialization and whether returns from infrastructure spending will arrive quickly enough to justify valuations already embedded across chip sector. Those concerns echoed Thursday's US session, when SanDisk fell more than -12% and Micron, AMD and Broadcom each dropped around -5%, even as NASDAQ declined a comparatively smaller -1.47%. South Korea was closed for a holiday on Friday, but its earlier decline increasingly looks like beginning of a broader reassessment that has now spread through Japan and Taiwan.
Geopolitical developments are compounding pressure at particularly vulnerable moment. Iran conflict has widened further, with fresh strikes reported across Jordan, Bahrain and Kuwait. An unconfirmed report that Iran targeted King Fahd Causeway linking Bahrain and Saudi Arabia would represent a new category of escalation involving major infrastructure. Oil is on course for its largest weekly gain since April, increasing inflation and discount-rate risks for long-duration growth stocks. Separately, US President Donald Trump's accusation that China carried out a large-scale voter-data breach pushed Australian and New Zealand Dollars lower, adding another risk-off layer for markets already questioning sustainability of AI boom.
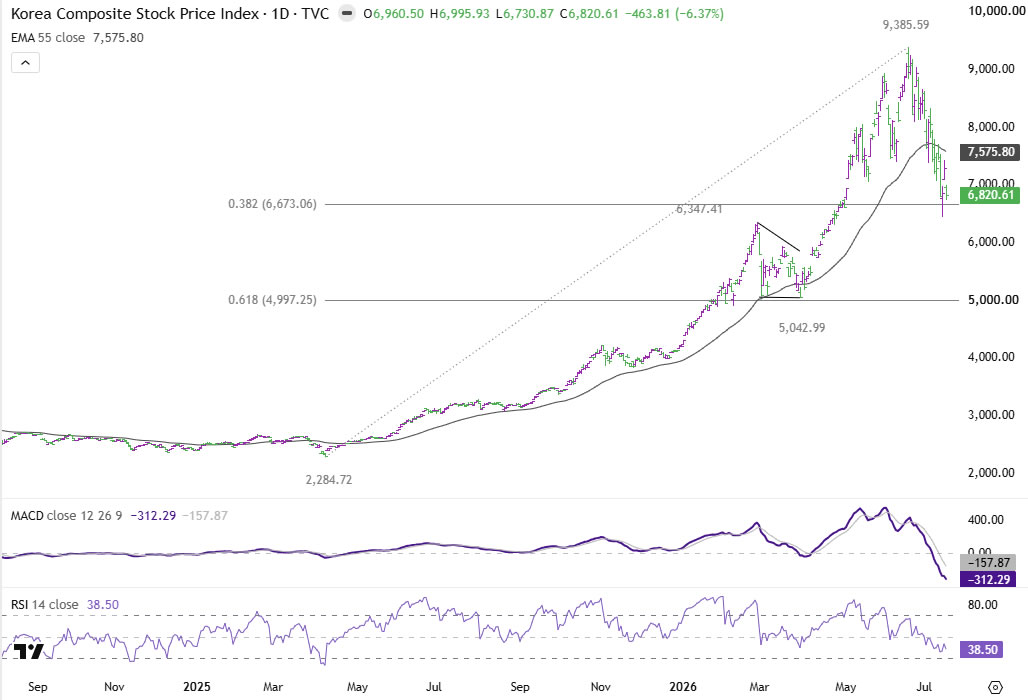
Technically, KOSPI remains most advanced in its correction. Fall from 9,385.59 is correcting entire uptrend from 2,284.72 and has already reached 38.2% retracement at 6,673.06 earlier this week. That level may initially slow downside momentum, but selling could intensify if bearish sentiment spreads further through global semiconductor complex.
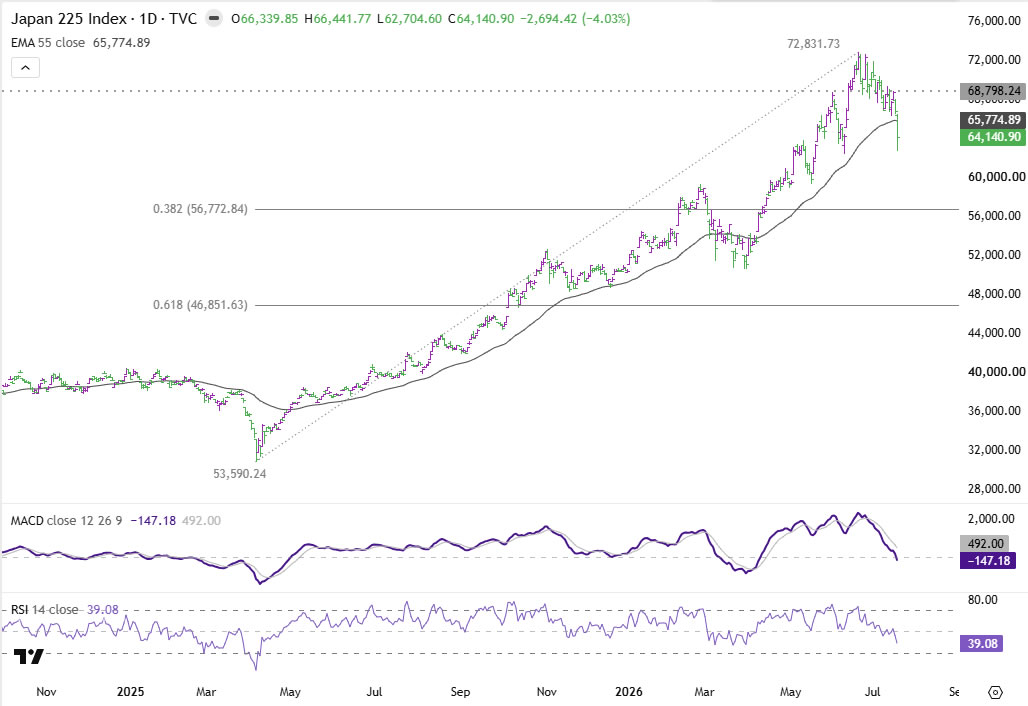
Nikkei has now joined breakdown after closing at 64,140.90, well below its 55 D EMA at 65,774.89. Development suggests a medium-term top was formed at 72,831.73. Further decline is expected while 68,798.24 resistance holds, with 60,000 psychological level next target. Firm break there would expose 38.2% retracement of 53,590.24 to 72,831.73 at 56,772.84.
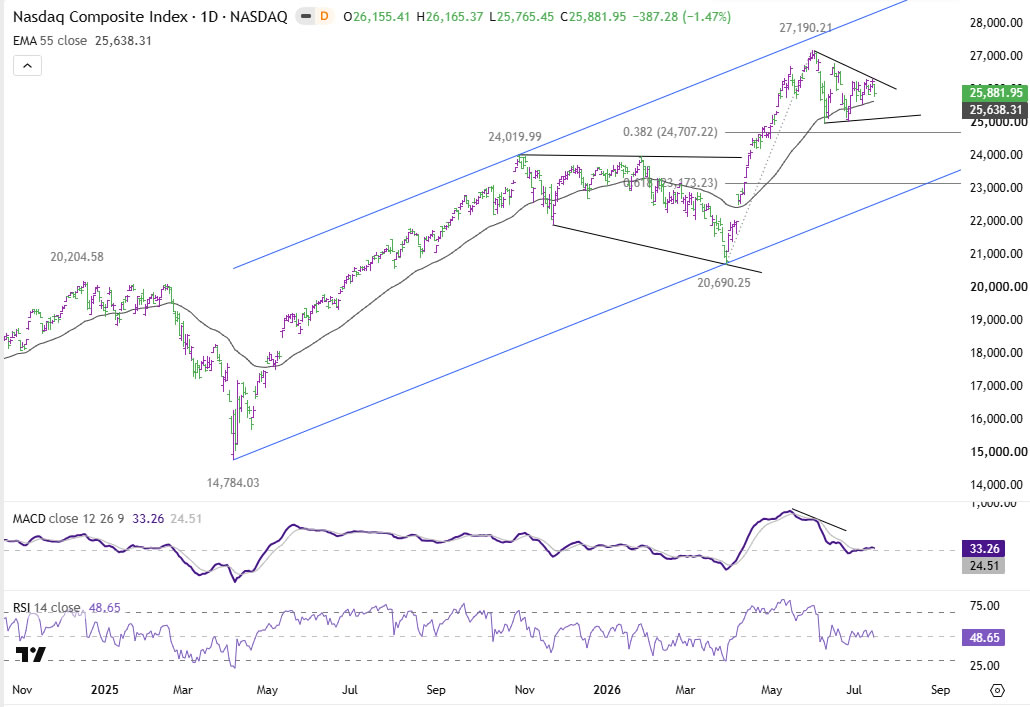
NASDAQ is now critical link. A close below its 55 D EMA, currently at 25628.31 today, would argue that correction from 27,190.21 is extending into another falling leg, bringing 38.2% retracement of 20,690.25 to 27,190.21 at 24,707.22 back into focus.
Further break of 24,707.22 would argue that semiconductor weakness is not confined to individual stocks or Asian markets, but has developed into a global reassessment of AI investment cycle. Korea fired first warning, Japan and Taiwan have followed, and Wall Street must now decide whether investors still trust spending-led AI narrative—or require hard evidence of returns before stepping back in.
Eurozone June CPI Confirms Inflation Cooled to 2.8%, Services and Core Price Pressures Moderate
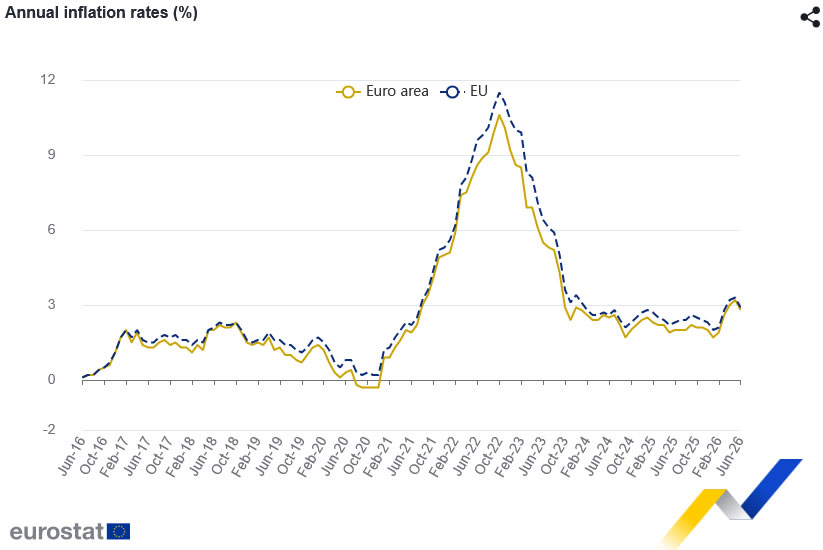
Eurozone inflation moderated in June as softer price pressures across services and core components more than offset still-elevated energy costs. Eurostat confirmed that annual consumer price inflation slowed to 2.8% from 3.2% in May, while European Union inflation eased to 2.9% from 3.3%. Inflation declined in 22 member states, highlighting that the latest improvement was broadly shared across the region rather than driven by isolated national developments.
The composition of inflation offered further encouragement for policymakers. In the Eurozone, Services inflation eased from 3.5% to 3.2%, while core inflation excluding energy slowed from 2.4% to 2.2%. The measure excluding energy, food, alcohol and tobacco also moderated from 2.6% to 2.4%, indicating that underlying price pressures softened. Food inflation added to the disinflationary trend, with the food, alcohol and tobacco category slowing from 1.9% to 1.5%.
Energy nevertheless remains the principal obstacle to a full return to price stability. Annual energy inflation eased to 8.5% from 10.8%, helped by a -1.8% monthly decline in energy prices, but it still accounted for 0.77 percentage points of headline inflation. While the latest figures reinforce the view that domestic inflation pressures are gradually cooling, the ECB is unlikely to declare victory with geopolitical risks still threatening renewed volatility in energy markets. Continued moderation in services and core inflation will be key if inflation is to return sustainably to the central bank's 2% objective.
Economic Data
| Indicator | Actual | Expected | Previous |
|---|---|---|---|
| Headline HICP YoY | 2.8% | 2.8% | 3.2% |
| Headline HICP MoM | -0.1% | -0.1% | 0.0% |
| Core HICP (ex. Energy) YoY | 2.2% | — | 2.4% |
| Core HICP (ex. Energy, Food, Alcohol & Tobacco) YoY | 2.4% | — | 2.6% |
| Services Inflation YoY | 3.2% | — | 3.5% |
| Energy Inflation YoY | 8.5% | — | 10.8% |
Key Takeaways
- Headline HICP slowed from 3.2% to 2.8%, matching the flash estimate and confirming inflation eased in June.
- Core inflation continued to moderate, with HICP excluding energy slowing from 2.4% to 2.2%, while the narrower core measure eased from 2.6% to 2.4%.
- Services inflation, closely watched by the ECB, cooled from 3.5% to 3.2%, suggesting domestic price pressures are gradually easing.
- Food, alcohol and tobacco inflation slowed further from 1.9% to 1.5%, adding to the broad-based disinflation trend.
- Energy inflation remained elevated at 8.5%, though it eased from 10.8% as monthly energy prices fell -1.8%.
- Inflation declined in 22 of the EU's 27 member states, indicating the moderation was broad-based rather than country-specific.
- The report supports the view that underlying inflation is cooling, but persistent energy risks mean the ECB is likely to seek further confirmation before becoming more confident that inflation is returning sustainably to its 2% target.