
Sample Category Title
USD/CHF Daily Outlook
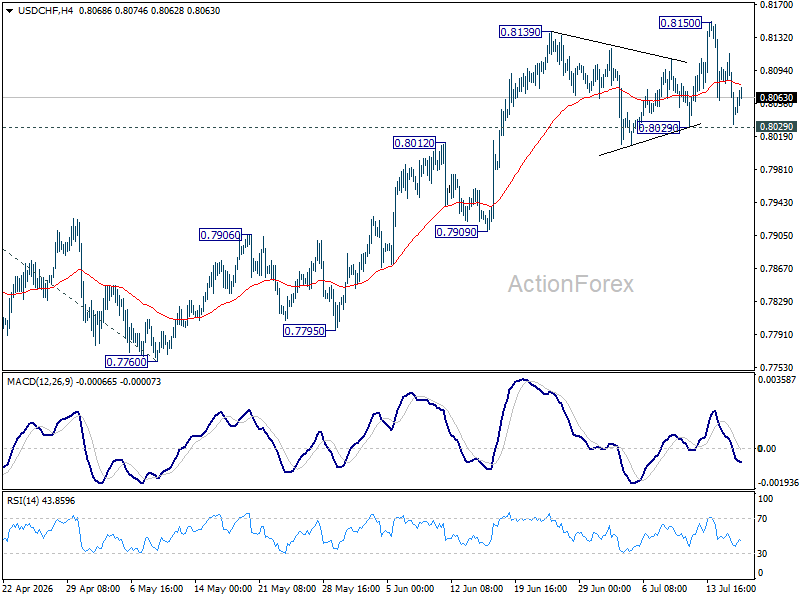
Intraday bias in USD/CHF remains neutral for the moment. On the upside, break of 0.8150 will resume the rally from 0.7660 and target 100% projection 0.7603 to 0.8041 from 0.7600 at 0.8198. However, firm break of 0.8029 support will confirm short term topping, and turn bias back to the downside for 55 DEMA (now at 0.7985) and below.
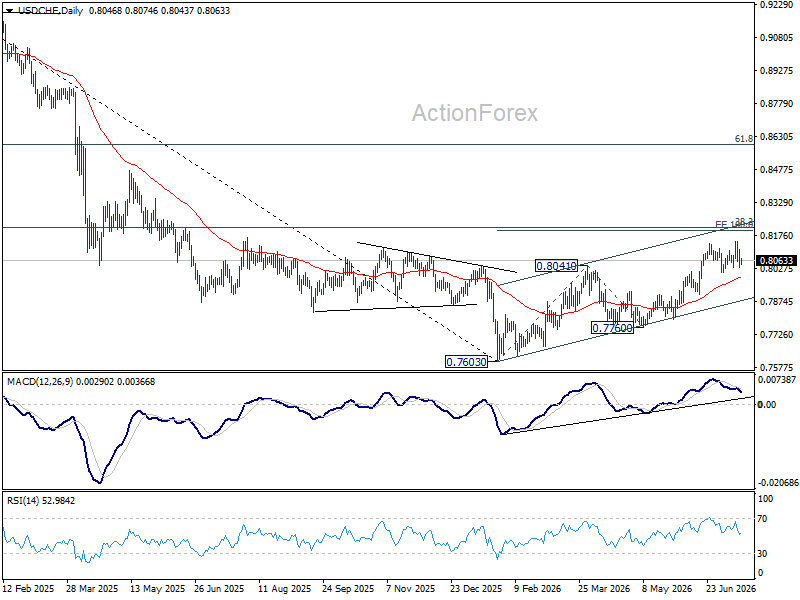
In the bigger picture, while a medium term bottom was formed at 0.7603, it's still early to call for bullish trend reversal. As long as 38.2% retracement of 0.9200 (2025 high) to 0.7603 at 0.8213 holds, the larger down trend could still continue through 0.7603 at a later stage. However, firm break of 0.7603 will argue that the trend has reversed and turn focus to 0.8332 support turned resistance (2023 low) for confirmation.
AUD/USD Daily Report
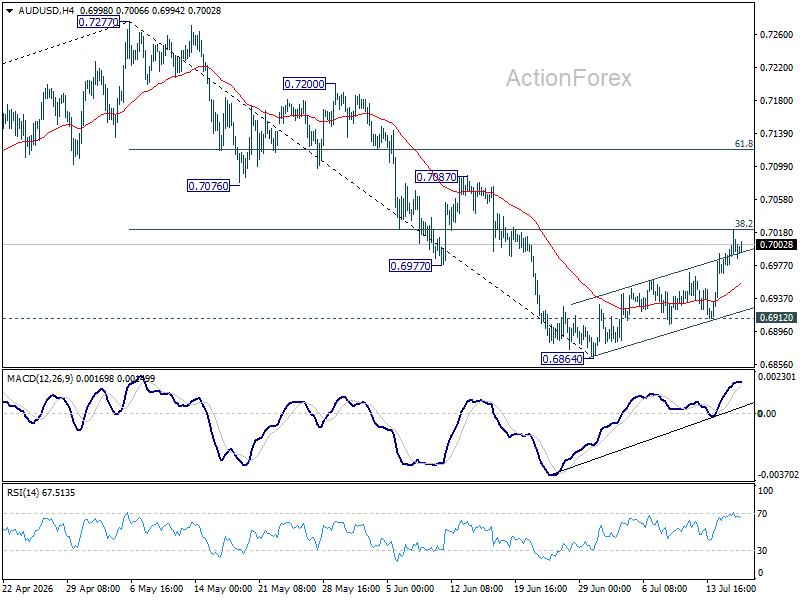
Intraday bias in AUD/USD remains mildly on the upside at this point. Firm break of 38.2% retracement of 0.7277 to 0.6864 at 0.7022 will target 61.8% retracement at 0.7119 next. On the downside, however, below 0.6912 minor support will turn bias back to the downside for 0.6864 low.
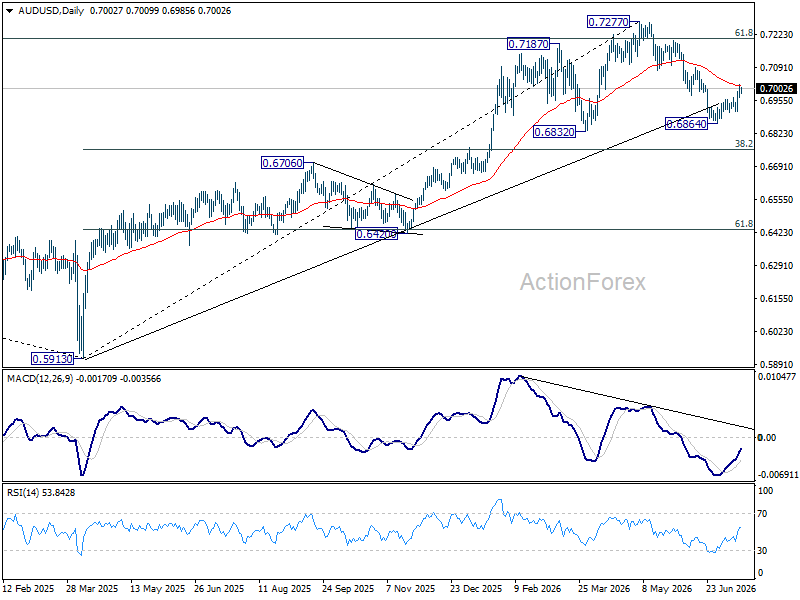
In the bigger picture, considering bearish divergence condition in D MACD, a medium term top could be formed at 0.7277 after failing to sustain above 61.8% retracement of 0.8006 (2021 high) to 0.5913 (2024 low) at 0.7206. Deeper fall could be seen to 38.2% retracement of 0.5913 to 0.7277 at 0.6756 as a correction. But strong support should be seen there to bring rebound. Consolidations would continue below 0.7277 for a while.
USD/CAD Daily Outlook
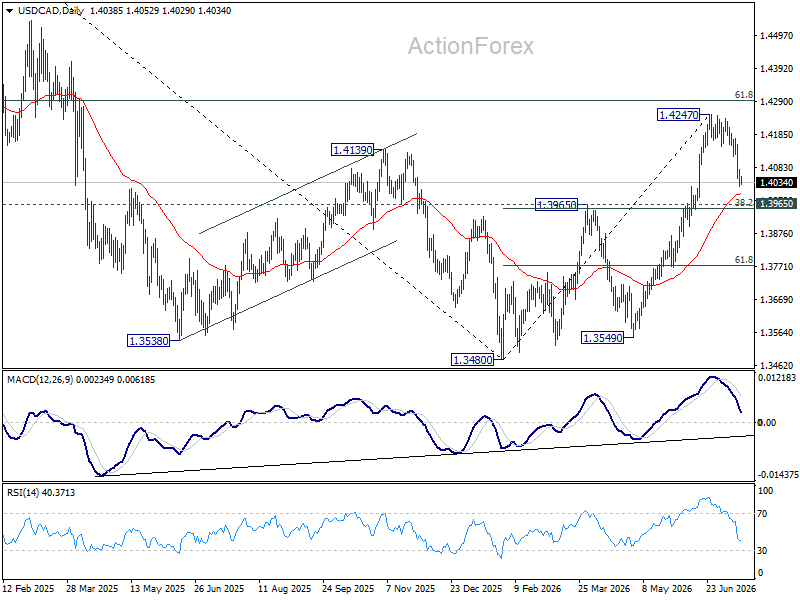
USD/CAD's fall from 1.4247 is seen as a correction to rally from 1.3480. Downside should be contained by 1.3965 cluster support (38.2% retracement of 1.3480 to 1.4247 at 1.3954 to bring rebound. On the upside, above 1.4159 minor resistance will bring retest of 1.4247 high. Firm break there will target 61.8% retracement of 1.4791 to 1.3480 at 1.4290.
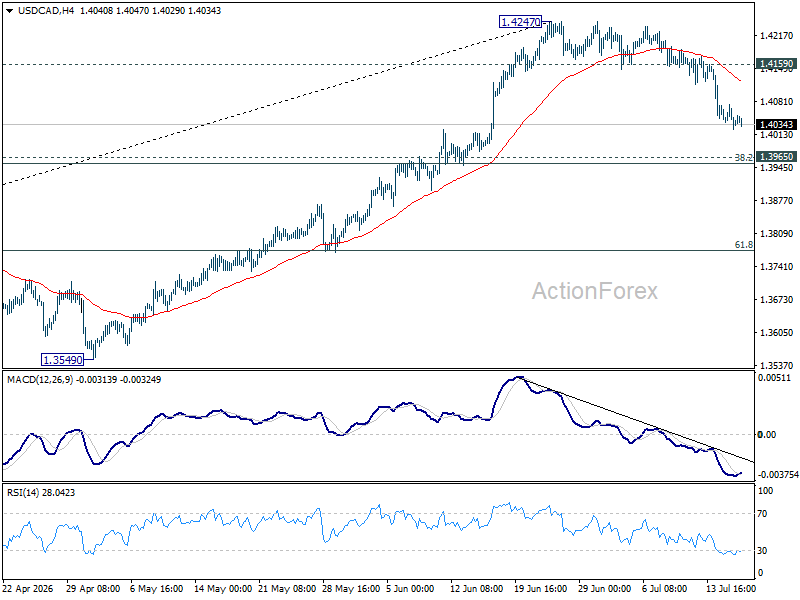
In the bigger picture, current development suggests that fall from 1.4791 has completed as a three wave correction to 1.3480. It's still early to judge if rise from there a corrective bounce, or resumption of the larger up trend from 1.2005 (2021 low). But in either case, retest of 1.4791 high should be seen next.
GBP/JPY Daily Outlook
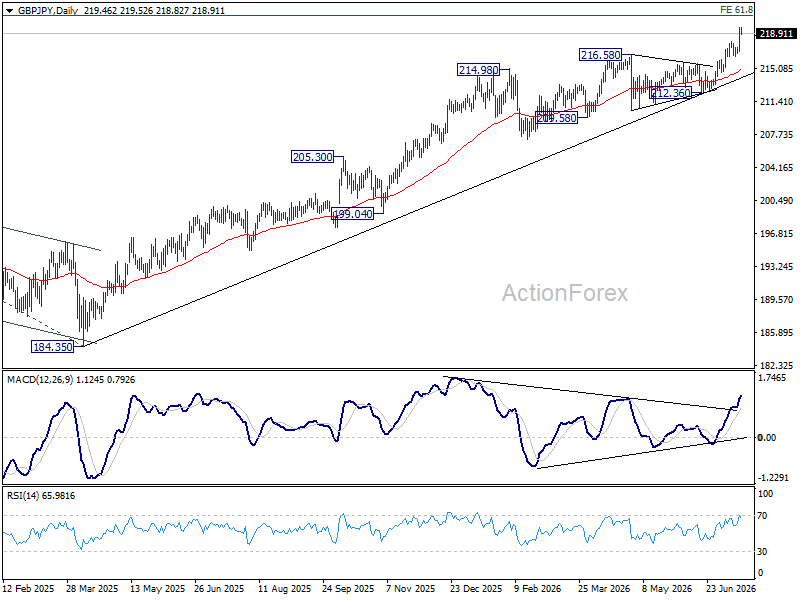
GBP/JPY's up trend resumed by breaking through 217.99 and intraday bias is back on the upside. Current rally should target 220.90 fibonacci projection level next. On the downside, below 217.99 minor support will turn intraday bias neutral again first.
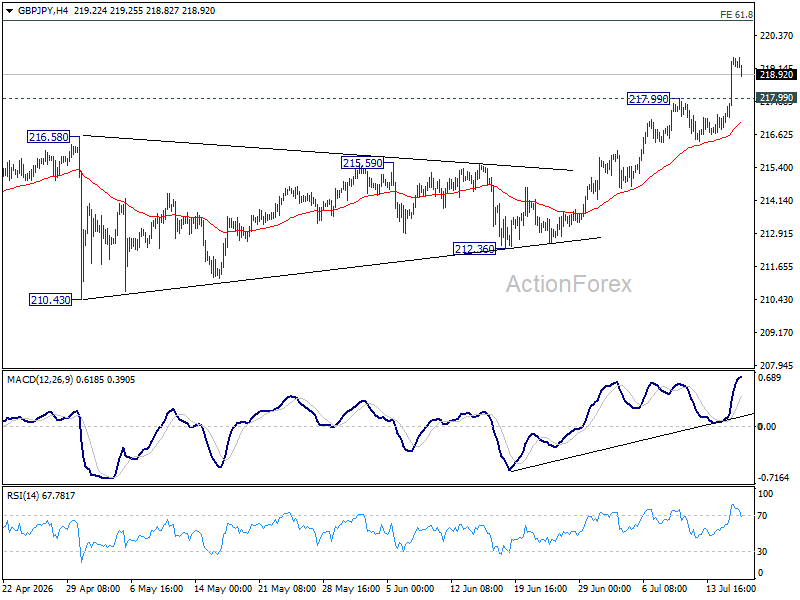
In the bigger picture, the long term up trend is in progress. Next target is 61.8% projection of 148.93 (2022 low) to 208.09 (2024 high) from 184.35 at 220.90. For now, outlook will remain bullish as long as 55 W EMA (now at 208.22) holds, in case of pullback.
EUR/JPY Daily Outlook
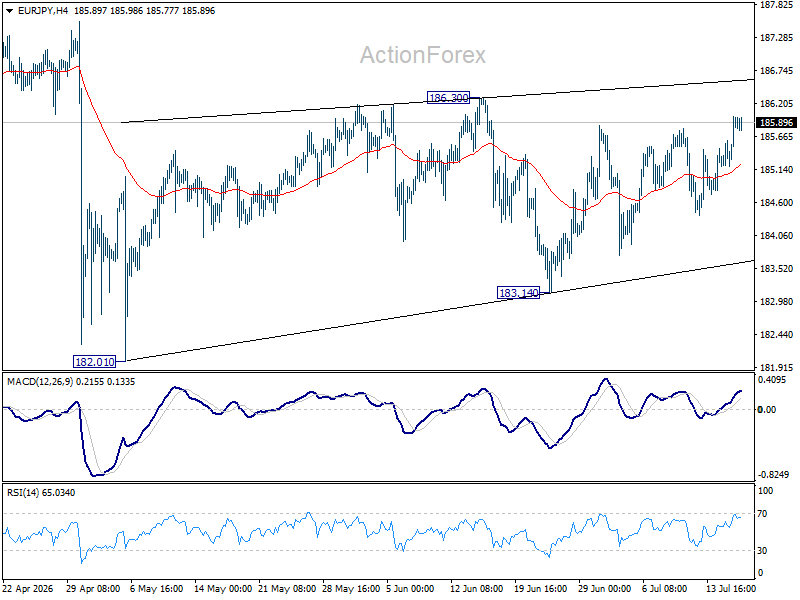
No change in EUR/JPY's outlook as sideway trading continues. Intraday bias remains neutral for the moment. While the price actions from 182.10 are looking corrective, stronger rebound cannot be ruled out. On the upside, firm break of 186.30 will resume the rebound from 182.10 towards 187.93 high. On the downside, break of 183.14 will bring deeper fall to retest 182.10.
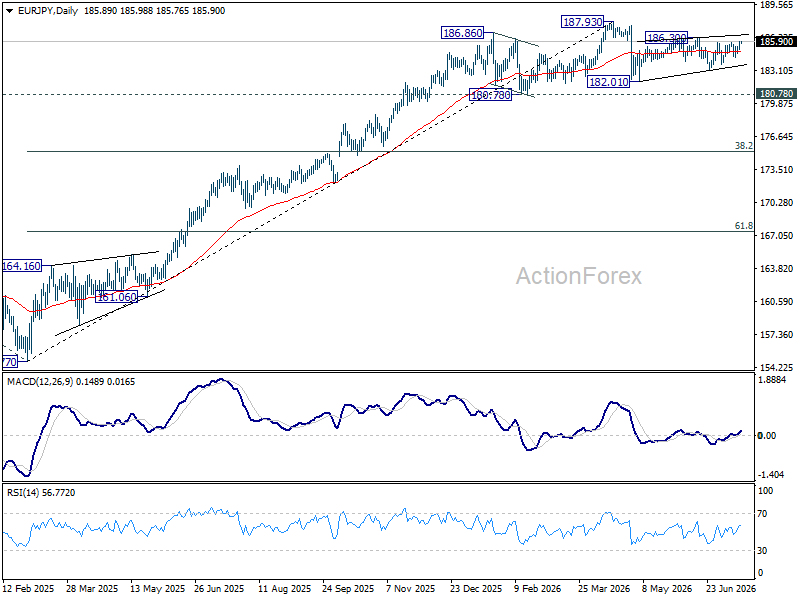
In the bigger picture, there is no sign of reversal yet. Uptrend from 114.42 (2020 low) is still expected to resume at a later stage to 78.6% projection of 124.37 (2022 low) to 175.41 (2025 high) from 154.77 at 194.88. However, sustained break of 55 W EMA (now at 179.93) will argue that it's already in a medium term down trend to 175.41 resistance turned support and below.
EUR/GBP Daily Outlook
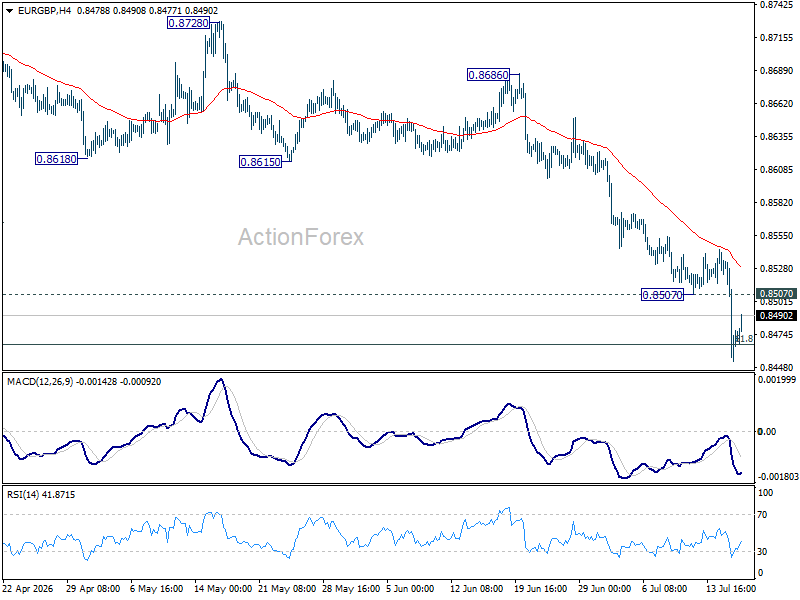
EUR/GBP's fall resumed after brief consolidations and intraday bias is back on the downside. 61.8% retracement of 0.8221 to 0.8863 at 0.8466 was already met. Sustained break there will pave the way to 0.8221 support. On the upside, above 0.8507 minor resistance will turn intraday bias neutral again first.
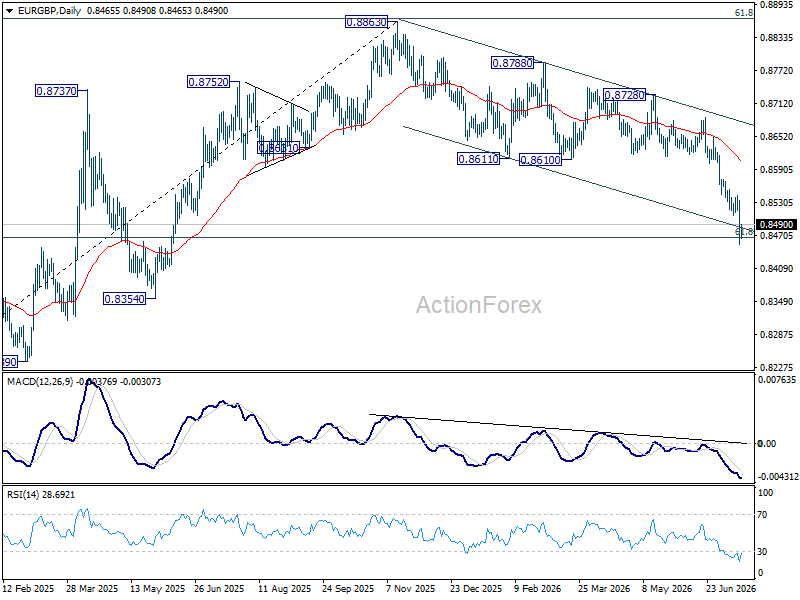
In the bigger picture, current development suggests that rise from 0.8221 (2024 low) has completed at 0.8863, just ahead of 38.2% retracement of 0.8221 (2024 low) to 0.8863 (2025 high) at 0.8618. Deeper fall would be seen back to 0.8201 (2022 low). For now, outlook will be neutral at best as long as 0.8863 hold.
EUR/AUD Daily Outlook
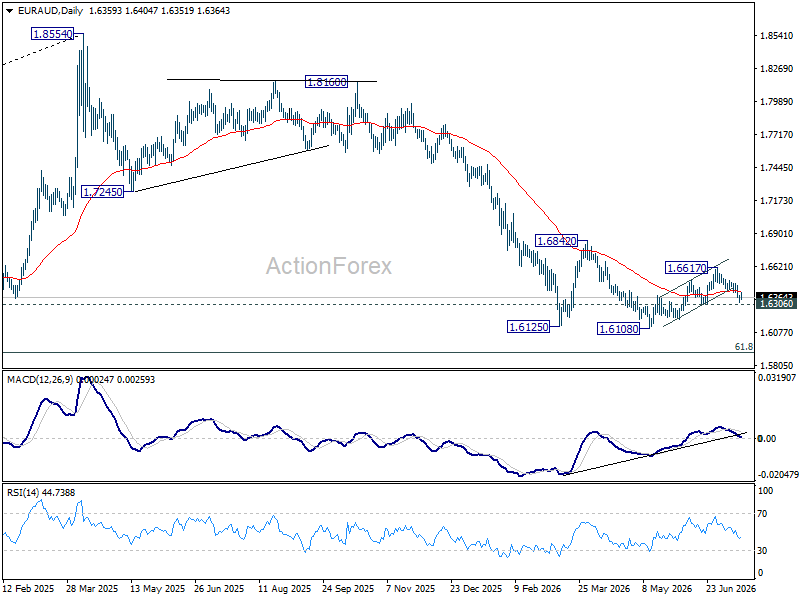
No change in EUR/AUD's outlook and focus stays on 1.6307 support. Firm break there will indicate that rebound from 1.6108 has completed at 1.6617. Deeper decline should the be seen to retest this low. On the upside, break of 1.6506 will turn bias back to the upside for 1.6617.
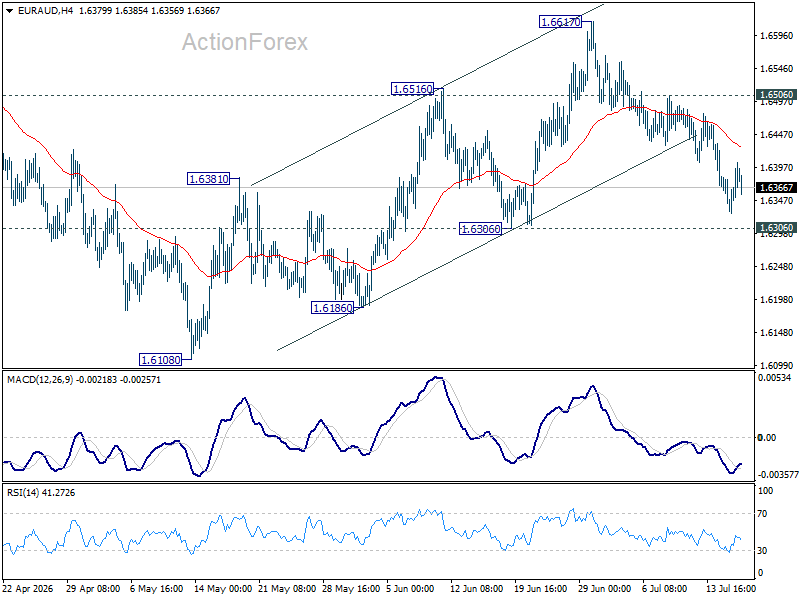
In the bigger picture, outlook will stay bearish as long as 1.6842 resistance holds. Fall from 1.8554 (2025 high) is expected to continue to 61.8% retracement of 1.4281 to 1.8554 at 1.5913. Decisive break there will pave the way back to 1.4281 (2022 low). However, firm break of 1.6842 should confirm medium term bottoming, and bring stronger rally.
EUR/CHF Daily Outlook
Intraday bias in EUR/CHF remains neutral for the moment, and more consolidations could be seen below 0.9278. Downside should be contained by 0.9210 support to bring another rise. Above 0.9278 will resume whole rally from 0.8979 to 100% projection of 0.8979 to 0.9264 from 0.9094 at 0.9379. However, break of 0.9210 will bring deeper fall back to 0.9176 support instead.
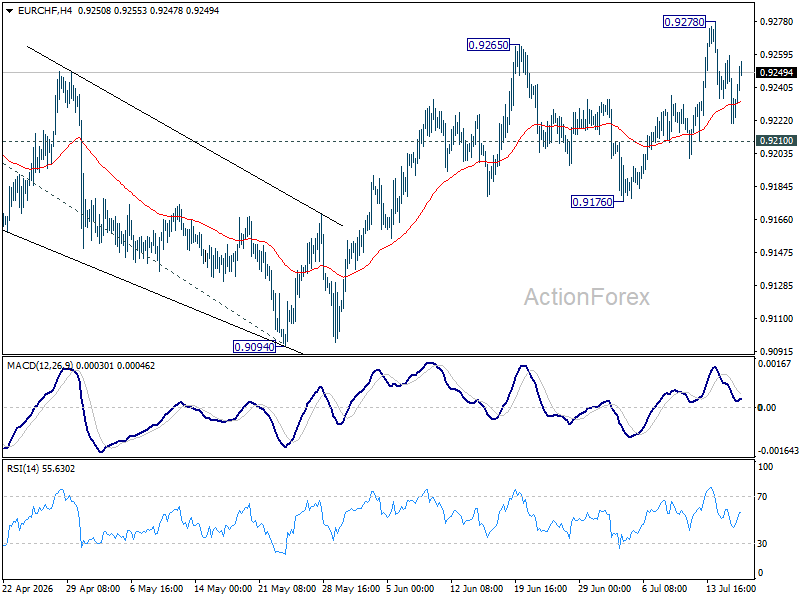
In the bigger picture, the break of medium term falling trend line resistance indicates that 0.8979 is already a medium term bottom. Considering bullish convergence condition in W MACD, rise from there should at least be reversing the fall from 0.9928, with prospect of developing into a medium term up trend. Firm break of 0.9394 resistance will add more credence to this case. For now risk will remain on the upside as long as 0.9094 support holds, in case of retreat.

Eurozone Trade Swings to Deficit as Imports Surge Despite Stable Exports
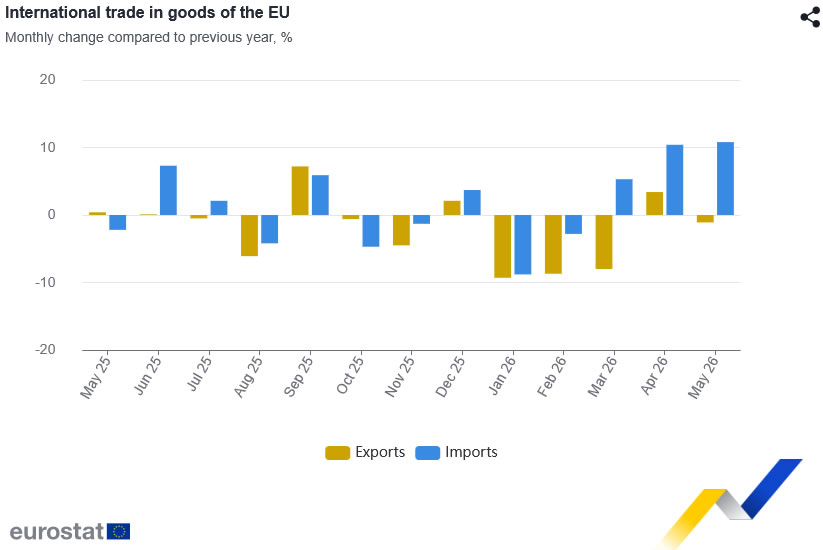
The Eurozone's trade balance swung into deficit in May as imports surged while exports remained broadly flat, highlighting the growing impact of higher import costs on the region's external accounts. Eurostat's preliminary estimates showed a EUR 7.8 billion deficit in goods trade with the rest of the world, a sharp reversal from the EUR 15.0 billion surplus recorded a year earlier. Exports edged up just 0.1% yoy to EUR 243.6 billion, while imports jumped 10.0% yoy to EUR 251.4 billion, leaving import growth far outpacing export gains.
The broader European Union recorded a similar deterioration. The EU posted a EUR 12.1 billion trade deficit in May, compared with a EUR 12.7 billion surplus in the same month last year. Extra-EU exports slipped -1.1% yoy to EUR 215.7 billion, while imports climbed 10.8% to EUR 227.8 billion.
Trade by partner also highlighted diverging trends for the EU. Exports to the United States fell -12.3% yoy, reducing the EU's trade surplus with its largest export market to EUR 7.9 billion from EUR 18.4 billion. By contrast, exports to Switzerland rose 14.8% and shipments to India increased 19.2%, partly offsetting weaker demand from the US, Japan and Türkiye. Imports strengthened across several major partners, including the United States, China, Norway and Brazil, reflecting robust demand as well as higher prices for imported commodities.
The figures suggest the deterioration in Europe's trade balance was driven more by the sharp rise in imports than by any broad collapse in exports. The resilience of outbound shipments despite a difficult global backdrop points to continued external demand for European goods, but that strength was more than offset by rising import bills.
Economic Data
| Indicator | Actual | Previous |
|---|---|---|
| Eurozone Trade Balance (May) | -EUR 7.8B | EUR 15.0B |
| Eurozone Exports YoY | 0.1% | — |
| Eurozone Imports YoY | 10.0% | — |
| EU Trade Balance (May) | -EUR 12.1B | EUR 12.7B |
| EU Extra-EU Exports YoY | -1.1% | — |
| EU Extra-EU Imports YoY | 10.8% | — |
Main Trading Partners (EU)
| Partner | Exports YoY | Imports YoY | Trade Balance (EUR Bn) |
|---|---|---|---|
| United States | -12.3% | 17.1% | 7.9 |
| China | -4.5% | 4.9% | -30.8 |
| United Kingdom | 2.1% | 12.1% | 15.4 |
| Switzerland | 14.8% | -1.5% | 7.4 |
| Norway | 10.5% | 30.4% | -4.2 |
| India | 19.2% | 5.3% | -1.9 |
| Japan | -22.3% | -8.4% | -0.1 |
Key Takeaways
- The Eurozone swung from a EUR 15.0B surplus to a EUR 7.8B trade deficit in May as imports rose much faster than exports.
- Eurozone exports were virtually flat (+0.1% yoy), suggesting external demand remained relatively resilient despite a challenging global backdrop.
- Imports surged 10.0% yoy, indicating higher import demand and rising import prices were the main drivers of the deterioration in the trade balance.
- The broader EU also moved into deficit, with imports rising 10.8% yoy while extra-EU exports fell 1.1% yoy.
- Trade with the United States weakened noticeably, with EU exports falling 12.3% yoy, reducing the bilateral surplus to EUR 7.9B from EUR 18.4B a year earlier.
- Exports to Switzerland (+14.8%) and India (+19.2%) provided some offset, while stronger imports from the US (+17.1%), China (+4.9%), and Norway (+30.4%) widened the overall import bill.
- The figures suggest the deterioration in Europe's external balance was driven more by surging imports than collapsing exports, leaving the trade outlook vulnerable if energy prices remain elevated.
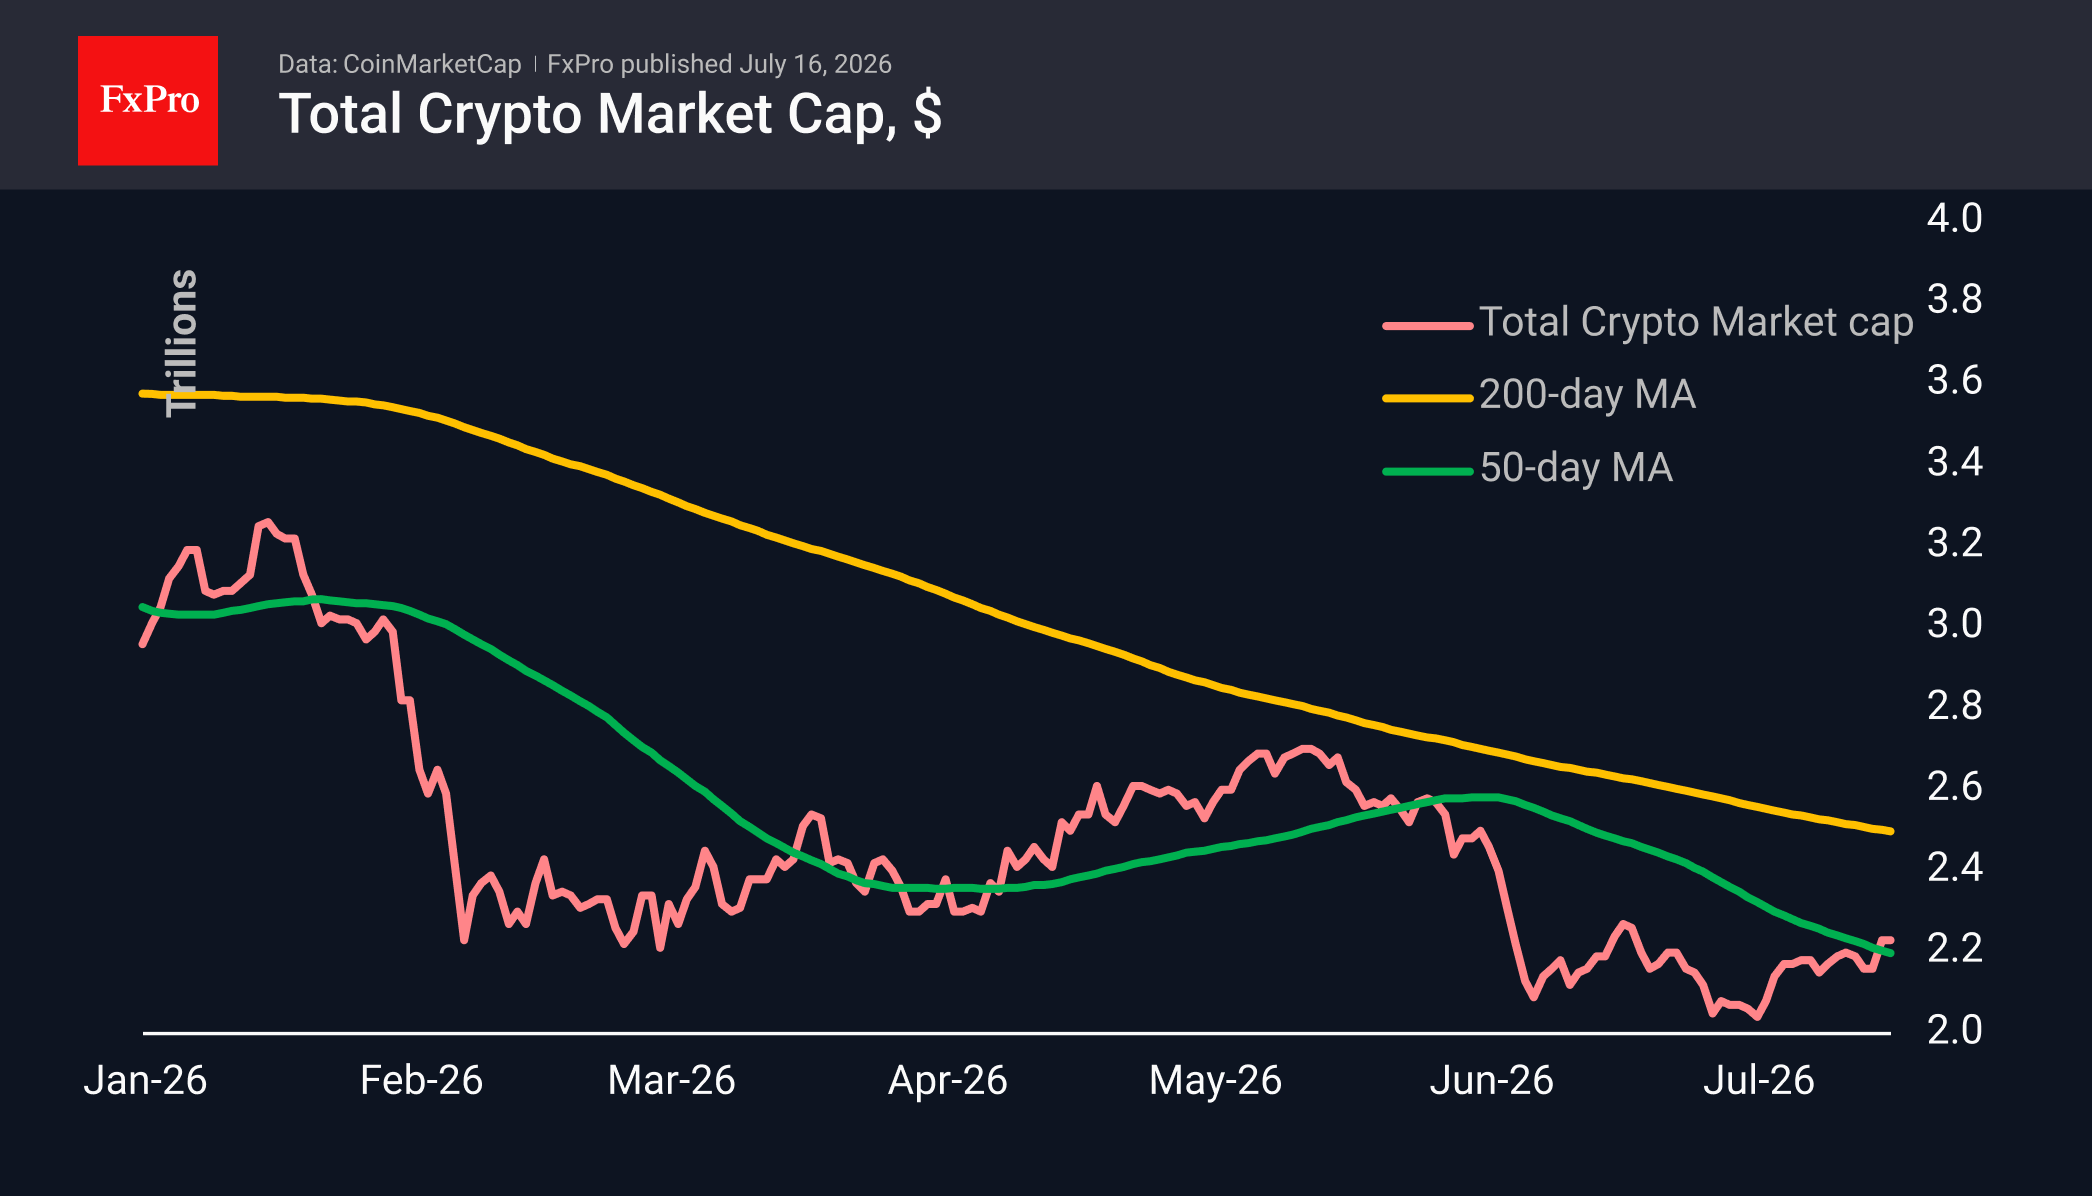
Crypto Market at $2.23T: a Bullish Pause Above the 50-Day MA
Market Overview
The crypto market has stabilised at levels around $2.23T, remaining there for the second day running. The market is in a fairly bullish consolidation above the area of previous local highs and the 50-day moving average, signalling a smooth transition to a bull market: without dizzying rallies, but with a steady upward trend. The major cryptocurrencies are generally holding their ground, while there is a greater tendency towards profit-taking among the weaker altcoins. The top gainers over the past 24 hours were Theta Network (+2.3%), Stellar (+1.9%) and Zcash (+1.8%). The biggest fallers were Bitcoin Cash (-5.6%), Aave (-3.1%) and Polkadot (-2%).
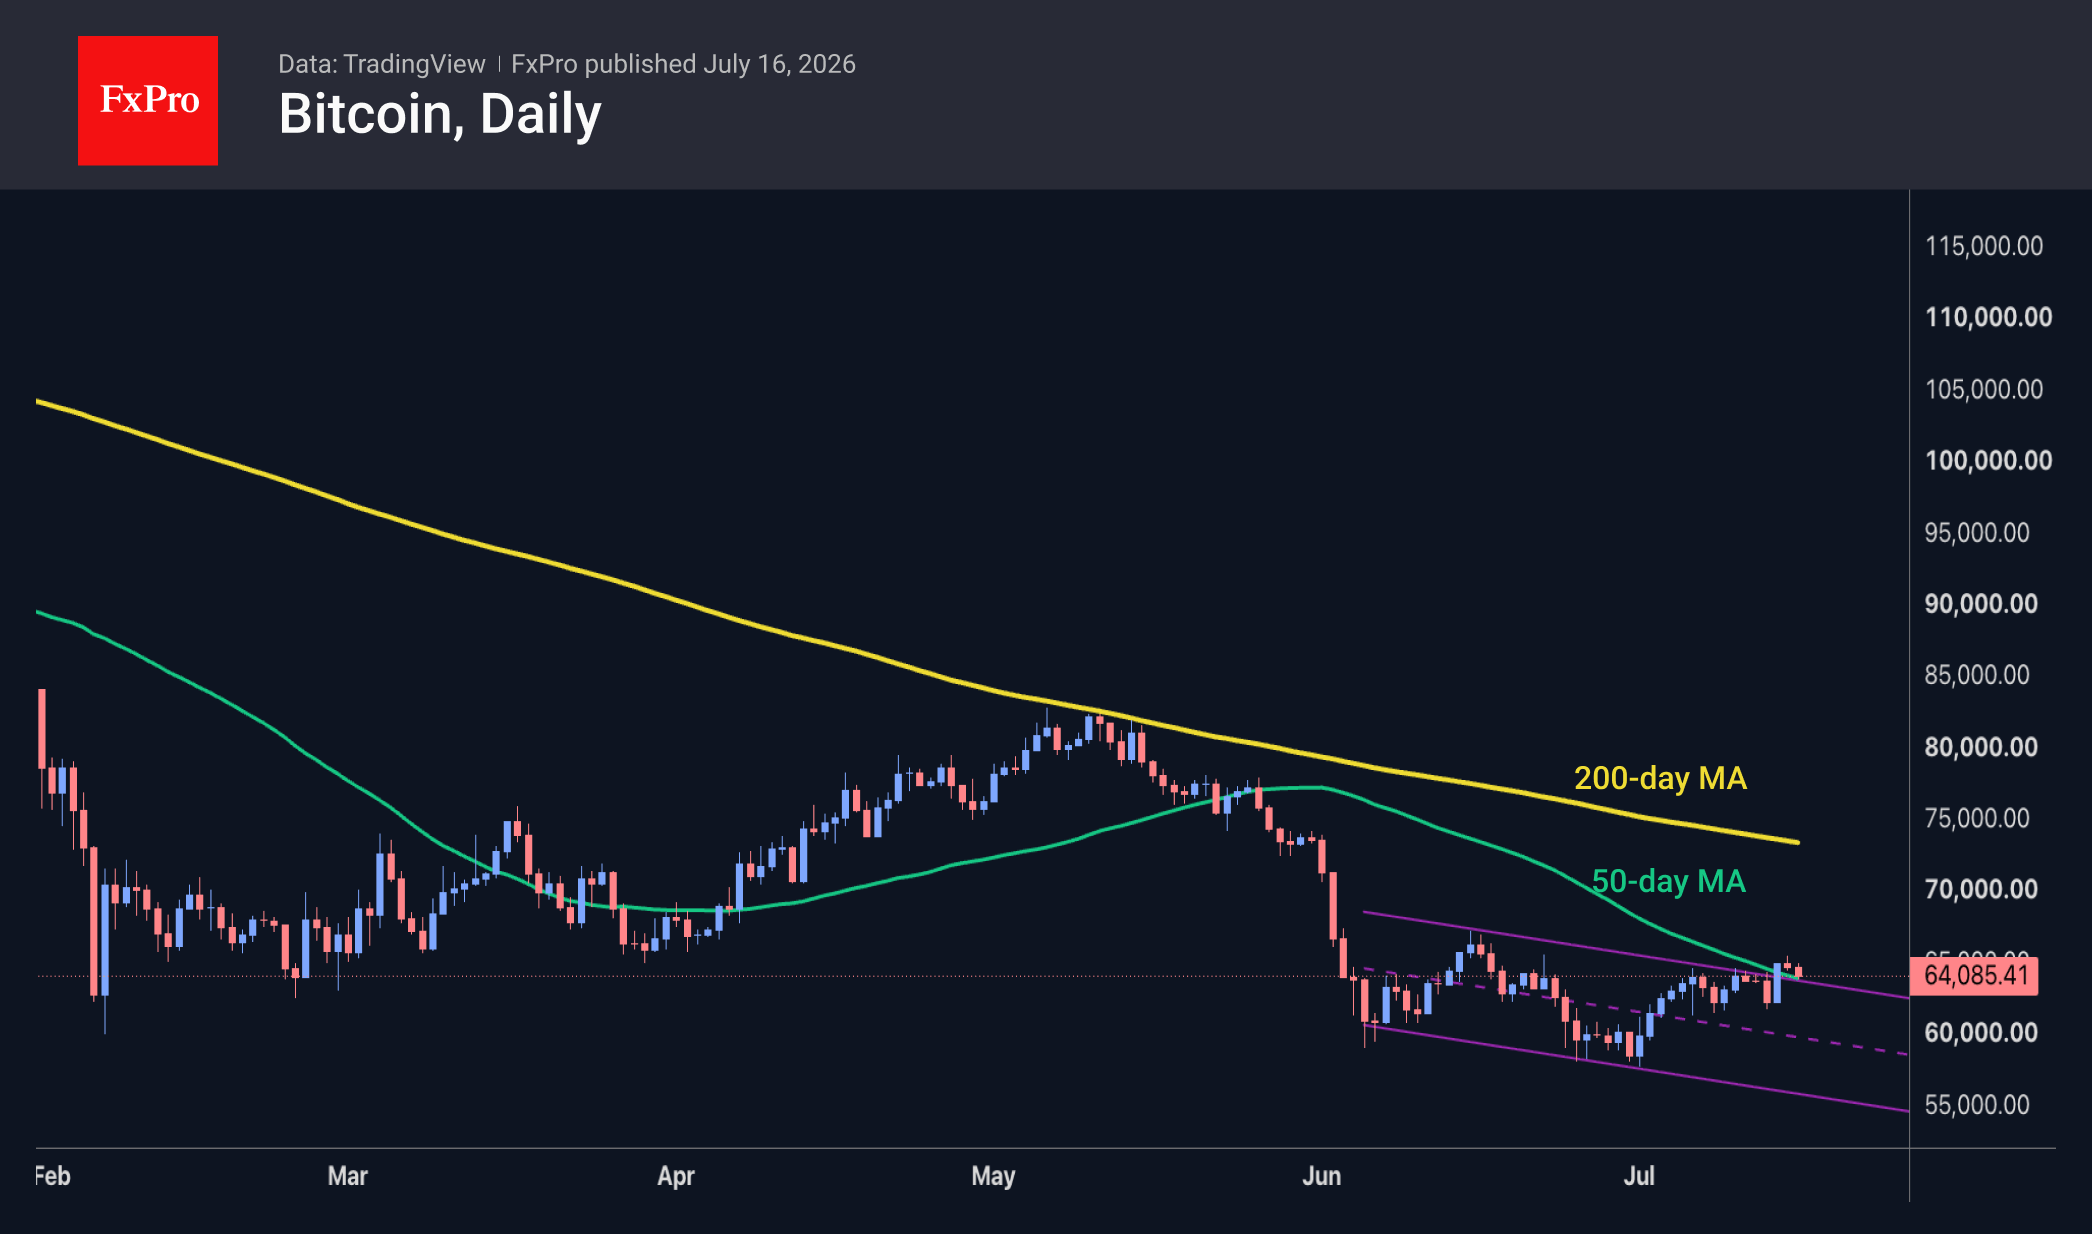
Bitcoin has settled down, consolidating above $64K and the 50-day moving average, but lacks the momentum to break through $65K. This lull is not yet a cause for concern. The market is likely geared towards cautious buying of the leading cryptocurrency at current levels, forming a bottom that could hold for many months or even years to come. As always, there is a risk of a sudden sell-off amid financial market shocks, which could send BTC or global stock indices into a tailspin, but waiting for such moments is a thankless task. In such conditions, buying in a quiet market at less than half of peak levels looks like a perfectly reasonable tactic for the coming days or weeks.
News Background
Current on-chain data for Bitcoin suggests there are no signs of a global panic sell-off. BTC reserves on exchanges continue to decline, reflecting long-term accumulation by ETFs and institutional investors. Whale activity remains high and warrants monitoring in the coming weeks, according to XWIN Research Japan.
Ripple continues to reduce the supply of its dollar-pegged stablecoin, RLUSD. The company has burned a further 10 million RLUSD, reducing the supply by approximately 20% compared to its peak in May.
The largest US depository, DTCC, which holds securities worth over $114 trillion, is beginning to test the tokenisation of shares and US Treasury bonds. Around 40 major financial institutions are participating in the project, including JPMorgan, Goldman Sachs, BlackRock, Vanguard and the NYSE.
Japan has recognised crypto-assets as financial instruments. The country’s parliament has passed amendments to the Financial Instruments and Exchange Act, which bring cryptocurrency regulation under investment legislation. The main provisions will come into force within a year of publication.
In Pakistan, religious scholars have ruled that cryptocurrency purchases are impermissible under Sharia law. The fatwa contradicts Pakistan’s plans to introduce cryptocurrencies. Earlier this year, the country’s authorities passed a law on digital assets.
The FxPro Analyst Team