Sample Category Title
BoC Holds Rates as Broader Recovery Offsets Rising Oil Risks
The Bank of Canada left its overnight rate unchanged at 2.25%, extending its pause for a sixth consecutive meeting, but the accompanying statement struck a more constructive tone on the domestic economy. While policymakers continued to emphasize uncertainty stemming from the Middle East conflict and US trade policy, they also acknowledged that Canada's recovery is becoming more broadly based. Combined with a modestly upgraded near-term growth outlook, the message suggests the Bank sees current policy as sufficiently restrictive while remaining alert to renewed inflation risks from higher energy prices.
The Bank noted that financial conditions have eased since April and pointed to clearer signs that economic growth has resumed in the second quarter. Consumer spending remains solid, housing activity appears to be stabilizing, export growth has resumed, and business investment is expected to strengthen, supported in part by the oil and gas sector. Importantly, policymakers said "sources of economic growth appear to be broadening," indicating the recovery is becoming less reliant on temporary factors.
The updated Monetary Policy Report estimates annualized GDP growth of 2.5% in the second quarter, stronger than projected in April, although the Bank still expects average growth of just 0.7% for 2026 before accelerating to 1.8% in both 2027 and 2028 as excess capacity is gradually absorbed.
Inflation remains the key challenge. The Bank expects CPI to stay elevated in the near term following the rise to 3.2% in May, largely reflecting higher gasoline prices linked to the Middle East conflict. However, excluding gasoline, inflation was 2.2% and measures of core inflation remained close to target.
Policymakers continue to believe inflation will gradually return to around 2% in early 2027, provided oil prices stabilize. That assumption has already become more uncertain as Brent crude has climbed back above $85 following renewed US-Iran hostilities, meaning the Bank's updated projections face an immediate test.
Bank of Canada MPR Projection Summary
| Item | 2026 | 2027 | 2028 |
|---|---|---|---|
| GDP Growth | 0.7% (1.2%) | 1.8% (1.6%) | 1.8% (1.7%) |
| CPI Inflation | 2.5% (2.3%) | 2.0% (2.1%) | 2.1% (2.0%) |
Market Takeaways
- 2026 GDP was revised down to 0.7% from 1.2%, reflecting the earlier drag from tariffs and uncertainty.
- 2027 and 2028 GDP forecasts were upgraded to 1.8%, signalling greater confidence in a sustained recovery.
- 2026 CPI was revised up to 2.5% from 2.3%, largely due to higher energy prices.
- Inflation is still projected to return close to target over the medium term, indicating the BoC continues to view the latest oil shock as temporary rather than persistent.
- Domestic demand remains the primary engine of growth, while exports recover and business investment gradually improves.
Bank of Canada maintains the policy rate at 2¼%
The Bank of Canada today held its target for the overnight rate at 2.25%, with the Bank Rate at 2.5% and the deposit rate at 2.20%.
Canada’s economy is showing signs of improvement. Growth is picking up and inflation is projected to ease gradually from its recent spike. There are still important risks and uncertainties related to the war in the Middle East and US trade policy.
Since the April Monetary Policy Report (MPR), global economic prospects have been dented by higher oil prices stemming from the Middle East conflict. At the same time, the build-out of artificial intelligence (AI) is supporting economic activity in a growing number of countries. Oil prices are still lower than their peak in April but the situation in the Middle East remains volatile. The path for global inflation is highly dependent on how the conflict unfolds.
The US economy is growing at about 2½%, mostly because of strong consumption and booming AI investment. China’s economy is expanding solidly thanks to robust exports. Economic activity in the euro area has been weighed down by high energy prices, but is expected to strengthen in the second half of the year if energy prices come down as anticipated.
The Bank projects global GDP growth will slow to 2¾% in 2026, mostly because of the effects of the Middle East conflict, and recover to around 3¼% in 2027 and 2028.
Financial conditions in Canada have eased since April and global equity markets have been buoyant. US bond yields have risen, while those in Canada are little changed. This differential has contributed to the depreciation of the Canadian dollar.
Canada’s GDP data over the past year was choppy and growth stalled as the economy adjusted to new tariffs, high uncertainty and slower population growth. Labour market conditions have remained soft, reflecting ongoing economic slack. The unemployment rate was 6.5% in June and has hovered in a range of 6½%-7% since the end of 2024. There are clear signs that economic growth has resumed in the second quarter, with growth estimated at 2½%. While this largely reflects the unwinding of temporary factors, sources of economic growth appear to be broadening.
Recent indicators point to continued solid consumer spending. Housing activity has been weak but looks to be stabilizing. Export growth has resumed and is expected to continue to strengthen, albeit on a lower path. Business investment is projected to pick up modestly, boosted in the near term by the oil and gas sector. Although the Canada-US-Mexico Agreement is now subject to annual reviews, more businesses report they are finding ways to navigate through the uncertainty. Government spending also contributes to higher economic activity over the projection.
Following GDP growth of 0.7% in 2026, the Bank projects the economy will grow by 1.8% in both 2027 and 2028. As the recovery proceeds, economic slack will be gradually absorbed.
CPI inflation rose further to 3.2% in May, mainly because of higher gasoline prices linked to the war in the Middle East. Excluding gasoline, inflation was 2.2% and measures of core inflation remained close to 2%. Near-term inflation expectations are sensitive to changes in gasoline prices but longer-term inflation expectations remain well anchored. War-related cost pressures are still working their way through some consumer prices but are being offset by downward pressure on other prices from continued economic slack. CPI inflation is expected to stay elevated in June and then ease gradually in the coming months, returning to around 2% in early 2027, although this forecast is dependent on the path for oil and gasoline prices. Inflation is forecast to average around 2% in 2027 and 2028, albeit with some monthly fluctuations because of base-year effects.
Governing Council judges the current policy rate remains appropriate to sustain the economic recovery and bring inflation back to the 2% target, in line with the MPR projections. Uncertainty is still high. Governing Council will continue to assess the strength of the Canadian economy and the outlook for inflation, and is prepared to adjust monetary policy as needed. The Bank is committed to maintaining Canadians’ confidence in price stability through this period of global upheaval.
Information note
The next scheduled date for announcing the overnight rate target is September 2, 2026. The Bank’s next MPR will be released on October 28, 2026.
Soft US Inflation Gives Fed Time While Oil Surge Puts ECB Back Under Pressure
The Federal Reserve has been handed valuable breathing room by two consecutive downside inflation surprises, but the same cannot be said for other major central banks. Softer-than-expected US CPI and PPI confirmed that inflation pressures eased materially through the end of the second quarter, allowing policymakers to remain patient rather than rush into another rate increase. Yet that benign inflation picture is already being challenged by renewed escalation in the Middle East, with Brent crude holding around $85 after fresh US military action against Iran revived concerns over global energy supplies.
June's inflation data painted a consistent picture of cooling price pressures before oil prices rebounded. Consumer inflation undershot expectations, while producer prices unexpectedly fell -0.3% on the month. The weakness was concentrated in final demand goods, which declined 1.4%—their largest monthly fall since July 2022—as energy prices dropped sharply. Taken together, the reports suggest the Fed now has considerable room to maintain its data-dependent approach. Markets have largely abandoned expectations of an imminent rate hike, with attention shifting instead to whether the latest oil rally proves temporary or develops into a more persistent inflation shock over coming months.
That question has become increasingly difficult to answer after the conflict between the US and Iran intensified again. US Central Command launched another wave of strikes on Iranian military targets on Wednesday morning after President Donald Trump warned that attacks would become progressively heavier unless Tehran cooperates in peace negotiations. The stated objective was to further degrade Iranian capabilities used to threaten commercial shipping through the Strait of Hormuz. Trump's remarks also suggested military operations could extend into next week without diplomatic progress, reinforcing expectations that geopolitical risks will remain elevated. Although Brent has climbed sharply, its gains have been measured rather than disorderly, indicating markets still expect both sides to keep the conflict within manageable limits rather than allow a full-scale regional war.
That distinction is particularly important for Europe. With the ECB meeting just days away, policymakers are once again confronting the risk that higher energy prices could delay the return of inflation toward target. Bundesbank President Joachim Nagel warned today that the renewed conflict demonstrates how "the situation remains extremely volatile" and reiterated that monetary policy should "react with caution, but act decisively if necessary."
Currency markets increasingly reflect these diverging policy dynamics rather than classic risk sentiment. New Zealand Dollar continues to outperform after hawkish RBNZ commentary, Canadian Dollar is benefiting from stronger oil prices and the prospect of a firmer BoC, while Dollar, Yen and Swiss Franc lag despite escalating geopolitical tensions. The message is that softer US inflation has bought the Fed time, but higher oil prices are beginning to tighten the policy constraints elsewhere.
Silver Risks Falling to $50 as Dollar Holds Firm and Solar Demand Shifts
Silver's failure to rally after a softer-than-expected US CPI report suggests the market is facing more than just a temporary macro headwind. A resilient US Dollar, muted buying interest and the emergence of copper substitution in solar manufacturing are combining to weaken the outlook, leaving $50 increasingly in focus if key support gives way. Read more.
USD/CAD to Test Key Support Around 1.4 as Three Tailwinds Boost Loonie Ahead of BoC
The Canadian Dollar is drawing support from three independent macro drivers ahead of the Bank of Canada's policy decision: softer-than-expected US inflation has weakened the Dollar, Brent crude above $86 is improving Canada's terms of trade, and markets are increasingly pricing a more hawkish BoC outlook. Together, they have pushed USD/CAD toward the key 1.40 support zone, where today's policy communication could determine the next major move. Read More.
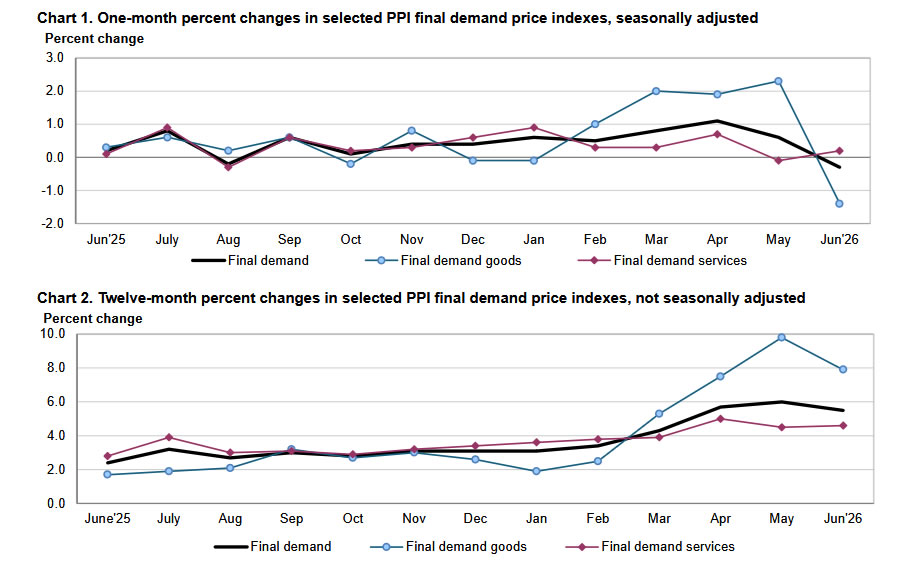
US PPI Misses Forecasts as Energy Prices Drive Biggest Goods Decline Since 2022
US producer prices unexpectedly fell 0.3% in June, reinforcing the softer inflation message from Tuesday's CPI report. The decline was driven by a 6.4% drop in energy prices, including a 12.0% plunge in gasoline, producing the largest fall in final demand goods since July 2022. Together, the reports suggest inflation cooled materially before the latest rebound in oil prices. Read More.
Eurozone Industrial Production Unexpectedly Falls -0.2% MoM as Manufacturing Recovery Stalls
Eurozone industrial production fell -0.2% in May, missing expectations for growth and signalling that the region's manufacturing recovery remains uneven. While energy output rose 2.2% and capital goods production increased 0.3%, declines in intermediate goods and durable consumer goods pulled overall factory output lower. Read More.
China's Economy Slows to 4.3%, Weakest Growth Since 2022 Despite June Data Beat
China's economy expanded 4.3% year-on-year in the second quarter, missing expectations and marking its weakest growth since 2022. While industrial production accelerated to 5.3% and retail sales returned to growth at 1.0% in June, the recovery remained uneven as fixed asset investment deteriorated and property investment fell 18% in the first half of the year. Read More.
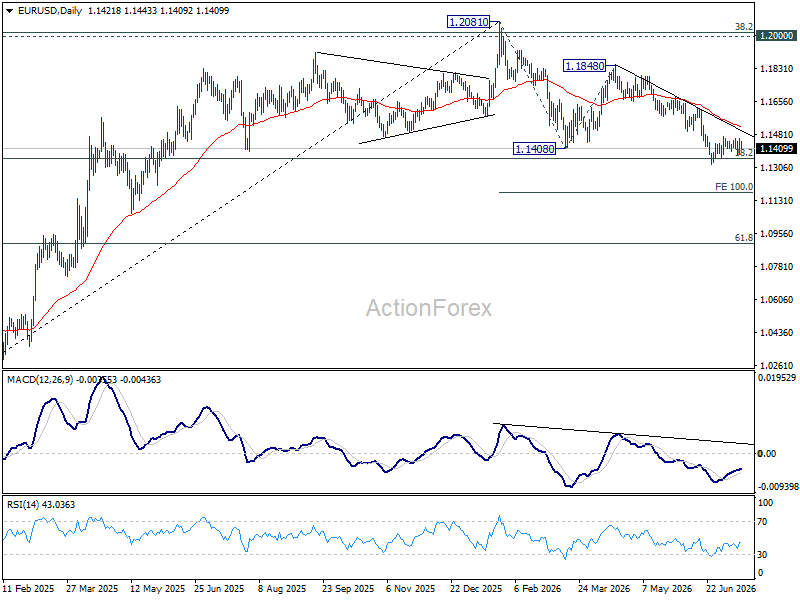
EUR/USD Daily Outlook
Intraday bias in EUR/USD remains neutral for the moment as consolidations continue above 1.1323. With 1.1499 support turned resistance intact, further decline is expected. On the downside, break of 1.1323 will resume the fall from 1.2081 to 100% projection of 1.2081 to 1.1408 from 1.1848 at 1.1175. However, decisive break of 1.1499 will turn bias back to the upside for 1.1621 resistance.
In the bigger picture, focus is back on 38.2% retracement of 1.0176 to 1.2081 at 1.1353. Decisive break there will revive the case of medium term bearish trend reversal after rejection by 1.2 key cluster resistance level. Further fall should be seen to 61.8% retracement at 1.0904. Nevertheless, strong rebound from 1.1353, followed by break of 1.1621 resistance, will retain medium term bullishness.
US PPI Misses Forecasts as Energy Prices Drive Biggest Goods Decline Since 2022
US producer prices unexpectedly declined in June, extending the disinflationary message delivered by Tuesday's softer consumer inflation report. The Producer Price Index fell -0.3% mom, compared with expectations for a 0.2% increase, while annual producer inflation slowed from a revised 6.0% yoy to 5.5% yoy. The downside surprise suggests pipeline inflation eased more sharply than markets anticipated before the latest resurgence in oil prices, reinforcing expectations that the Federal Reserve has additional time to assess inflation risks.
The weakness was concentrated in goods prices, which fell -1.4% mom, the largest monthly decline since July 2022. Energy prices plunged -6.4%, led by a -12.0% drop in gasoline prices, accounting for nearly two-thirds of the decline in final demand goods. Food prices also slipped -0.6%. By contrast, core goods excluding food and energy still increased 0.2%, while final demand services rose 0.2%, reflecting firmer retail margins and selected business services.
The Fed's preferred measure of underlying producer inflation, final demand less foods, energy and trade services, edged up just 0.1% after surging 0.8% in May, with the annual rate holding at 5.1%.
Together with Tuesday's CPI report, the latest PPI figures strengthen the case that inflation pressures moderated significantly through June before the recent jump in crude oil prices. That leaves policymakers with greater flexibility in the near term.
Economic Data
| Indicator | Actual | Expected | Previous |
|---|---|---|---|
| PPI (MoM) | -0.3% | 0.2% | 0.6% (rev.) |
| PPI (YoY) | 5.5% | 6.2% | 6.0% (rev.) |
| Final Demand Goods (MoM) | -1.4% | — | 2.3% |
| Final Demand Services (MoM) | 0.2% | — | -0.1% |
| Final Demand Less Food, Energy & Trade (MoM) | 0.1% | — | 0.8% |
| Final Demand Less Food, Energy & Trade (YoY) | 5.1% | — | 5.1% |
| Energy Goods (MoM) | -6.4% | — | 8.4% |
| Food Goods (MoM) | -0.6% | — | 0.5% |
| Goods Less Food & Energy (MoM) | 0.2% | — | 0.7% |
Market Takeaways
- Headline PPI unexpectedly fell, reinforcing the softer inflation message from June CPI.
- Producer inflation slowed to 5.5% yoy, below expectations, while monthly prices posted their first decline since early 2025.
- Energy prices remained the dominant driver, with gasoline tumbling 12.0%, producing the largest decline in final demand goods since July 2022.
- Core pipeline inflation was more subdued than May, with the Fed's preferred underlying producer price gauge rising just 0.1% mom.
- The combined CPI and PPI reports suggest inflation pressures eased materially through June, giving the Fed greater flexibility despite the recent rebound in crude oil prices.
- Markets will now focus on whether Brent's surge above $85 feeds into producer prices in coming months, reversing June's disinflation trend.
EUR/USD Daily Outlook
Intraday bias in EUR/USD remains neutral for the moment as consolidations continue above 1.1323. With 1.1499 support turned resistance intact, further decline is expected. On the downside, break of 1.1323 will resume the fall from 1.2081 to 100% projection of 1.2081 to 1.1408 from 1.1848 at 1.1175. However, decisive break of 1.1499 will turn bias back to the upside for 1.1621 resistance.
In the bigger picture, focus is back on 38.2% retracement of 1.0176 to 1.2081 at 1.1353. Decisive break there will revive the case of medium term bearish trend reversal after rejection by 1.2 key cluster resistance level. Further fall should be seen to 61.8% retracement at 1.0904. Nevertheless, strong rebound from 1.1353, followed by break of 1.1621 resistance, will retain medium term bullishness.
USD/JPY Daily Outlook
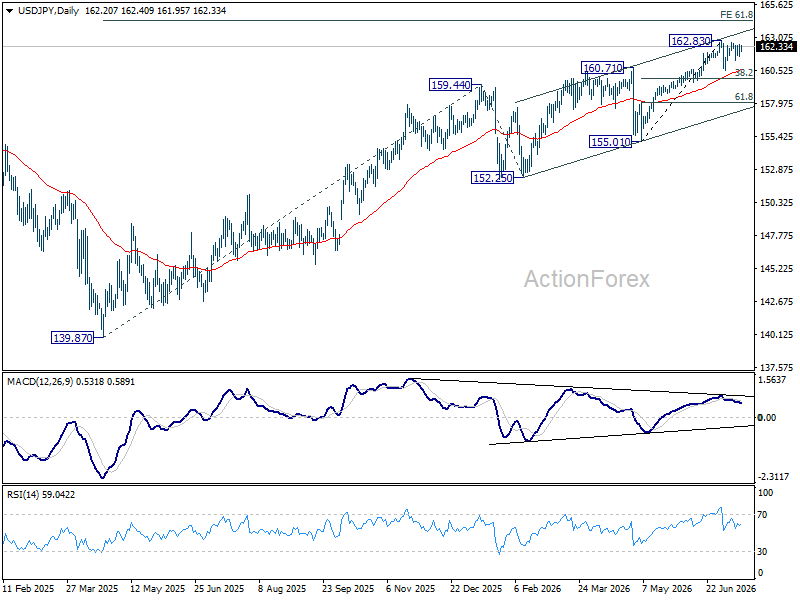
USD/JPY is extending consolidations below 162.83 and intraday bias remains neutral. In case of another fall, downside should be contained by 38.2% retracement of 155.01 to 162.83 at 159.84. On the upside, firm break of 162.83 will resume larger up trend to 164.34 projection level.
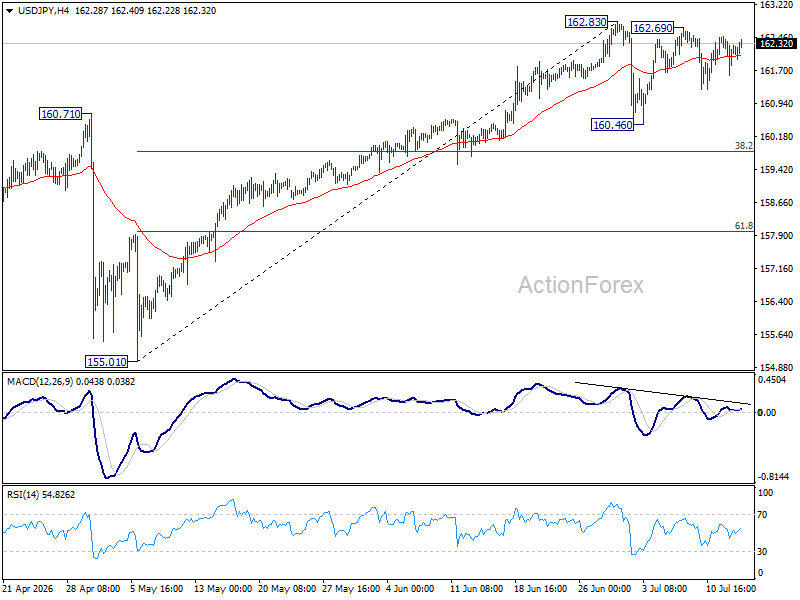
In the bigger picture, rise from 139.87 (2025 low) is seen as another rising leg of the long term up trend. Next target is 61.8% projection of 139.87 to 159.44 from 152.25 at 164.34. For now, outlook will remain bullish as long as 155.01 support holds, even in case of deep pullback.
GBP/USD Daily Outlook
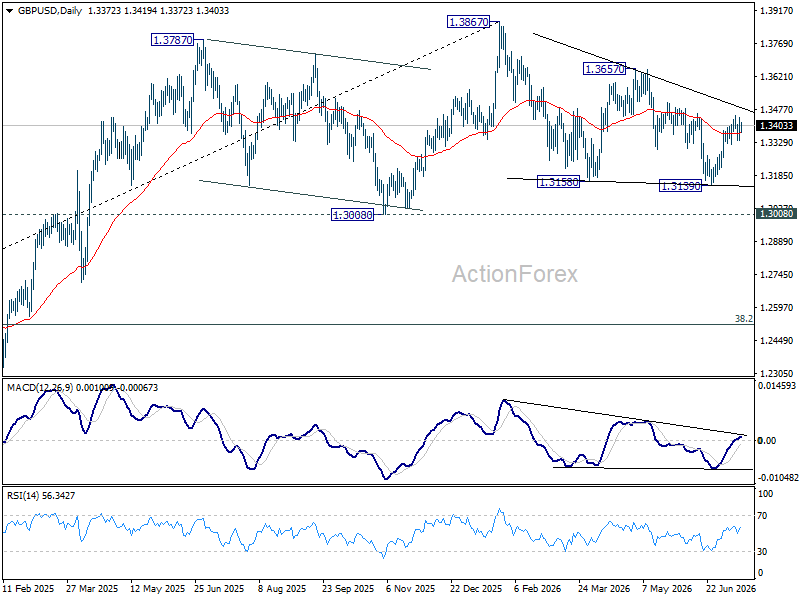
GBP/USD is staying in consolidations below 1.3451 and intraday bias stays neutral. On the upside, firm break of 1.3459 will argue that whole correction from 1.3867 has completed, and target 1.3657 resistance for confirmation. On the downside, break of 1.3451 will turn bias back to the downside for 1.3139 support instead.
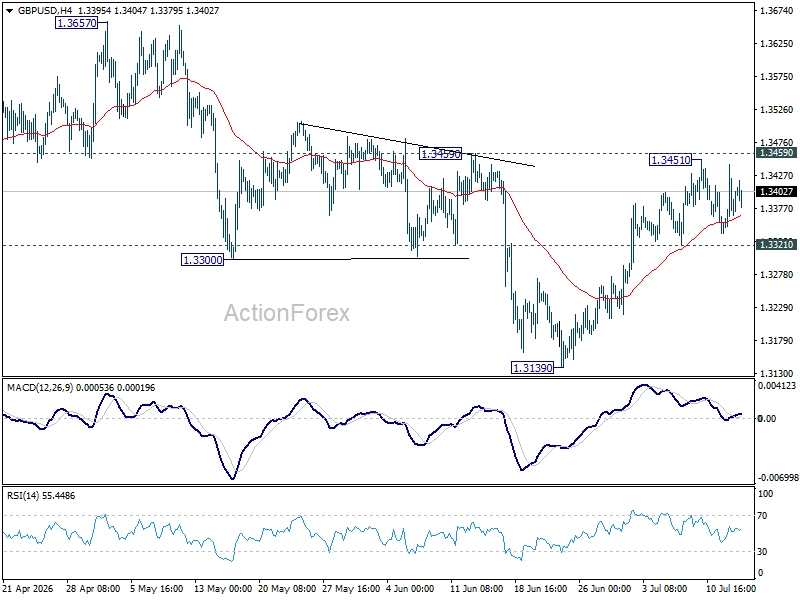
In the bigger picture, price actions from 1.3867 are a corrective pattern within the broader up trend from 1.0351 (2022 low). With 1.3008 support intact, medium term bullishness is maintained and break of 1.3867 is in favor for a later stage, towards 1.4248 key resistance (2021 high). However, firm break of 1.3008 will at least bring deeper fall to 38.2% retracement of 1.0351 to 1.3867 at 1.2524, with increased risk of bearish reversal.
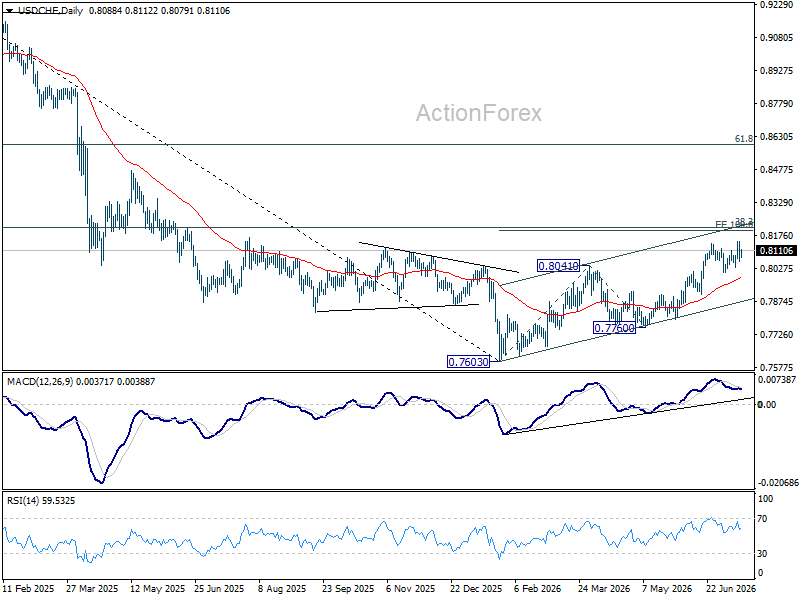
USD/CHF Daily Outlook
USD/CHF retreated sharply after edging higher to 0.8150, but stays above 0.8029 support. Intraday bias is turned neutral for some consolidations, and further rally is expected. Break of 0.8150 will resume the rise from 0.7660 and target 100% projection 0.7603 to 0.8041 from 0.7600 at 0.8198.
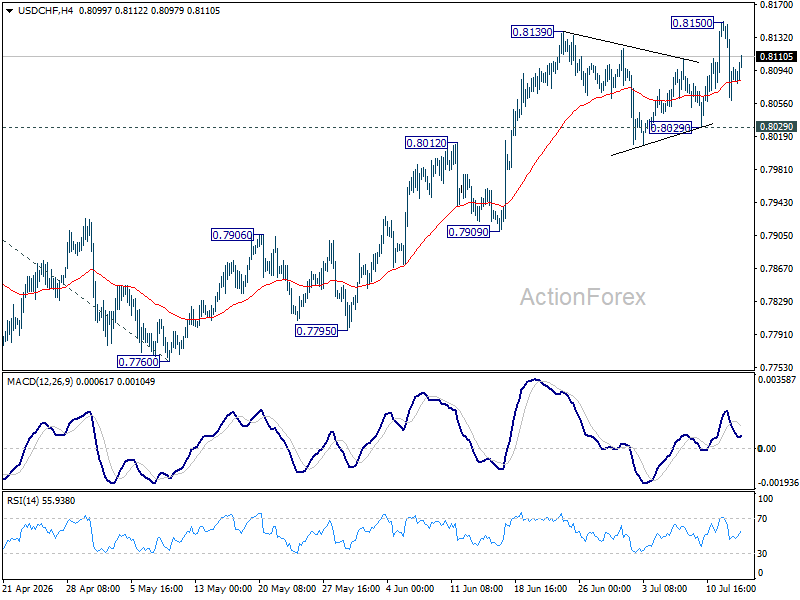
In the bigger picture, while a medium term bottom was formed at 0.7603, it's still early to call for bullish trend reversal. As long as 38.2% retracement of 0.9200 (2025 high) to 0.7603 at 0.8213 holds, the larger down trend could still continue through 0.7603 at a later stage. However, firm break of 0.7603 will argue that the trend has reversed and turn focus to 0.8332 support turned resistance (2023 low) for confirmation.
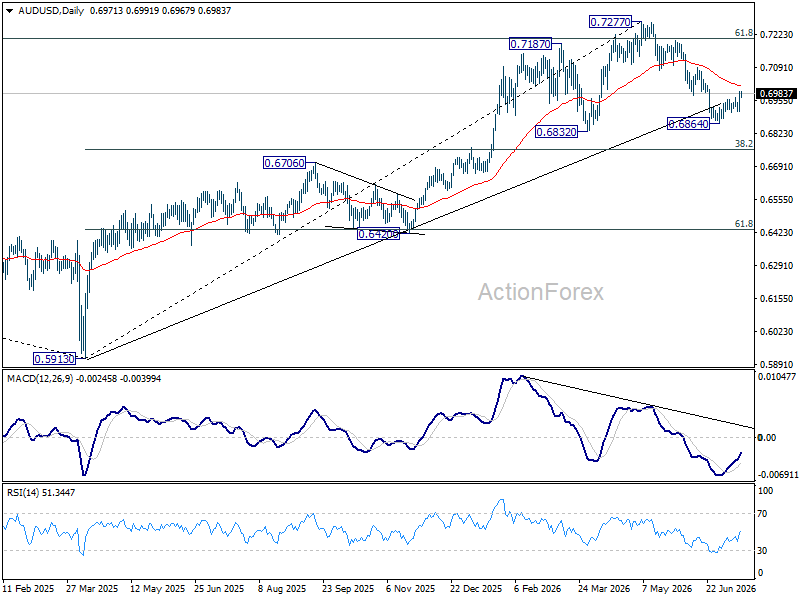
AUD/USD Daily Report
AUD/USD's break of 0.6977 support turned resistance confirms short term bottoming at 0.6864, ahead of 0.6832 key structural support. Intraday bias is back on the upside for 38.2% retracement of 0.7277 to 0.6864 at 0.7022. Sustained break there will target 61.8% retracement at 0.7119 next. On the downside, however, below 0.6912 minor support will turn bias back to the downside for 0.6864 low.
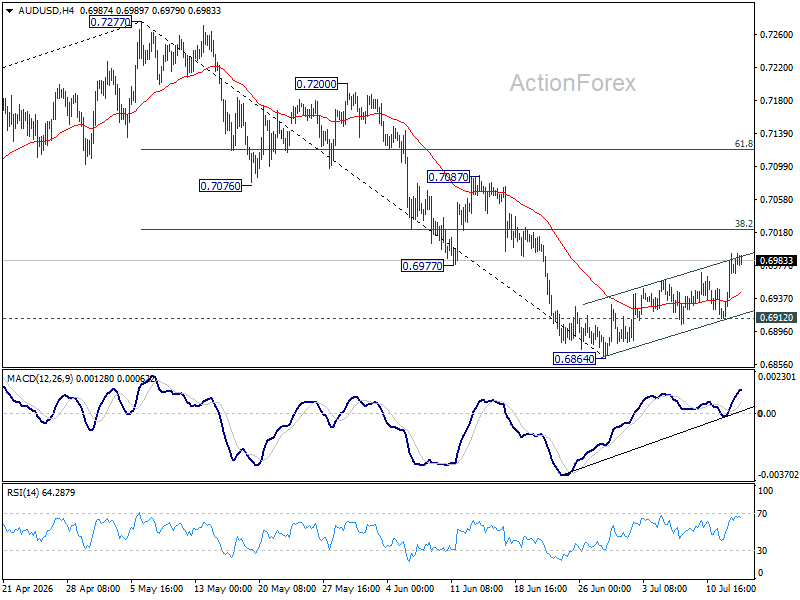
In the bigger picture, considering bearish divergence condition in D MACD, a medium term top could be formed at 0.7277 after failing to sustain above 61.8% retracement of 0.8006 (2021 high) to 0.5913 (2024 low) at 0.7206. Deeper fall could be seen to 38.2% retracement of 0.5913 to 0.7277 at 0.6756 as a correction. But strong support should be seen there to bring rebound. Consolidations would continue below 0.7277 for a while.
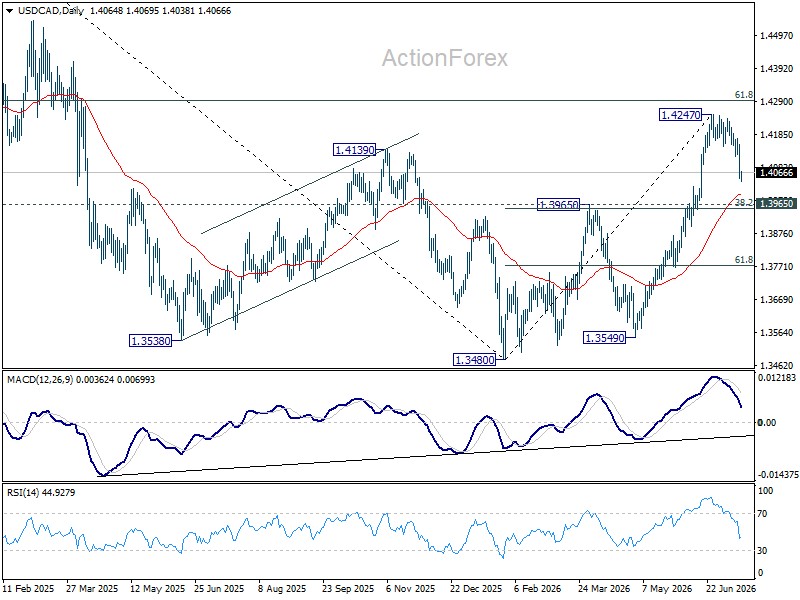
USD/CAD Daily Outlook
While the pullback from 1.4247 extended, outlook is unchanged in USD/CAD. It's now in a correction to rally from 1.3480. Downside should be contained by 1.3965 cluster support (38.2% retracement of 1.3480 to 1.4247 at 1.3954 to bring rebound. On the upside, above 1.4159 minor resistance will bring retest of 1.4247 high. Firm break there will target 61.8% retracement of 1.4791 to 1.3480 at 1.4290.
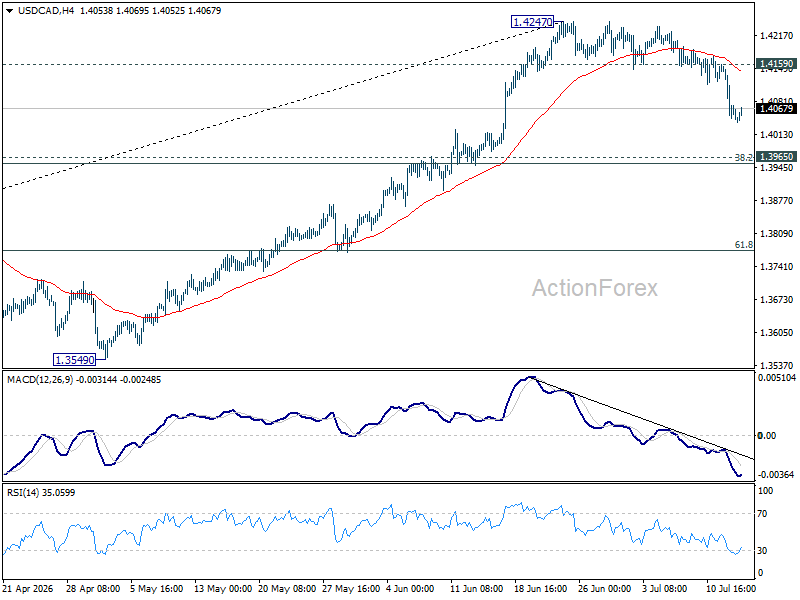
In the bigger picture, current development suggests that fall from 1.4791 has completed as a three wave correction to 1.3480. It's still early to judge if rise from there a corrective bounce, or resumption of the larger up trend from 1.2005 (2021 low). But in either case, retest of 1.4791 high should be seen next.