
Sample Category Title
GBP/JPY Daily Outlook
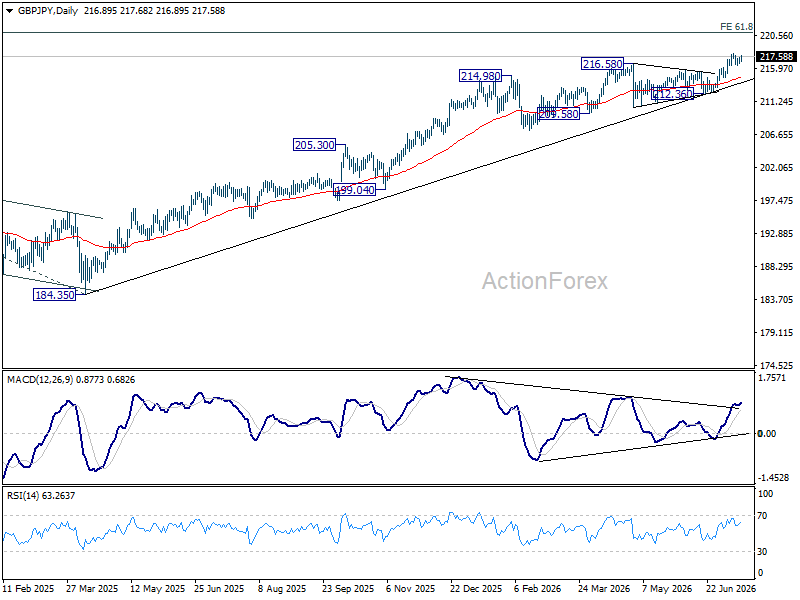
GBP/JPY is staying in consolidations below 217.99 temporary top and intraday bias remains neutral. Deeper pullback cannot be ruled out, but downside should be contained above 214.69 support to bring another rally. On the upside, above 217.99 will target 220.90 fibonacci projection level next.
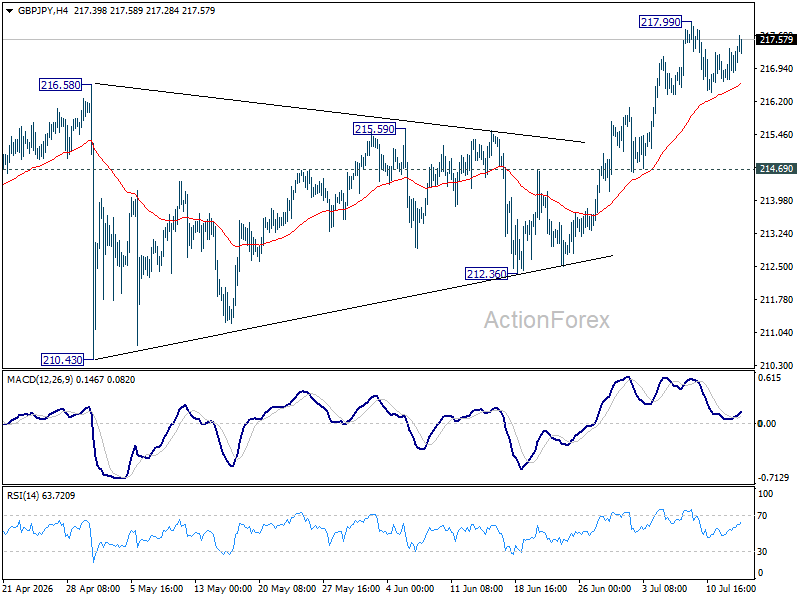
In the bigger picture, the long term up trend is in progress. Next target is 61.8% projection of 148.93 (2022 low) to 208.09 (2024 high) from 184.35 at 220.90. For now, outlook will remain bullish as long as 55 W EMA (now at 208.22) holds, in case of pullback.
EUR/JPY Daily Outlook
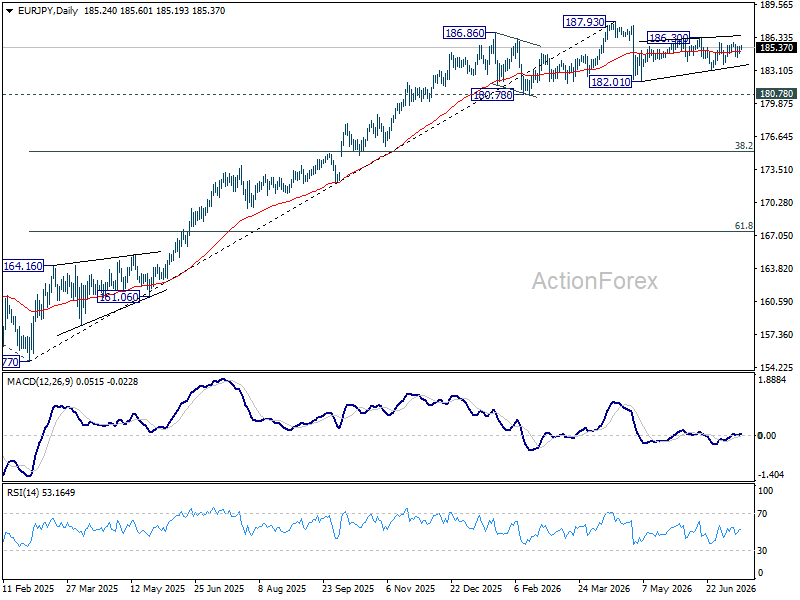
EUR/JPY is still bounded in sideway trading in range of 183.14/186.30 and intraday bias remains neutral for the moment. While the price actions from 182.10 are looking corrective, stronger rebound cannot be ruled out. On the upside, firm break of 186.30 will resume the rebound from 182.10 towards 187.93 high. On the downside, break of 183.14 will bring deeper fall to retest 182.10.
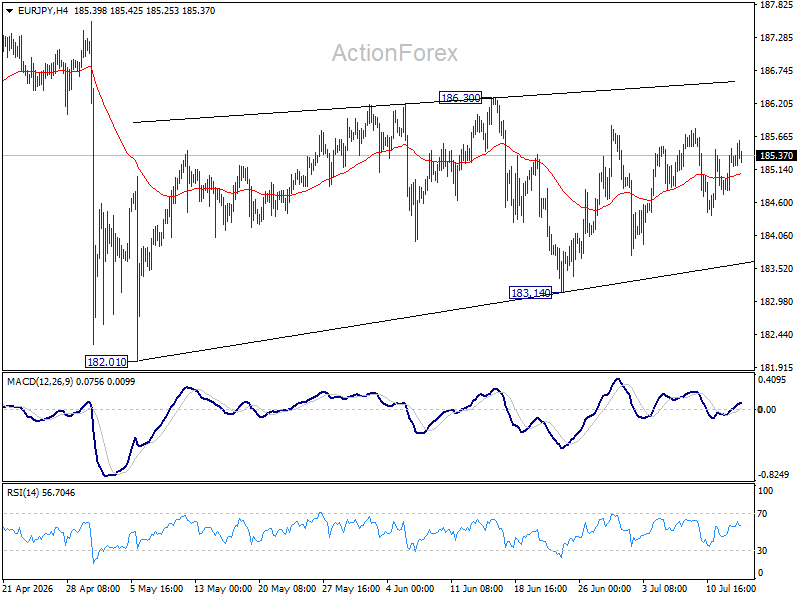
In the bigger picture, there is no sign of reversal yet. Uptrend from 114.42 (2020 low) is still expected to resume at a later stage to 78.6% projection of 124.37 (2022 low) to 175.41 (2025 high) from 154.77 at 194.88. However, sustained break of 55 W EMA (now at 179.93) will argue that it's already in a medium term down trend to 175.41 resistance turned support and below.
EUR/GBP Daily Outlook
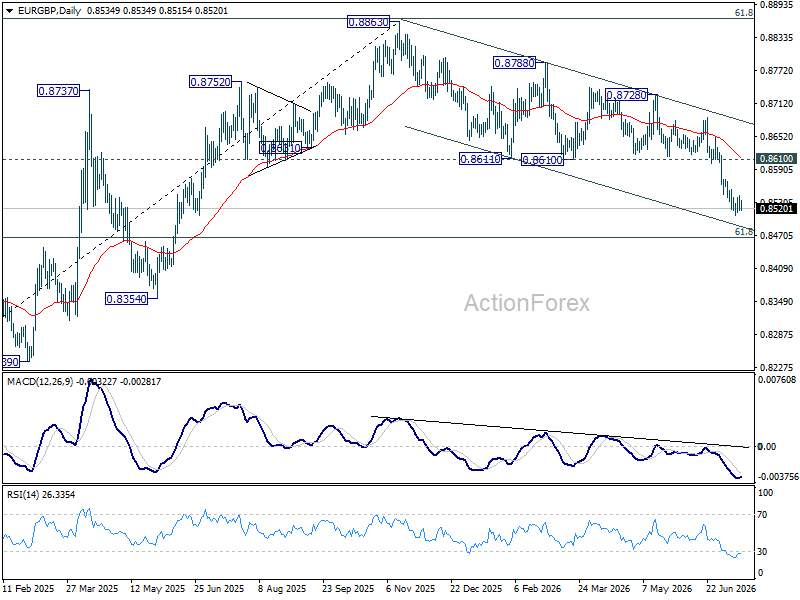
EUR/GBP is staying in consolidations above 0.8507 and intraday bias remains neutral. Stronger recovery cannot be ruled out, but upside should be limited below 0.8610 support turned resistance to bring another fall. Below 0.8507 will resume larger down trend to 61.8% retracement of 0.8221 to 0.8863 at 0.8466.
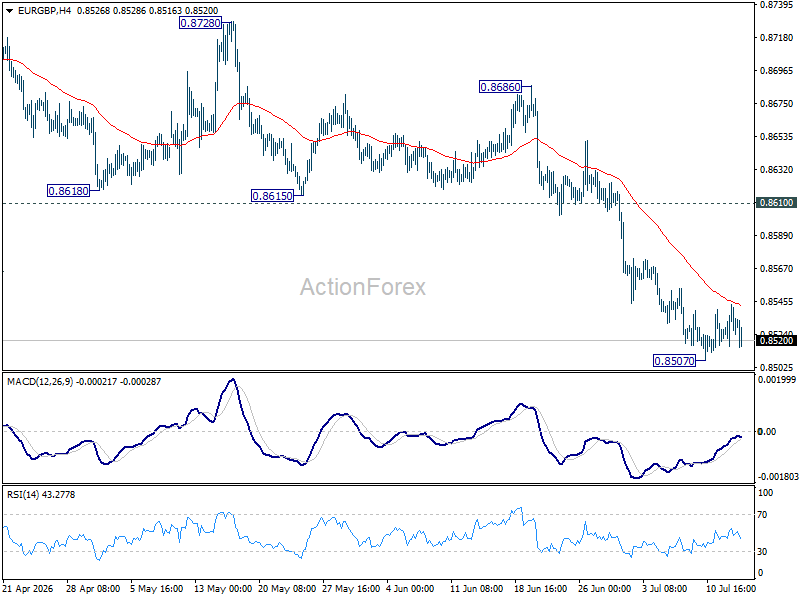
In the bigger picture, current development suggests that rise from 0.8221 (2024 low) has completed at 0.8863, just ahead of 38.2% retracement of 0.8221 (2024 low) to 0.8863 (2025 high) at 0.8618. Deeper fall would be seen back to 0.8201 (2022 low). For now, outlook will be neutral at best as long as 0.8863 hold.
EUR/AUD Daily Outlook
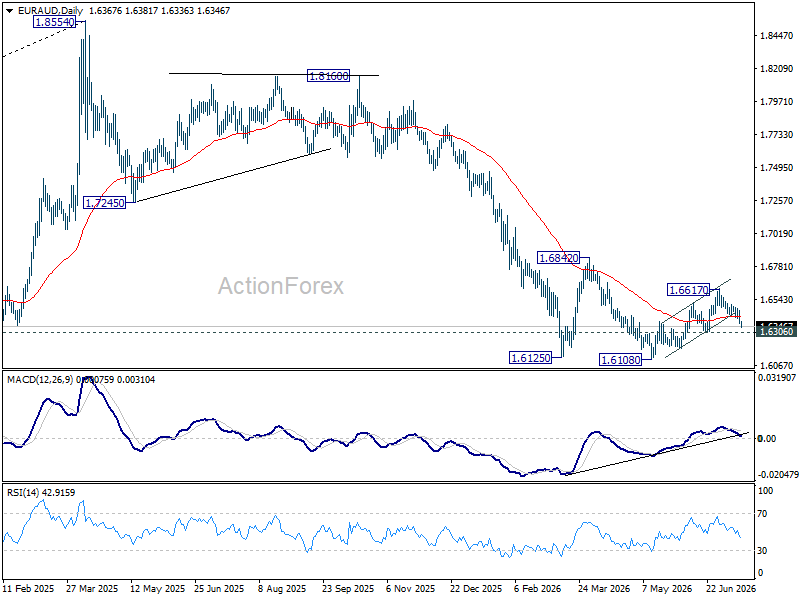
Focus is now on 1.6306 support as EUR/AUD's fall from 1.6617 accelerates lower. Firm break there will indicate that rebound from 1.6108 has completed. Deeper decline should the be seen to retest this low. On the upside, break of 1.6506 will turn bias back to the upside for 1.6617.
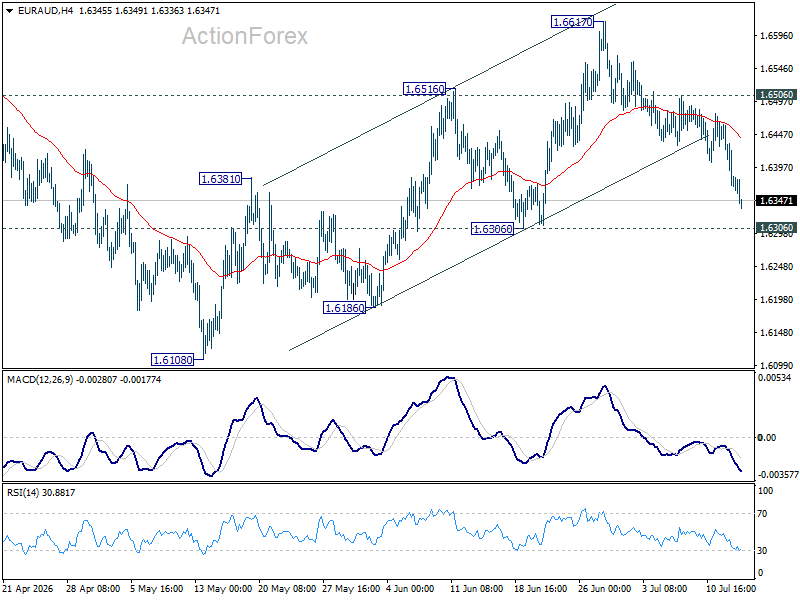
In the bigger picture, outlook will stay bearish as long as 1.6842 resistance holds. Fall from 1.8554 (2025 high) is expected to continue to 61.8% retracement of 1.4281 to 1.8554 at 1.5913. Decisive break there will pave the way back to 1.4281 (2022 low). However, firm break of 1.6842 should confirm medium term bottoming, and bring stronger rally.
EUR/CHF Daily Outlook
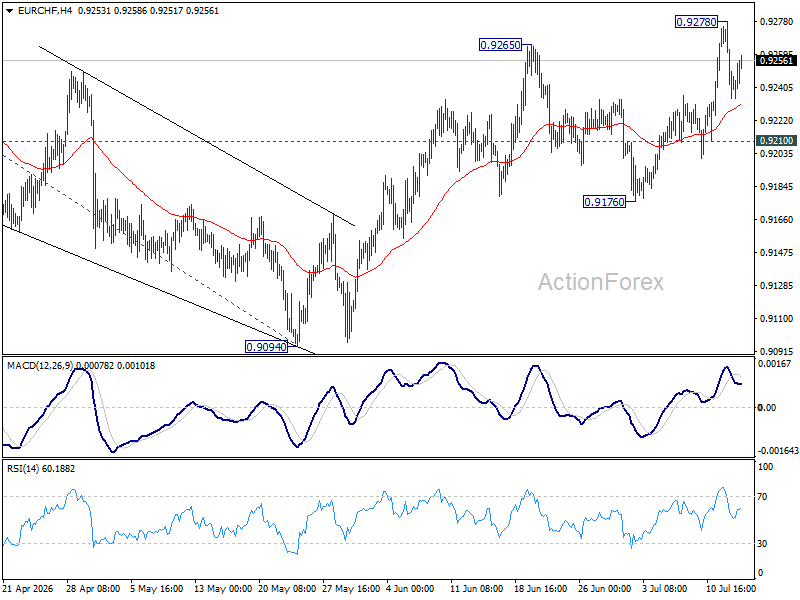
Intraday bias in EUR/CHF is turned neutral with current retreat, and some consolidations would be seen below 0.9278 temporary top. Downside should be contained by 0.9210 support to bring another rise. Above 0.9278 will resume whole rally from 0.8979 to 100% projection of 0.8979 to 0.9264 from 0.9094 at 0.9379. However, break of 0.9210 will bring deeper fall back to 0.9176 support instead.
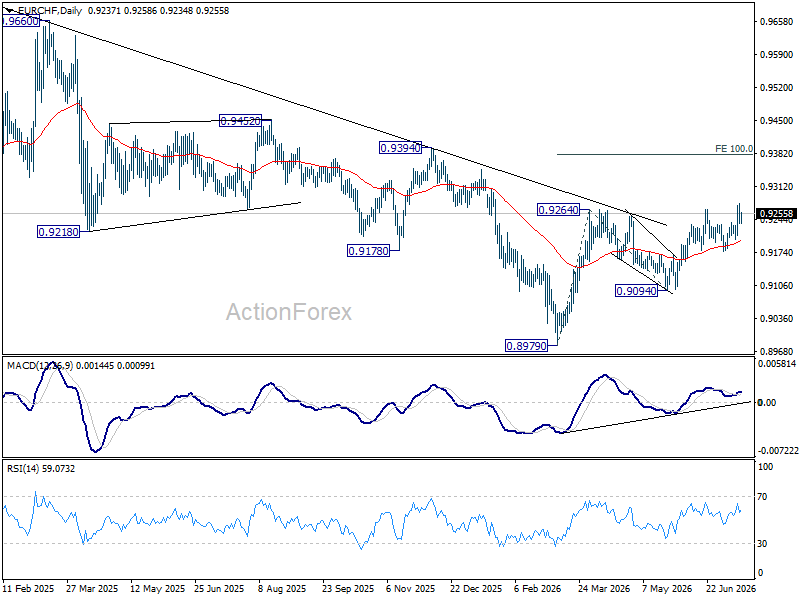
In the bigger picture, the break of medium term falling trend line resistance indicates that 0.8979 is already a medium term bottom. Considering bullish convergence condition in W MACD, rise from there should at least be reversing the fall from 0.9928, with prospect of developing into a medium term up trend. Firm break of 0.9394 resistance will add more credence to this case. For now risk will remain on the upside as long as 0.9094 support holds, in case of retreat.
China’s Economy Grew at the Slowest Pace in Over Three Years in Q2
China’s economy grew at its slowest rate in more than three years during the second quarter, falling short of expectations as weak household consumption overshadowed resilient manufacturing and export performance. The slowdown has renewed concerns about the long-term sustainability of China’s export- and investment-led growth model.
Gross domestic product (GDP) expanded by 4.3% year-on-year in the April–June period, down from 5.0% in the first quarter and below the government’s full-year growth target range of 4.5% to 5.0%.
The weaker-than-expected data increases pressure on Beijing to introduce additional economic stimulus. However, many analysts believe the Communist Party’s Politburo is unlikely to announce significant policy measures at its closely watched meeting later this month, citing concerns over rising debt levels.
Other economic indicators painted a mixed picture. Retail sales increased by 1.0% in June after declining 0.6% in May, while industrial production accelerated to 5.3% from 4.5% in the previous month. The figures underscore China’s continued dependence on external demand to support growth, even as trading partners raise concerns about persistent trade imbalances and geopolitical tensions, including the conflict involving Iran, weigh on the global economy.
Trade data released on Tuesday reinforced this trend, showing that strong overseas demand continues to offset weak domestic consumption. Exports surged 27% year-on-year in June, up from 19.4% in May and well above market expectations, while the trade surplus widened significantly. The strength in exports was driven largely by robust demand linked to the global artificial intelligence boom, highlighting the sector’s growing role as the primary engine of China’s economic growth.
Crude Oil: Emotions Are Running High
- Fear is driving the Crude oil market again.
- The decline in global stocks is making the ‘black gold’ market more vulnerable.
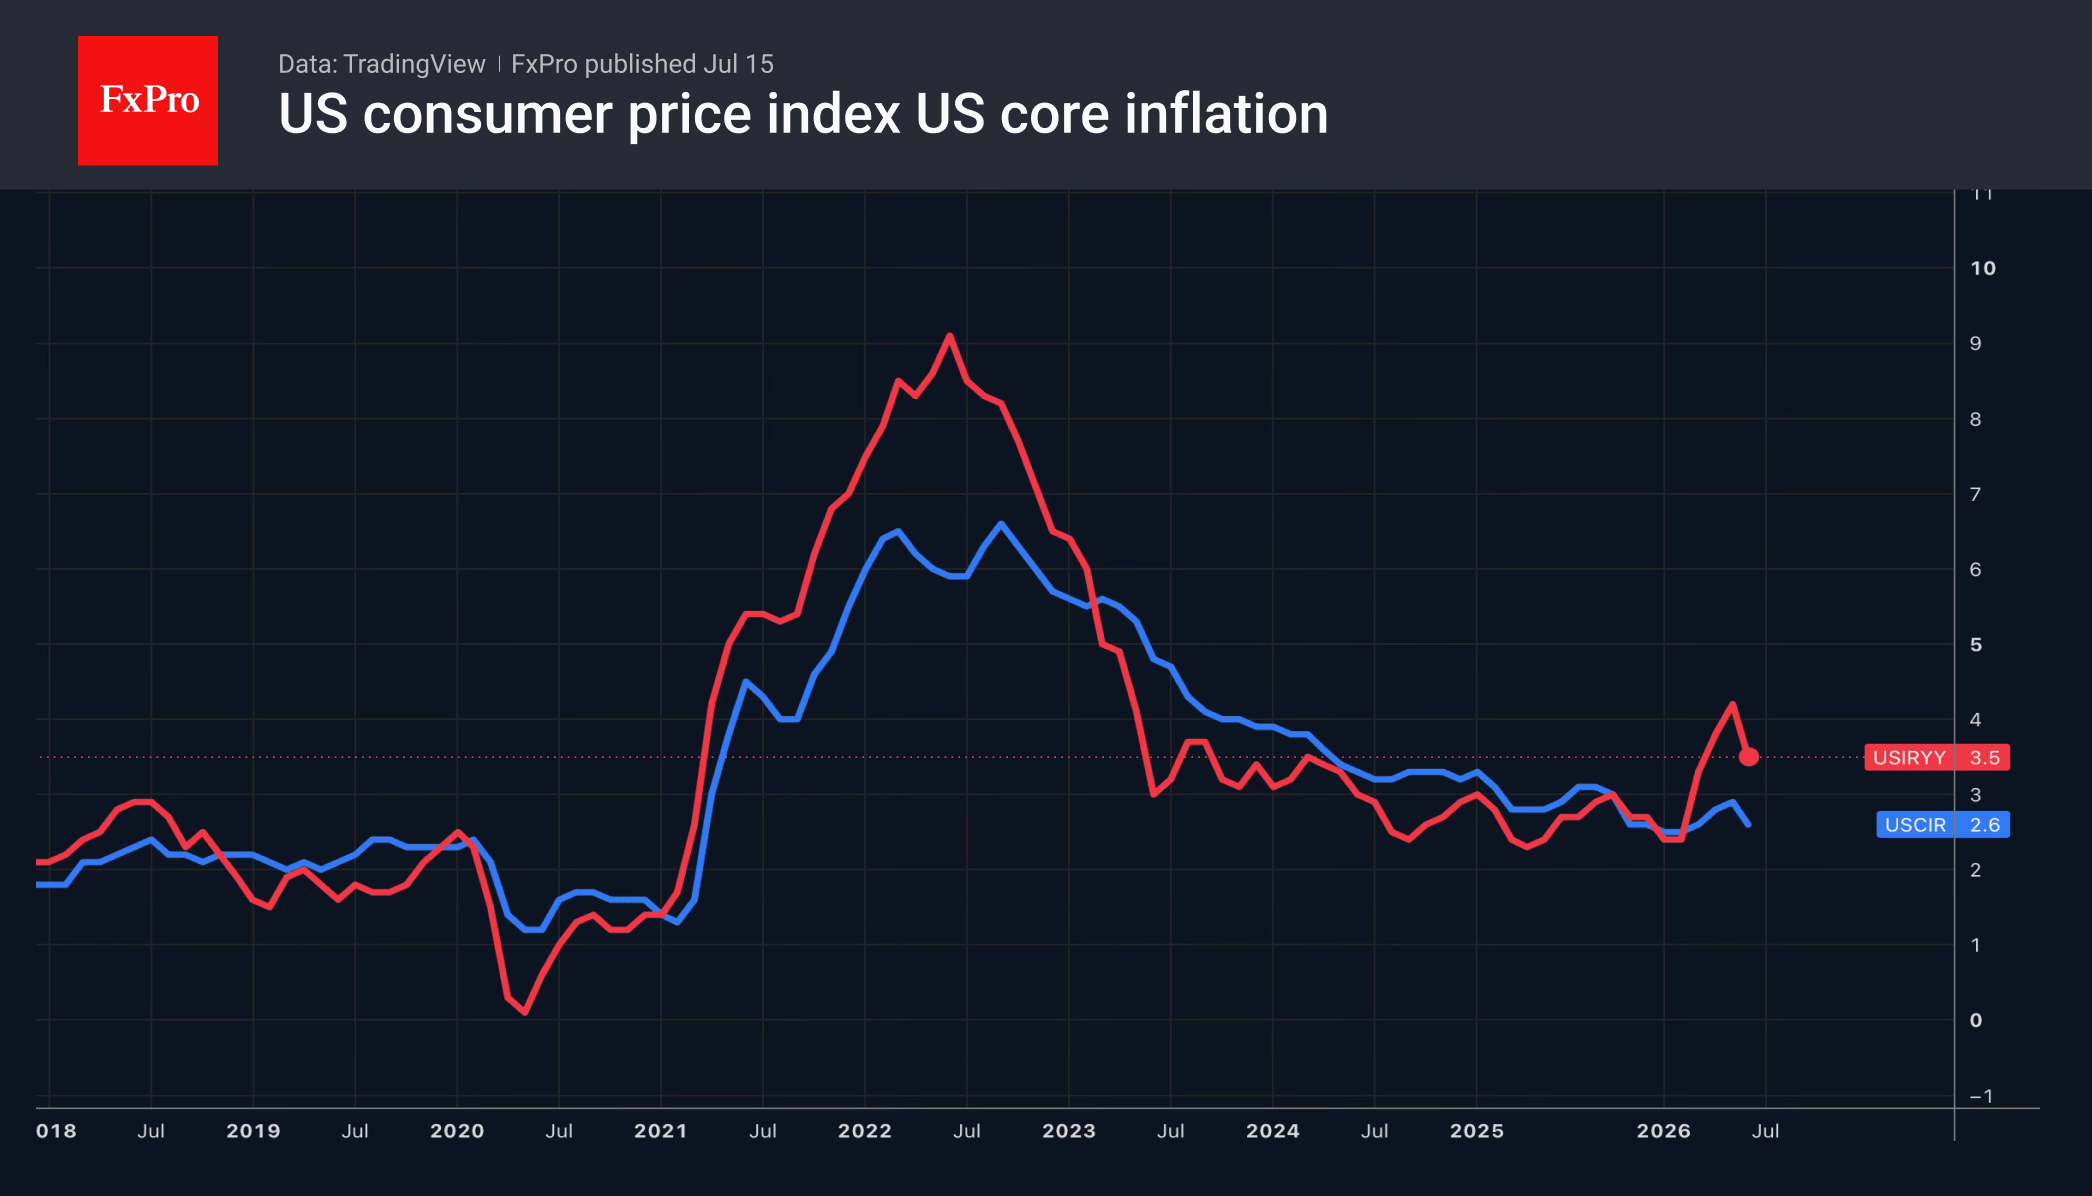
The US dollar retreated as consumer price inflation slowed from 4.2% to 3.5% and core inflation fell from 2.8% to 2.6% in June. The chances of a Fed rate hike in July have fallen from 40% to 17%, while the probability of two rounds of monetary tightening in 2026 has dropped from 58% to 35%. Investors believe that the CPI figures for May marked a peak and that disinflationary trends will continue. Therefore, there is no need for the Fed to raise rates.
Kevin Warsh is sceptical of this view. In his testimony before Congress, he accused the Fed of failing to fulfil its primary mandate. The central bank has failed to bring inflation back to its 2% target for five years, and the new chair intends to rectify this. He advises against focusing on a single inflation report. The escalation of the conflict in the Middle East suggests that it is still too early to speak of a trend.
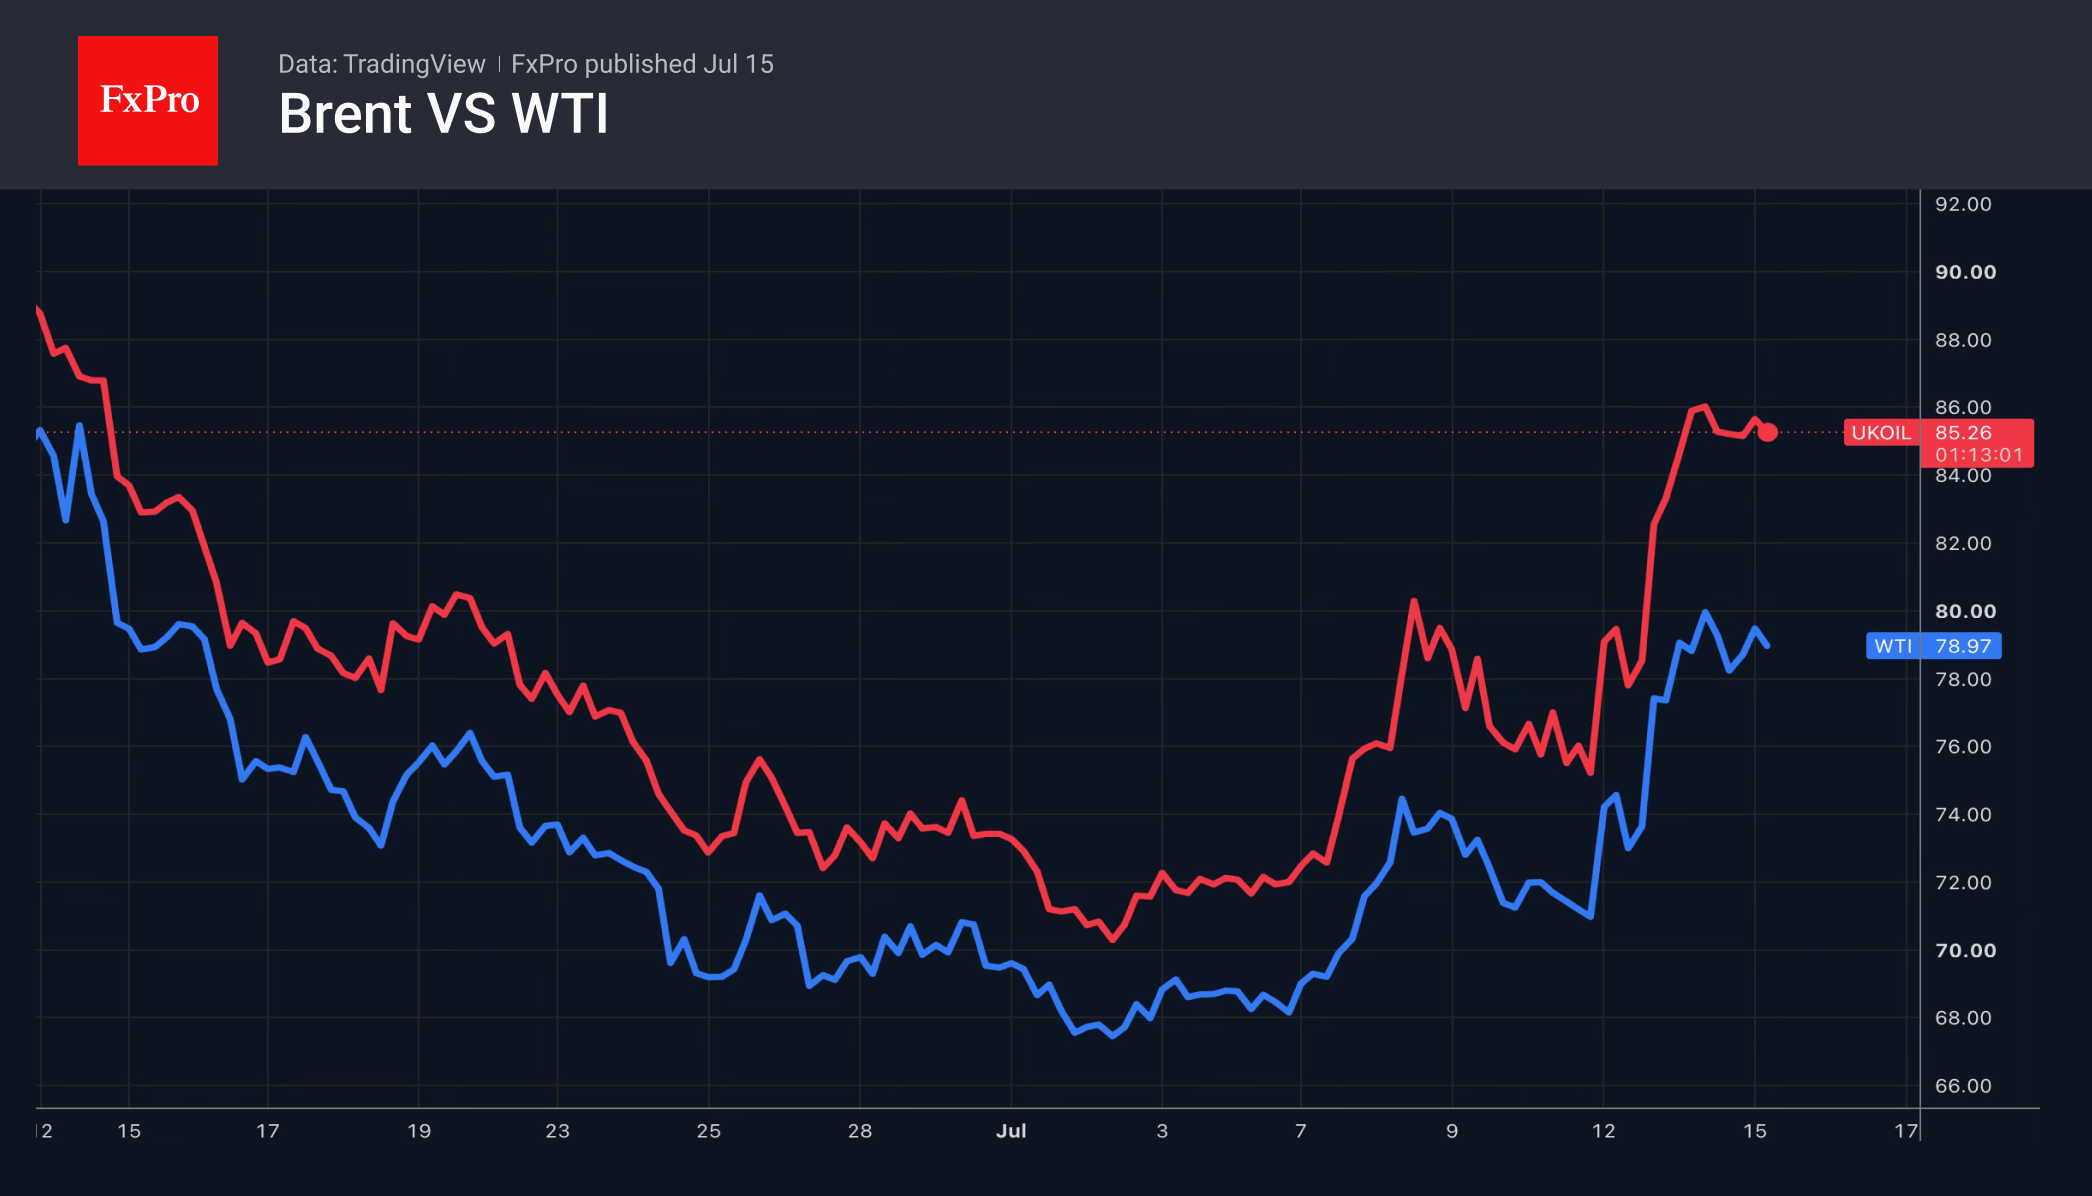
Brent has risen over four of the last six trading days and has managed to recoup all its June losses during this period. Investors believe that the sharp decline in global stocks is making the market more vulnerable than it was at the start of the conflict in the Middle East. The resumption of the US blockade of the Strait of Hormuz, new sanctions against Tehran and threats to bomb energy infrastructure are heightening the risks of retaliatory action by Iran.
Markets fear the closure of the Bab el-Mandeb Strait, another key global chokepoint, by the Houthis, who are controlled by Tehran. This would further undermine exports from the Gulf states and push Brent above $100 per barrel in the very near future. The Yemeni group is even threatening that oil prices could soar above $200.
Just as at the start of the conflict in the Middle East, Brent is rising on the back of market sentiment. Fears of worsening supply disruptions are outweighing bearish factors, including a decline in global demand led by China, the availability of alternative routes, still substantial global oil reserves and the US’s readiness to boost exports.
Meanwhile, according to API data, US oil stocks have fallen for the 13th consecutive week, albeit at a slower pace than expected. Investors are awaiting figures from the US Energy Information Administration.
The FxPro Analyst Team
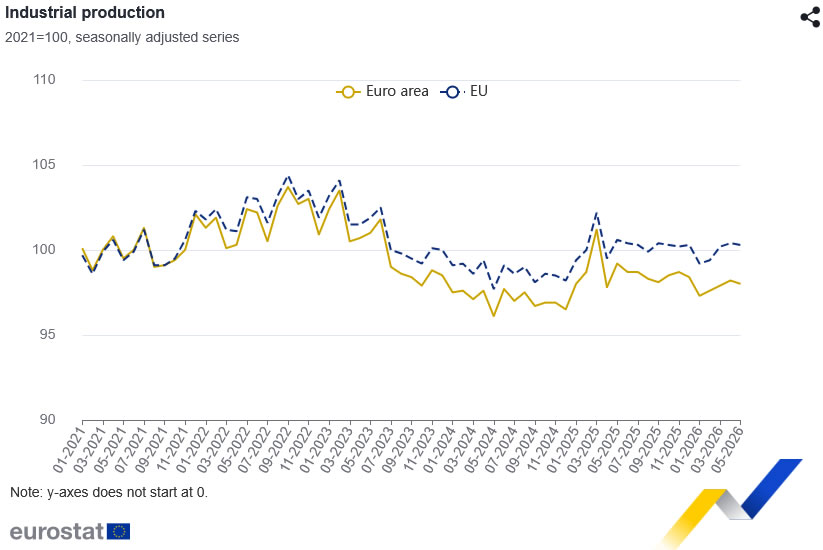
Eurozone Industrial Production Unexpectedly Falls -0.2% MoM as Manufacturing Recovery Stalls
Eurozone industrial production unexpectedly declined in May, falling -0.2% month-on-month after rising 0.3% in April and confounding expectations for a 0.3% increase. The weaker-than-expected reading suggests the region's manufacturing recovery remains uneven, with strength in some sectors continuing to be offset by weakness elsewhere. Across the broader European Union, industrial production also slipped, edging down -0.1% after a 0.2% gain in April.
The sector breakdown highlighted a mixed picture. Energy output rose 2.2% and capital goods production increased 0.3%, pointing to continued resilience in investment-related activity. Non-durable consumer goods also advanced 0.8%. However, those gains were outweighed by a -0.3% decline in intermediate goods production and a sharper -1.1% fall in durable consumer goods, indicating that manufacturing supply chains and consumer-related industries continue to face subdued demand.
Performance also varied considerably across member states. Ireland posted the largest monthly decline at -5.2%, followed by Malta and Lithuania, while Luxembourg, Hungary and Poland recorded the strongest gains. The data reinforce the view that the Eurozone's industrial recovery remains fragmented rather than broad-based.
Economic Data
| Indicator | Actual | Expected | Previous |
|---|---|---|---|
| Eurozone Industrial Production (MoM) | -0.2% | 0.3% | 0.3% |
| EU Industrial Production (MoM) | -0.1% | — | 0.2% |
| Energy Output (MoM) | 2.2% | — | — |
| Capital Goods (MoM) | 0.3% | — | — |
| Intermediate Goods (MoM) | -0.3% | — | — |
| Durable Consumer Goods (MoM) | -1.1% | — | — |
| Non-Durable Consumer Goods (MoM) | 0.8% | — | — |
Market Takeaways
- Eurozone industrial production unexpectedly contracted, missing expectations and indicating that the manufacturing recovery remains uneven.
- Growth in energy output and capital goods was outweighed by declines in intermediate goods and durable consumer goods.
- The weakness points to continued softness in manufacturing supply chains and discretionary consumer demand.
- Country-level performance remained highly divergent, highlighting the fragmented nature of the Eurozone's industrial recovery.
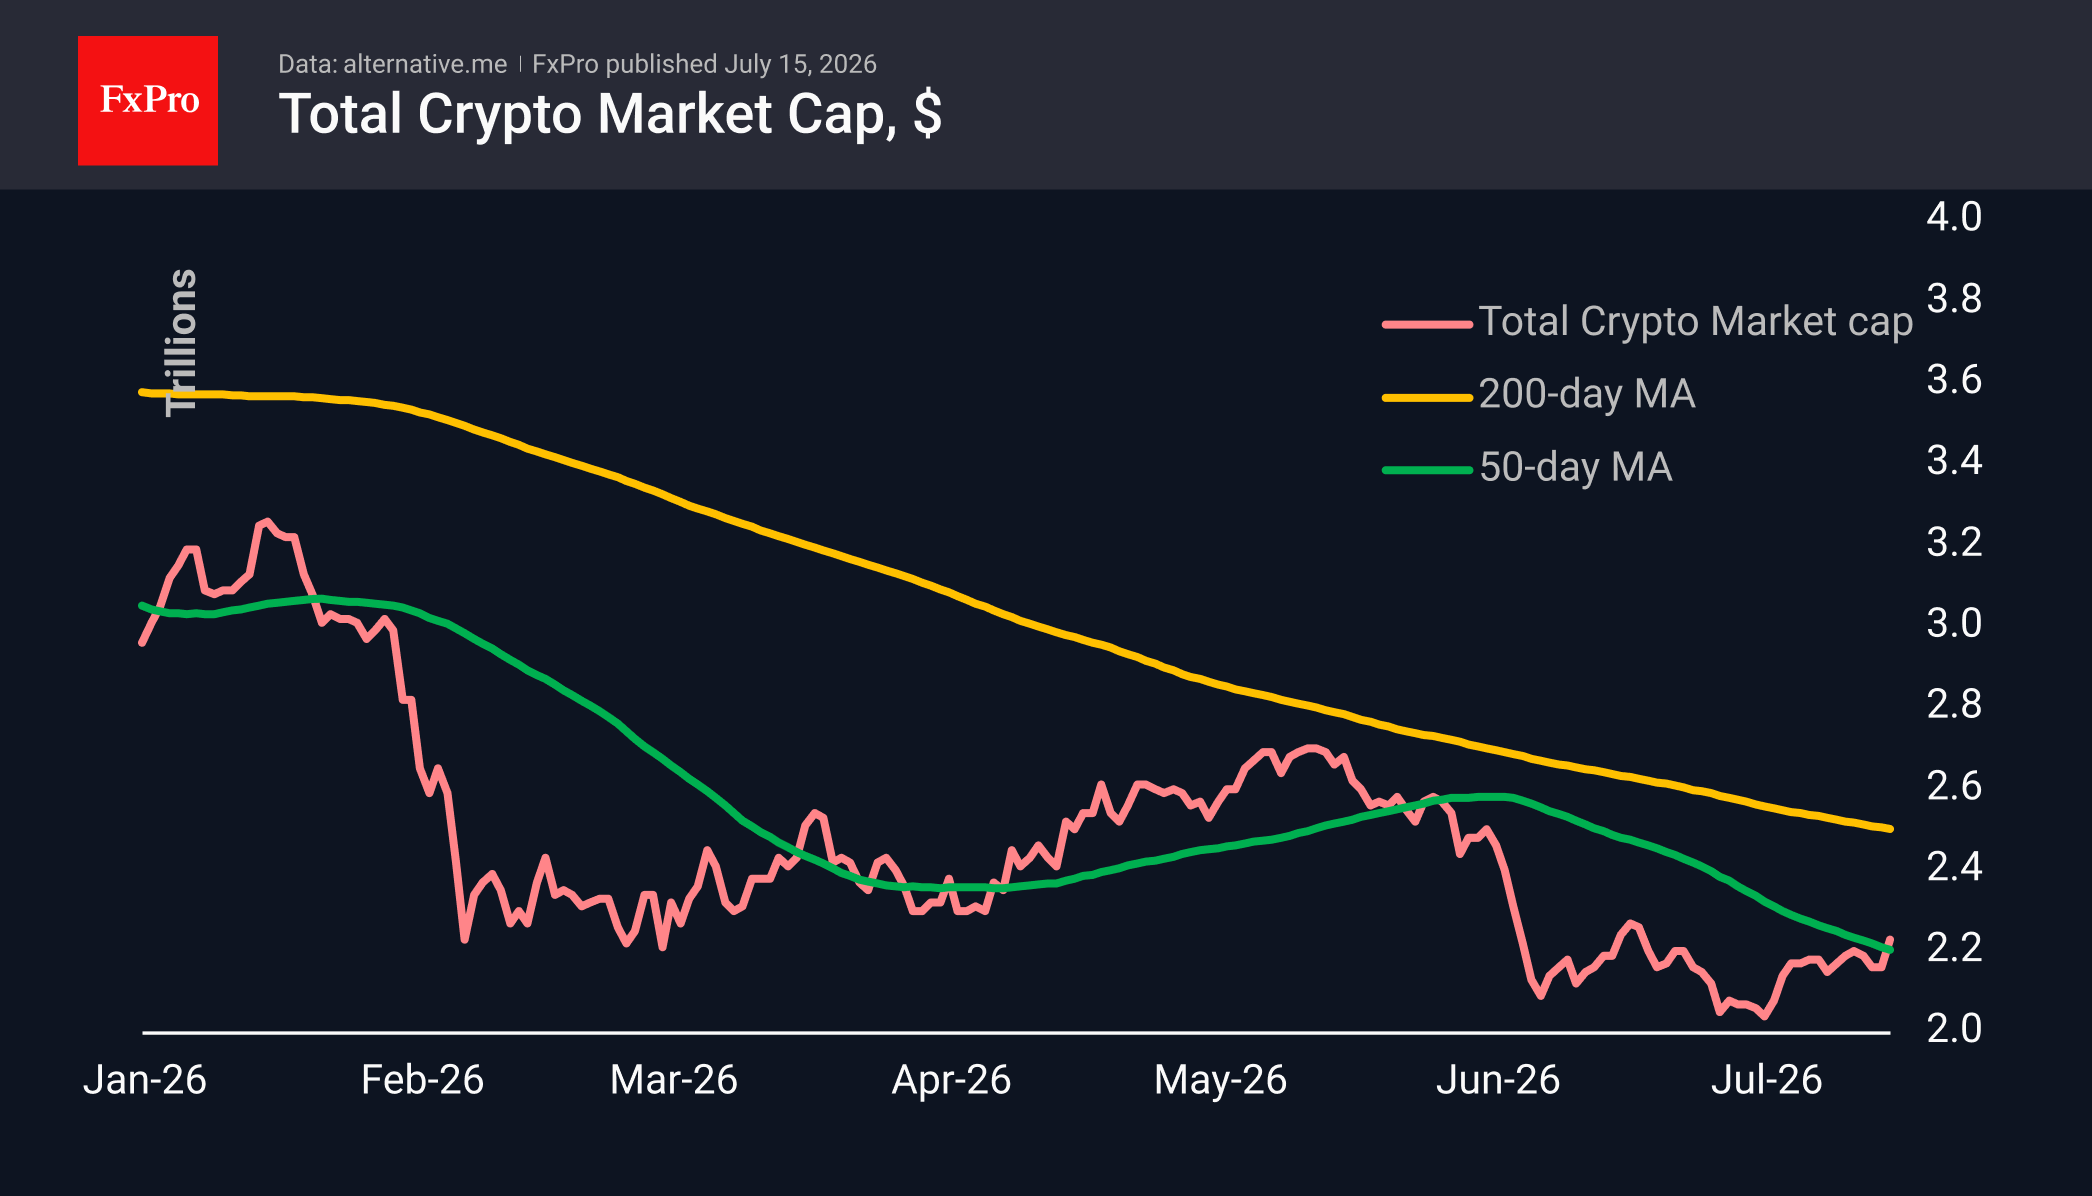
Crypto Market Breaks Above the 50-Day Ma: Bitcoin Eyes $73–74K
Market Overview
The crypto market capitalisation rose by 3.5% to $2.22T, reaching a three-week high, following the release on Tuesday of weak US inflation data, which showed inflation slowing at its fastest rate in the last six years, thereby reducing the likelihood of a Fed rate hike. The market has risen above its 50-day moving average, signalling one of the first indications of a shift towards a medium-term bullish trend. Among the most popular coins, the top performers over the last 24 hours were Zcash (+8.8%), Chainlink (+5.2%) and Ethereum (+4.9%). Meanwhile, among the laggards, there was also a very moderate pullback, with losses for IOTA (-1.7%), Internet Computer (-0.8%) and Theta Network (-0.4%).
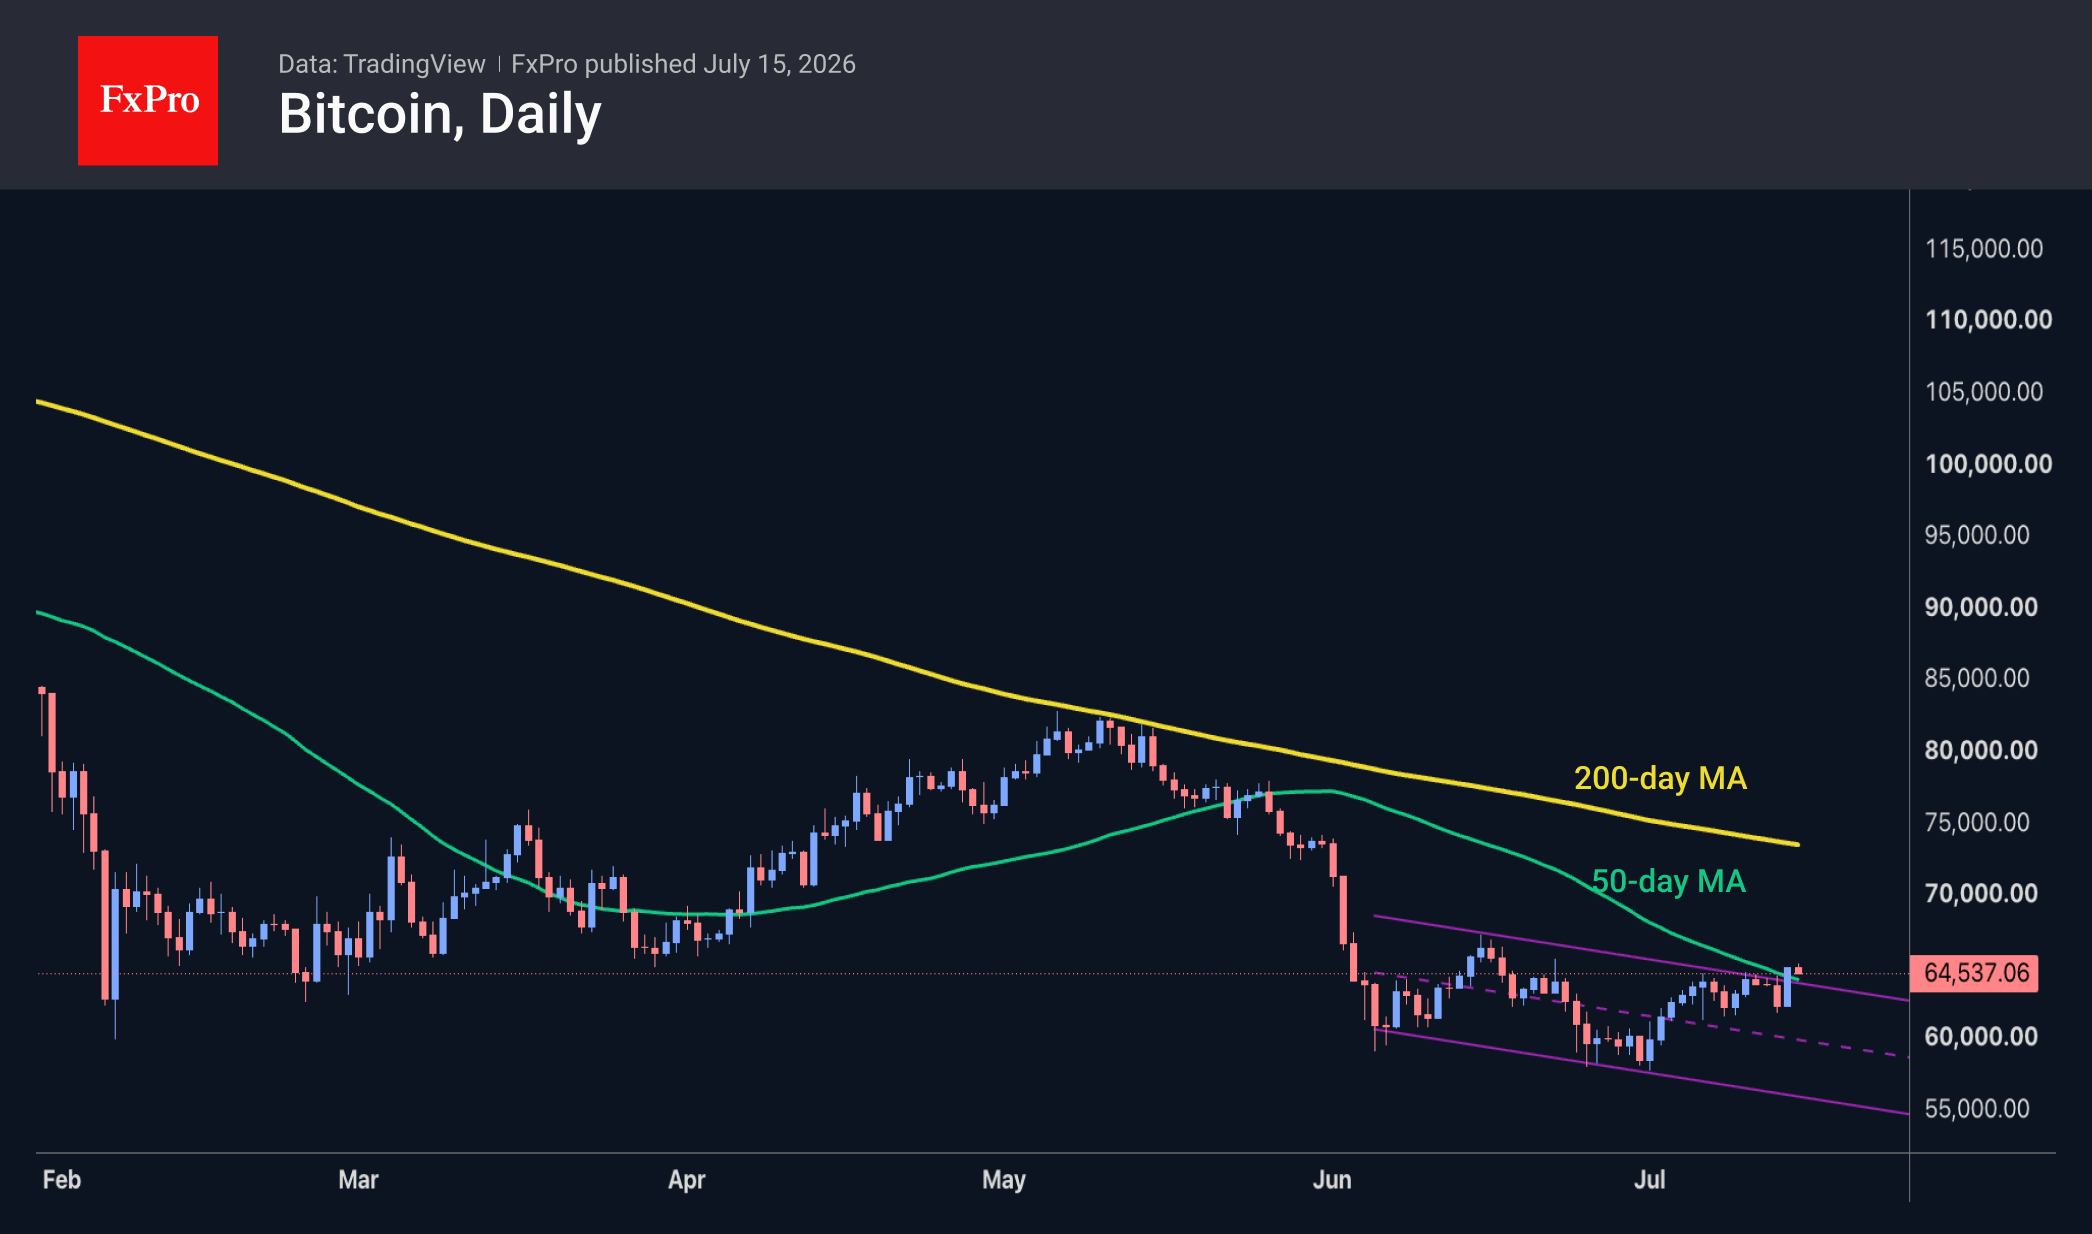
Bitcoin is trading near $65K following an impressive surge on Tuesday, which helped it close above the 50-day moving average and the upper boundary of the downward channel in place since early June. This is a strong signal of a potential trend reversal, further supported by fundamental data: lower inflation figures. Provided the leading cryptocurrency does not face obstacles in the form of deteriorating geopolitical conditions, the next significant resistance level may not be reached until $73–74K. This is where the downward momentum originated in early June, and it is also where the 200-day moving average is located.
News Background
Current levels of network activity point to waning interest in Bitcoin. Trading volumes in US spot ETFs have fallen by 78% from this year’s peak levels. Recent price movements lack the reliable support of organic demand that typically accompanies sustained growth, according to Glassnode.
According to The Block, the number of posts mentioning Bitcoin and Ethereum on social media platform X has fallen to annual lows. Comparable levels were also recorded in 2020, while institutional participation has since increased.
A survey by the cryptocurrency exchange Coinbase has shown that most investors doubt the decline in the leading cryptocurrency has come to an end. Meanwhile, Bitcoin has fallen to levels corresponding to the estimated cost of mining. Historically, such a range has always marked a trend reversal, notes analyst Quentin Francos.
According to Arkham Intelligence, the US authorities have transferred Bitcoin and Ethereum with a combined value of around $300 million to the Coinbase Prime crypto exchange. The movement of crypto assets does not necessarily imply an imminent sale; nevertheless, transferring them to such a platform is seen as preparation for a sale or exchange.
US banks have called on the Senate to explicitly include a ban on yields on stablecoins in the CLARITY Act, a key piece of legislation regulating the crypto market. The current wording of the bill leaves room for payments that are economically similar to interest on deposits.
The FxPro Analyst Team
Brent Crude Oil: from Ceasefire to Crossfire — What’s Next?
Just weeks ago, traders were pricing in peace. Now they're pricing in war again—and that reversal says everything about how fragile the current Middle East calm really is.
Brent crude has surged to $86 a barrel, its highest level in a month, after the Washington-Tehran ceasefire effectively collapsed. US strikes hit Iranian defence infrastructure, Iranian missiles struck Emirati tankers, and Washington reinstated its naval blockade of Iranian ports.
Additionally, yesterday's June CPI year-on-year print eased bullish pressure on the dollar and gave a lift to dollar-denominated assets. Headline inflation fell to 3.5% year-on-year, well below the expected 3.8%, largely thanks to a sharp drop in energy prices during June. However, the read looks backward-looking rather than structural: it reflects June's energy weakness, before the ceasefire unraveled.
Technical Analysis of Brent Crude Oil
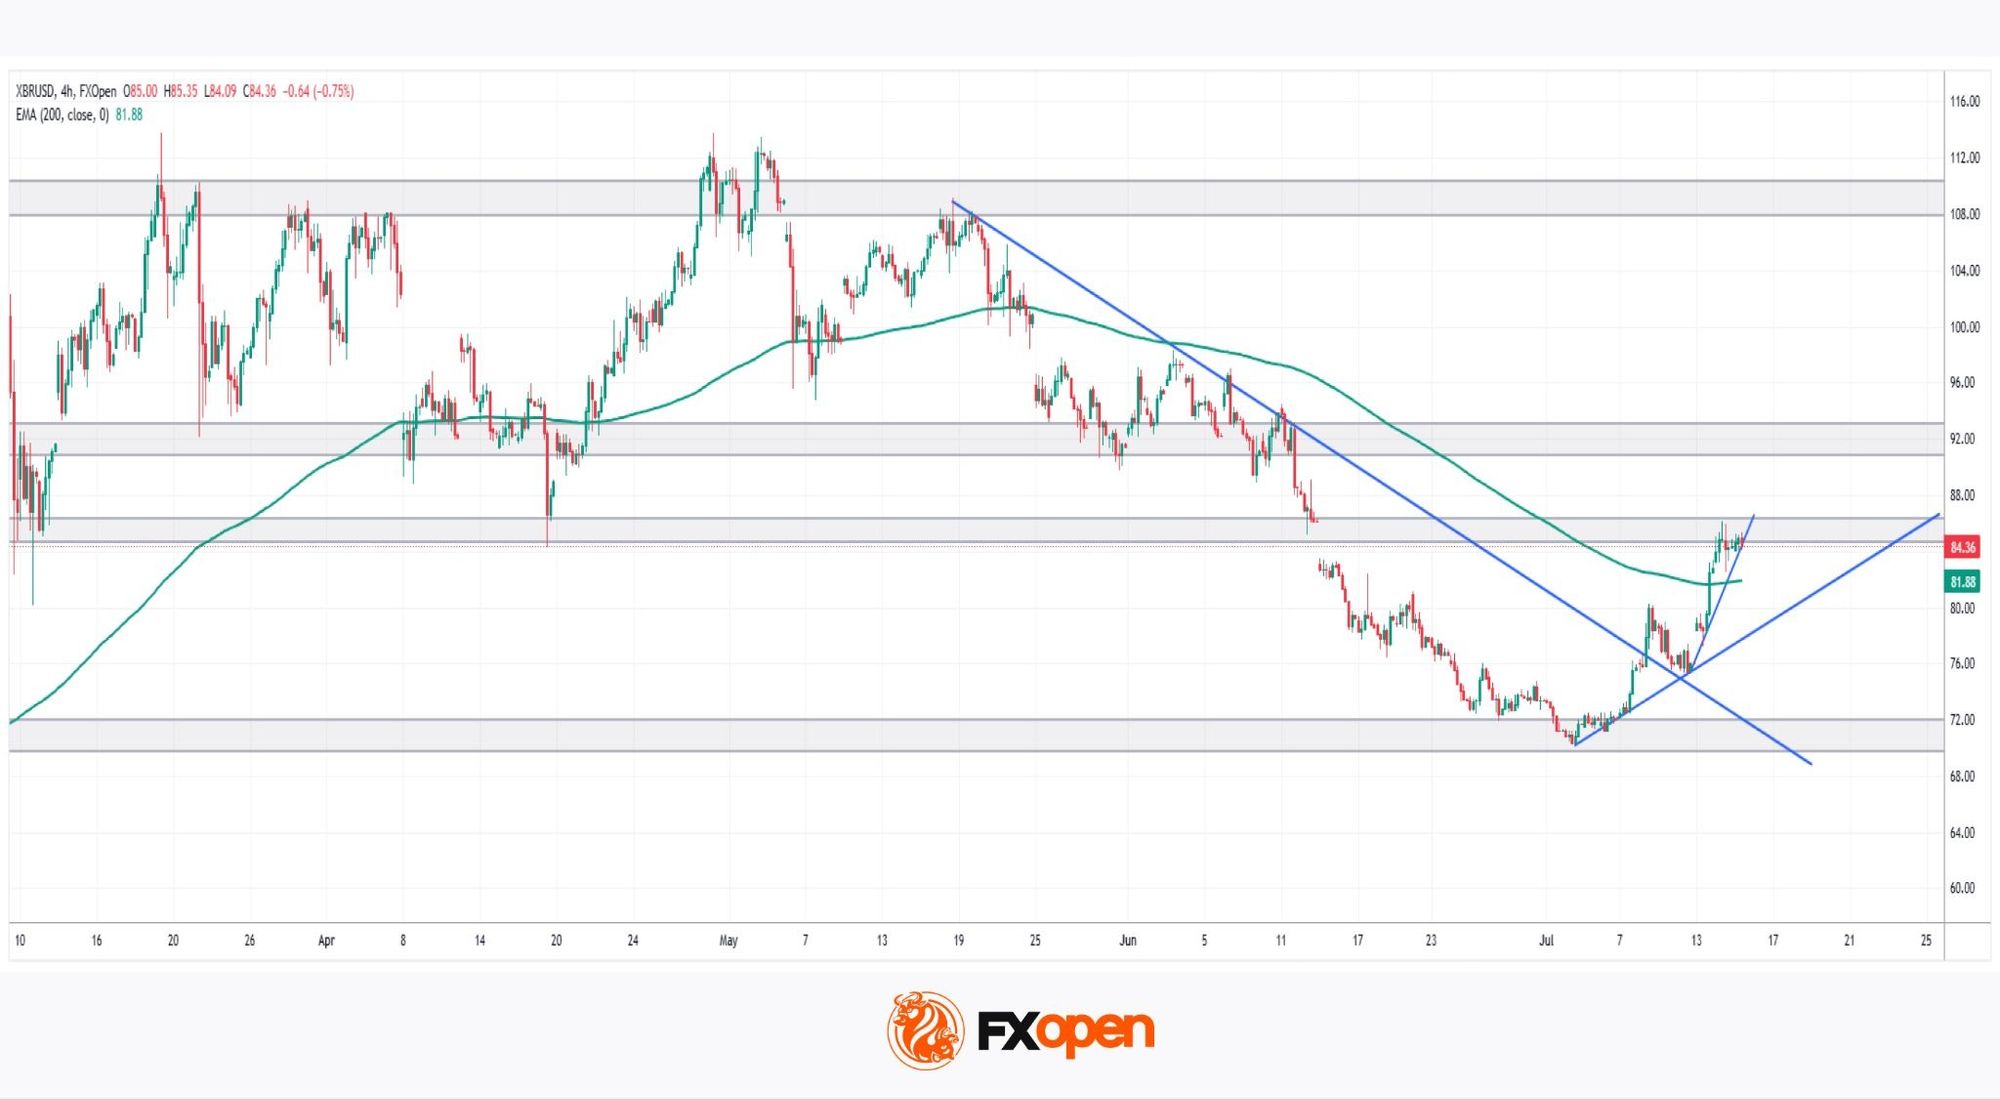
As the chart shows, Brent entered a clear downtrend after being repeatedly rejected from the psychological $110 zone in May, marked by lower highs and lower lows and a descending trendline respected for nearly two months.
Bullish Scenario
After bottoming near $70 in early July, Brent shifted character, printing higher highs and higher lows due to renewed Middle East tensions. This was confirmed by a break and retest of the descending trendline, followed by a reclaim and retest of the 200-period EMA. With two ascending trendlines now supporting the move, price sits at a key juncture: the $85 zone, a former support turned resistance. A confirmed break here would open the path back toward the $90-$92 zone.
Bearish Scenario
Alternatively, Brent could reject $85 once again, pulling the price back into the $70–$80 range that has defined the past month. Confirmation would come from a break below both the short-term trendline and the 200-period EMA, signaling that buyers have lost control and exposing the range lows.
Brent Crude now sits at a genuine crossroads, caught between an unresolved geopolitical crisis and a technical structure hinting at renewed strength. Whether this bounce marks a real turning point or just another head-fake within a volatile range will likely hinge on who blinks first—Washington and Tehran, or buyers and sellers at $85. Either way, the next move could set the tone for the entire energy market this summer.
Start trading commodity CFDs with tight spreads (additional fees may apply). Open your trading account now or learn more about trading commodity CFDs with FXOpen.
This article represents the opinion of the Companies operating under the FXOpen brand only. It is not to be construed as an offer, solicitation, or recommendation with respect to products and services provided by the Companies operating under the FXOpen brand, nor is it to be considered financial advice.