
Sample Category Title
WTI Crude Oil Meets a Tough Barrier—Can Bulls Hold on?
Key Highlights
- WTI Crude Oil started a fresh rally above $76 and $78.
- A key bullish trend line is forming with support at $72.80 on the 4-hour chart of XTI/USD.
- Gold could attempt a recovery if it surpasses the $4,120 resistance.
- EUR/USD seems to be consolidating above the 1.1350 support.
WTI Crude Oil Price Technical Analysis
WTI Crude Oil prices started a steady increase above $75 against the US Dollar. The price cleared key hurdles near $76 and $78 to enter a positive zone.
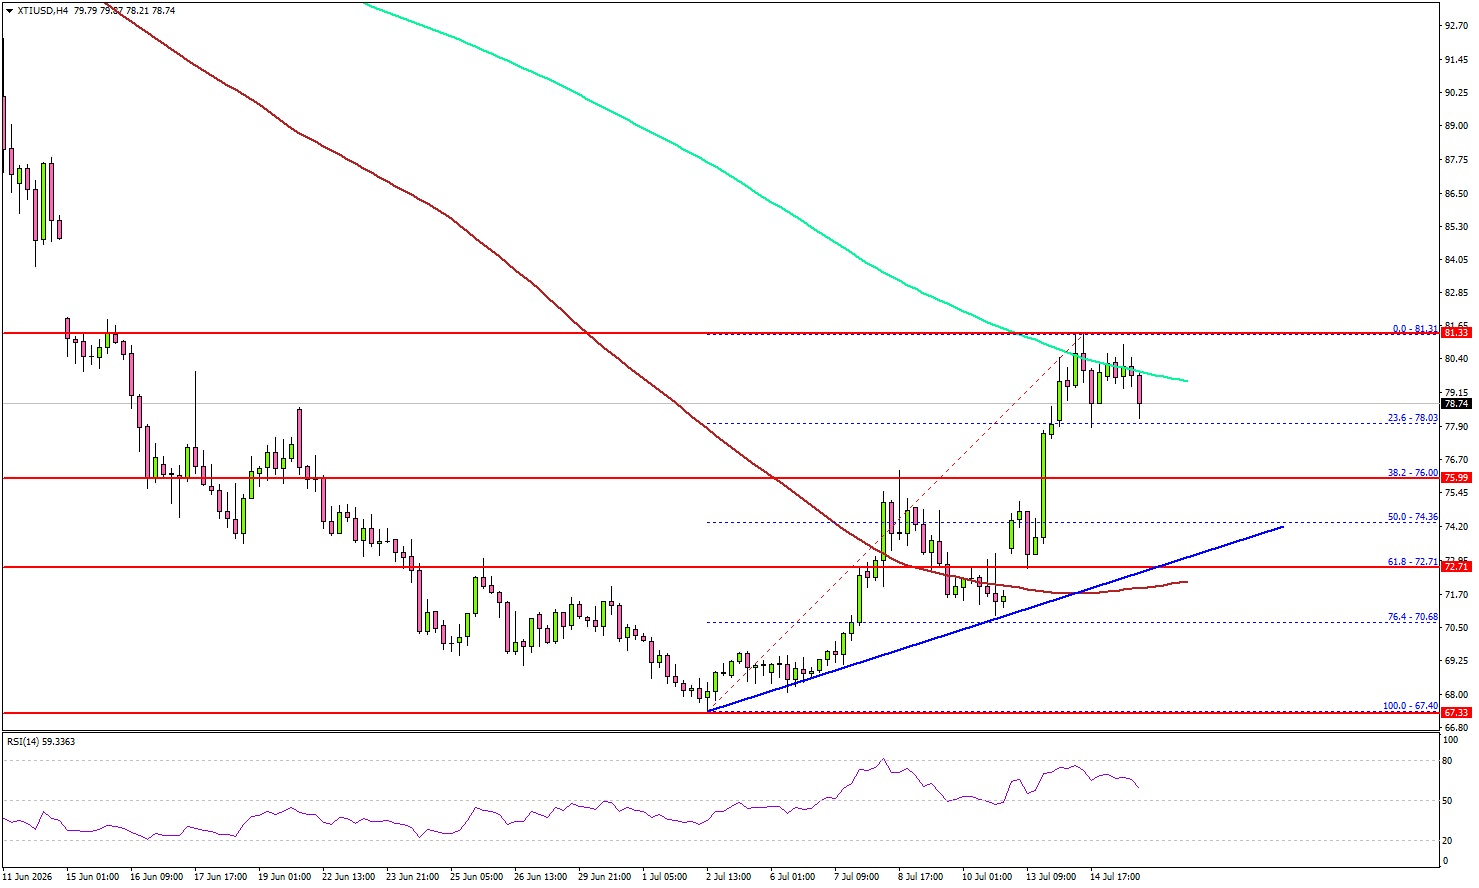
Looking at the 4-hour chart of XTI/USD, the price settled above $76.50 and the 100 simple moving average (red, 4-hour). However, the bears seem to be active near the $81.40 zone and the 200 simple moving average (green, 4-hour).
On the downside, the first major support could be near the $76.50 zone. The next support might be $74.50 or the 50% Fibonacci retracement level of the upward move from the $67.40 swing low to the $81.31 high.
The main support could be near a bullish trend line at $72.80 and the 100 simple moving average (red, 4-hour), below which the price could dive and test $70. A daily close below $70 could open the doors for a larger decline. In the stated case, the bears might aim for a drop toward $65.
On the upside, the price could face resistance at $81.50. The next resistance might be $84.00. The first key hurdle for the bulls could be $85.00. A close above $85.00 might send Oil prices toward $88.00.
Looking at Gold, the price might attempt a recovery wave, but it must settle above $4,120 to continue higher.
Economic Releases to Watch Today
- US Initial Jobless Claims - Forecast 217K, versus 215K previous.
- US Retail Sales March 2026 (MoM) – Forecast +0.2%, versus +0.9% previous.
Fed Beige Book: Economy Expands as Price Growth Slows Across Districts
The Federal Reserve's latest Beige Book painted a picture of an economy that continues to expand while inflation pressures become less widespread, broadly reinforcing the recent message from softer CPI and PPI reports. Economic activity increased at a "slight to moderate pace" in eleven of the twelve Federal Reserve Districts, with contacts generally expecting growth to continue in the months ahead despite elevated uncertainty surrounding fuel costs. Consumer spending edged higher, although several Districts reported that rising fuel prices were weighing on discretionary purchases as households increasingly traded down to cheaper alternatives.
Labor market conditions also remained broadly stable. Employment increased on balance, with five Districts reporting modest to solid hiring gains compared with just one in the previous survey. Wage growth was described as "modest to moderate," while skilled workers continued to be difficult to find in areas such as manufacturing, construction and technical trades. Manufacturers reported modest to moderate production growth, supported by strong demand from data centers, machinery and defense industries, although supply chain disruptions became somewhat more common.
The inflation picture was more encouraging. The Beige Book noted that prices increased at a moderate pace overall, but importantly, "price growth was the same or slower in all Districts" compared with the previous reporting period. Businesses continued to cite higher energy, transportation and raw material costs linked to the Middle East conflict and tariffs, yet several contacts also reported that selling prices were rising more slowly than input costs, squeezing profit margins. While some Districts still expect inflation to remain elevated, others anticipate further moderation as fuel prices ease.
Together with this week's CPI and PPI reports, the Beige Book suggests inflation pressures had continued to cool through late June, although the renewed surge in oil prices means that assessment could face an early test in the months ahead.
Silver (XAG/USD) Elliott Wave Structure Downside Bias Holds While Under $63
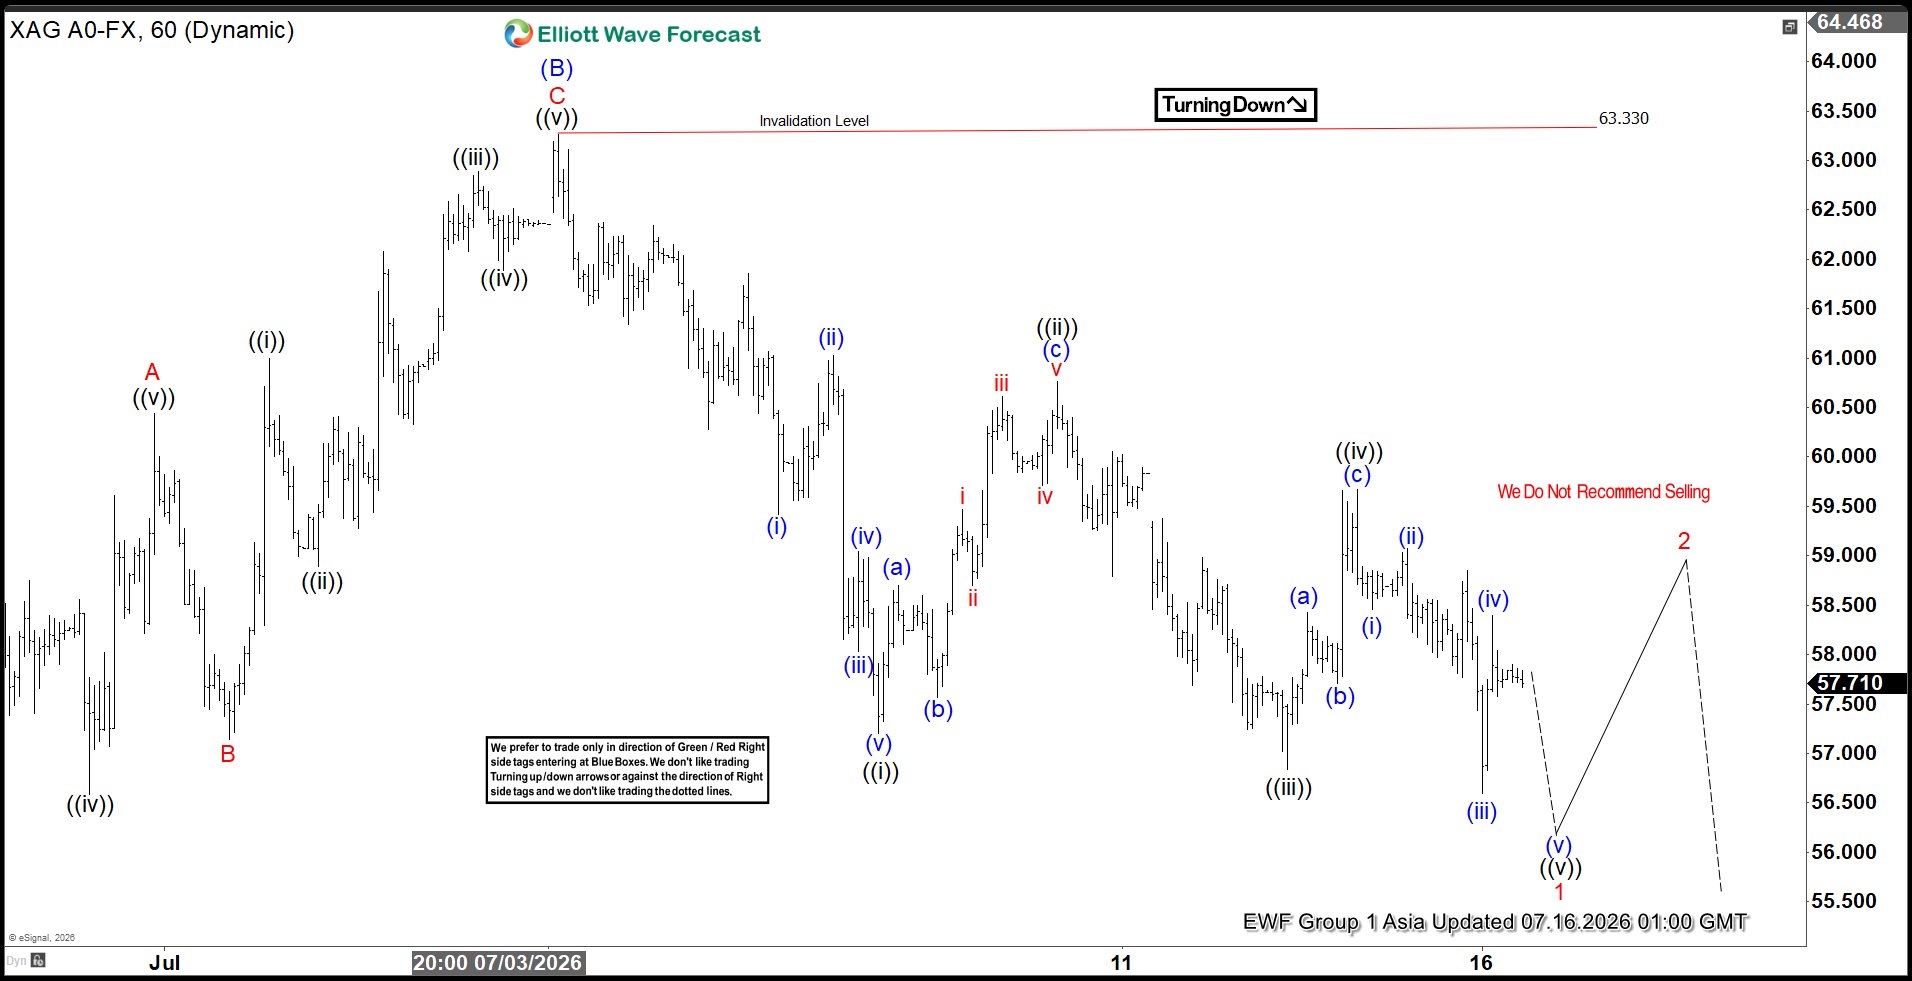
Since forming the all‑time high at $121.6 on January 29, 2026, Silver (XAG/USD) has entered a pronounced correction. The decline has unfolded with a clear Elliott Wave structure, and the ideal extreme target remains the 100% Fibonacci extension at $38.8. Whether this level will ultimately be reached is uncertain, but the broader corrective sequence continues to suggest further downside potential. Short term, the rally to $63.29 marked the completion of wave (B), as illustrated in the one‑hour chart. From that point, the market resumed lower in wave (C), which is progressing with internal subdivision into five waves.
Down from wave (B), wave ((i)) ended at $57.19. A corrective rally in wave ((ii)) terminated at $60.76. The subsequent decline in wave ((iii)) reached $56.84. The rally in wave ((iv)) concluded at $59.67. The structure indicates that wave ((v)) is now approaching completion, which should also finalize the higher degree wave 1 of (C). Once this initial leg is complete, the metal is expected to rally in wave 2, correcting the cycle from the July 6, 2026 high. This correction should unfold in either three or seven swings before the broader decline resumes. In the near term, as long as the pivot at $63.3 remains intact, rallies are expected to fail in corrective sequences. This reinforces the bearish outlook and opens the path for further downside extension.
Silver (XAGUSD) 60-Minute Elliott Wave Chart
XAGUSD Elliott Wave Video:
https://www.youtube.com/watch?v=KiiIU4Zqux8
Eco Data 7/16/26
| GMT | Ccy | Events | Act | Cons | Prev | Rev |
|---|---|---|---|---|---|---|
| 01:00 | AUD | Consumer Inflation Expectations Jul | 4.70% | 5.50% | ||
| 06:00 | GBP | GDP M/M May | 0.10% | 0.00% | -0.10% | |
| 06:00 | GBP | Goods Trade Balance (GBP) May | -18.7B | -23.1B | -26.0B | |
| 09:00 | EUR | Eurozone Trade Balance (EUR) May | -5.0B | 2.8B | -1.3B | 0.8B |
| 12:15 | CAD | Housing Starts Y/Y Jun | 239K | 256K | 261K | 253K |
| 12:30 | USD | Initial Jobless Claims (Jul 10) | 208K | 218K | 215K | 216K |
| 12:30 | USD | Philadelphia Fed Manufacturing Survey Jul | 41.4 | 12.7 | 10.3 | |
| 12:30 | USD | Retail Sales M/M Jun | 0.20% | 0.20% | 0.90% | 1.00% |
| 12:30 | USD | Retail Sales ex Autos M/M Jun | -0.20% | 0.00% | 0.80% | 1.00% |
| 14:00 | USD | Business Inventories May | 0.30% | 0.30% | 0.50% | 0.60% |
| 14:00 | USD | NAHB Housing Market Index Jul | 34 | 35 | 35 | 36 |
| 14:30 | USD | Natural Gas Storage (Jul 10) | 41B | 45B | 61B |
| 01:00 | AUD |
| Consumer Inflation Expectations Jul | |
| Actual | 4.70% |
| Consensus | |
| Previous | 5.50% |
| 06:00 | GBP |
| GDP M/M May | |
| Actual | 0.10% |
| Consensus | 0.00% |
| Previous | -0.10% |
| 06:00 | GBP |
| Goods Trade Balance (GBP) May | |
| Actual | -18.7B |
| Consensus | -23.1B |
| Previous | -26.0B |
| 09:00 | EUR |
| Eurozone Trade Balance (EUR) May | |
| Actual | -5.0B |
| Consensus | 2.8B |
| Previous | -1.3B |
| Revised | 0.8B |
| 12:15 | CAD |
| Housing Starts Y/Y Jun | |
| Actual | 239K |
| Consensus | 256K |
| Previous | 261K |
| Revised | 253K |
| 12:30 | USD |
| Initial Jobless Claims (Jul 10) | |
| Actual | 208K |
| Consensus | 218K |
| Previous | 215K |
| Revised | 216K |
| 12:30 | USD |
| Philadelphia Fed Manufacturing Survey Jul | |
| Actual | 41.4 |
| Consensus | 12.7 |
| Previous | 10.3 |
| 12:30 | USD |
| Retail Sales M/M Jun | |
| Actual | 0.20% |
| Consensus | 0.20% |
| Previous | 0.90% |
| Revised | 1.00% |
| 12:30 | USD |
| Retail Sales ex Autos M/M Jun | |
| Actual | -0.20% |
| Consensus | 0.00% |
| Previous | 0.80% |
| Revised | 1.00% |
| 14:00 | USD |
| Business Inventories May | |
| Actual | 0.30% |
| Consensus | 0.30% |
| Previous | 0.50% |
| Revised | 0.60% |
| 14:00 | USD |
| NAHB Housing Market Index Jul | |
| Actual | 34 |
| Consensus | 35 |
| Previous | 35 |
| Revised | 36 |
| 14:30 | USD |
| Natural Gas Storage (Jul 10) | |
| Actual | 41B |
| Consensus | 45B |
| Previous | 61B |
AUDUSD Wave Analysis
AUDUSD: ⬆️ Buy
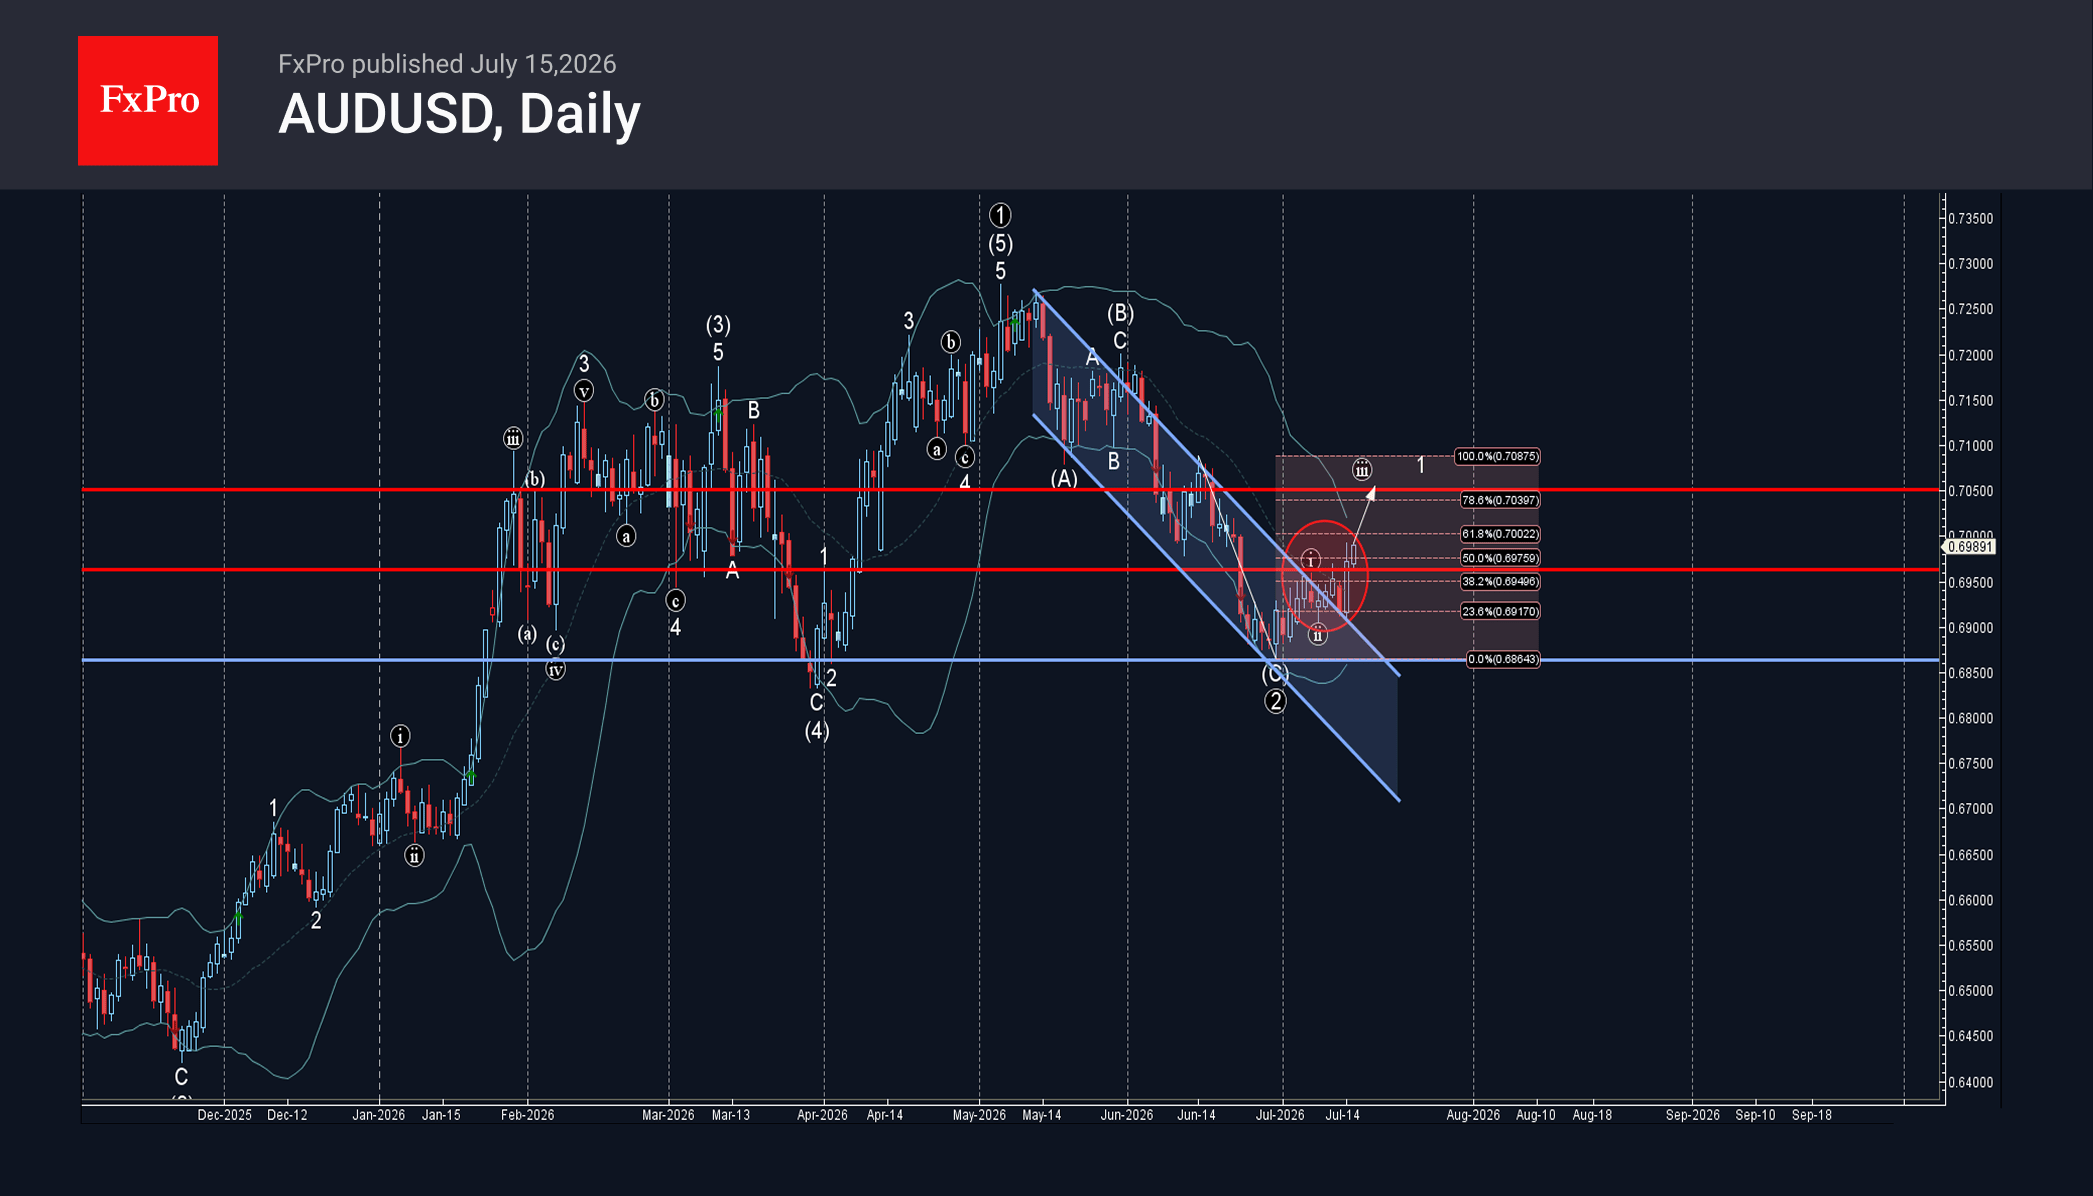
– AUDUSD broke resistance level 0.6960
– Likely to rise to resistance level 0.7050
AUDUSD currency pair recently broke resistance level 0.6960 (which stopped earlier minor impulse wave i) interesting with the 50% Fibonacci correction of the downward impulse from June.
The breakout of the resistance level 0.6960 continues the active short-term impulse wave 1 of the impulse sequence (1) from June.
AUDUSD cryptocurrency can be expected to rise to the next resistance level 0.7050, forecast price for the completion of the active impulse wave 3.
Dow Jones Wave Analysis
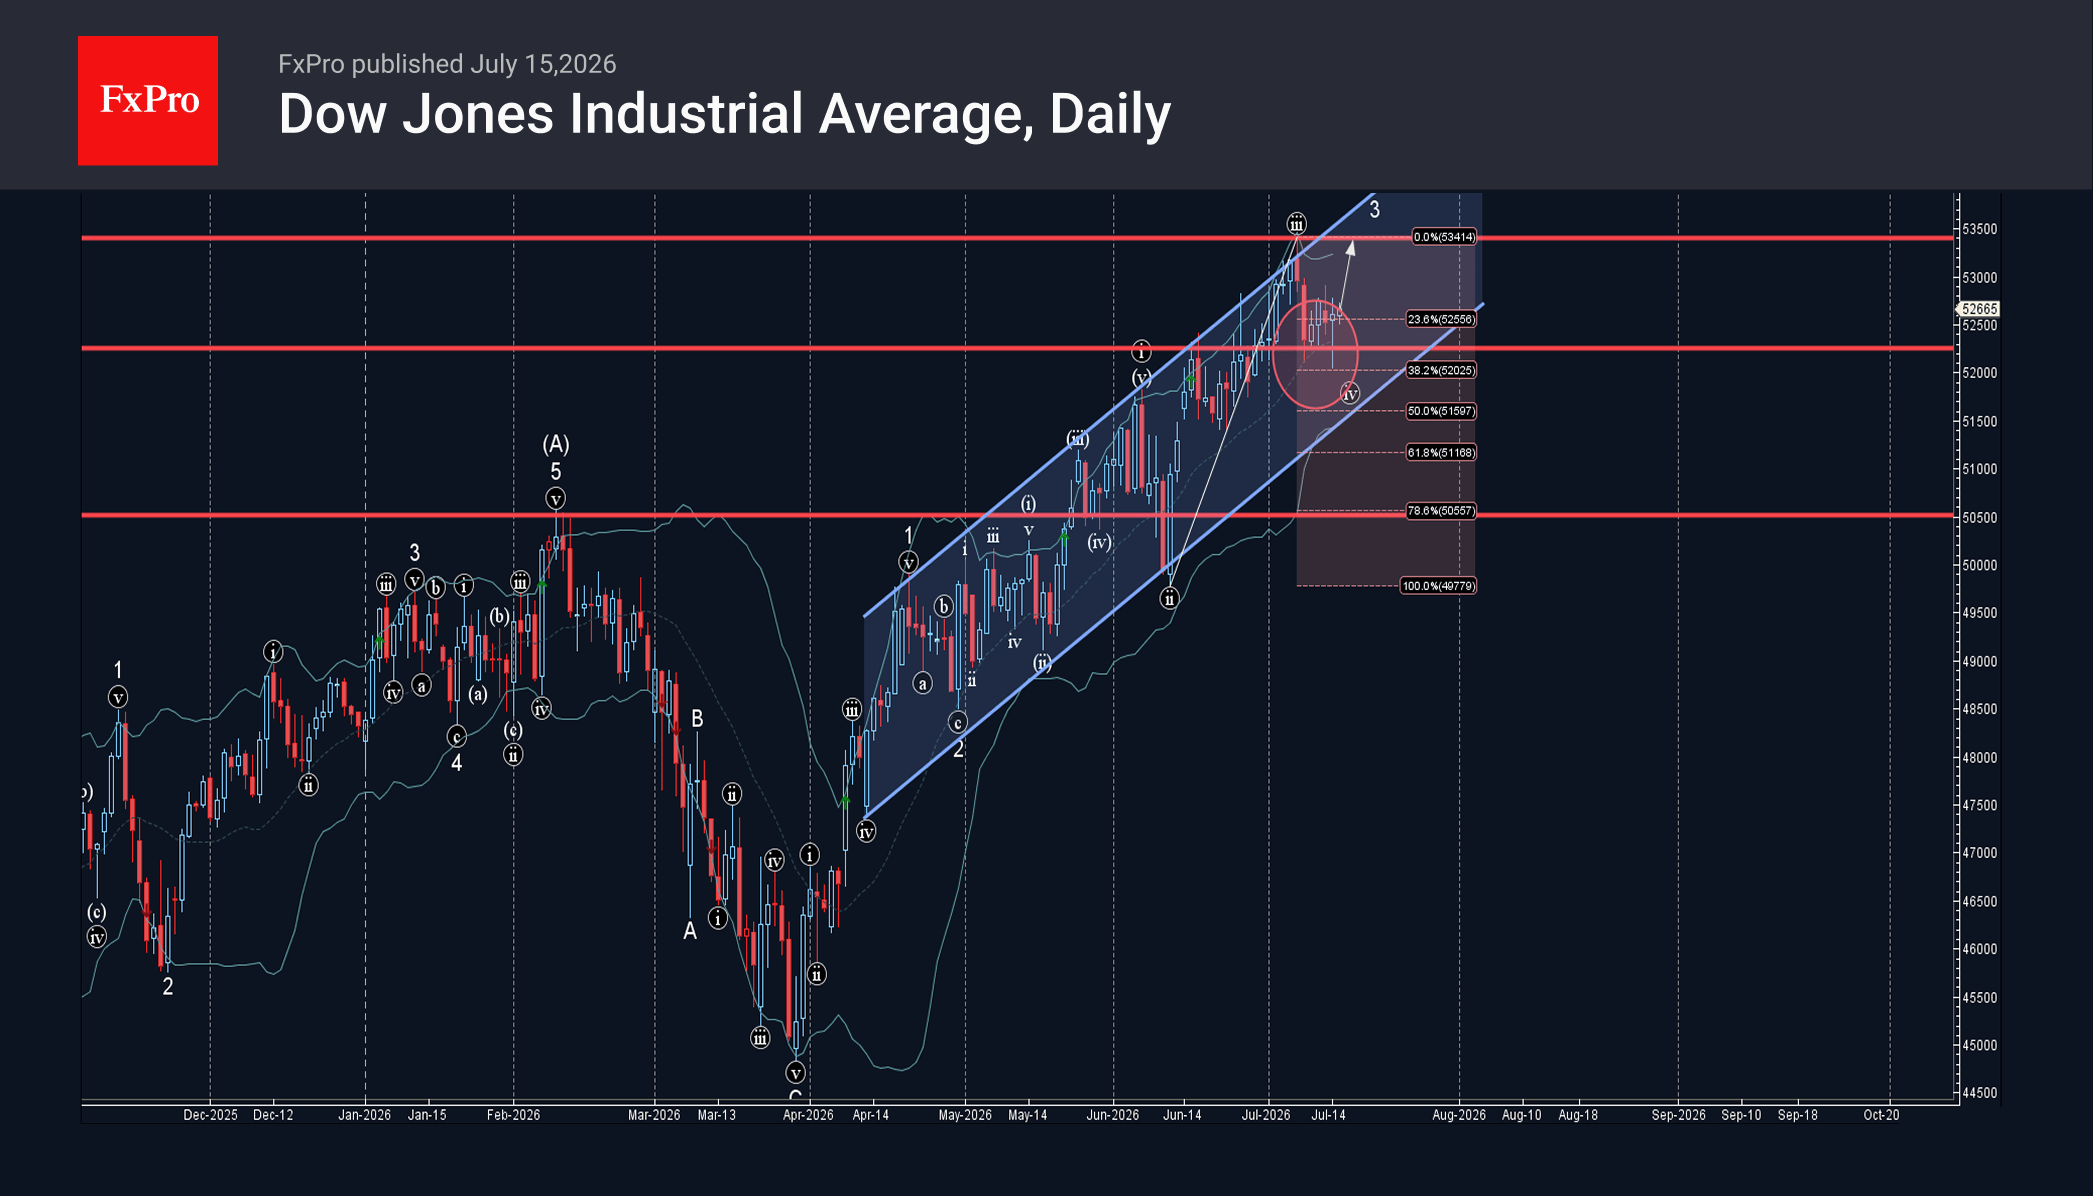
Dow Jones: ⬆️ Buy
– Dow Jones reversed from support zone
– Likely to rise to resistance level 53500.00
Dow Jones Industrial Average index recently reversed up once again from the support zone between the key support level 52250.00 (former resistance from June), 20-day moving average and the 38.2% Fibonacci correction of the upward impulse from June.
The upward reversal from this support zone created the daily Japanese candlesticks reversal pattern Hammer, which stopped earlier wave iv.
Given the clear daily uptrend, Dow Jones Industrial Average index can be expected to rise to the next resistance level 53500.00 (top of the previous impulse wave iii).
Bank of Canada Holds Rates Unchanged, Points to a Modest Rebound in Activity
- The Bank of Canada (BoC) held its policy rate at 2.25%, in line with market expectations. The opening statement noted that "Canada’s economy is showing signs of improvement".
- The Bank pointed to a modest rebound in activity following the weak start to the year saying that labour market conditions "have remained soft, reflecting ongoing economic slack", while stronger exports, solid consumer spending, and a pickup in business investment are expected to lift second-quarter GDP growth to a "solid" 2.5% quarter-on-quarter (annualized).
- The updated Monetary Policy Report characterized Canada’s growth outlook as “broadly unchanged”. It revised down the near-term growth outlook due to the weak first quarter but expects activity to strengthen through the second half of 2026. Looking further ahead, the Bank projects that "excess capacity to be gradually absorbed", supported by exports, government and consumer spending and a recovery in business investment. At the same time, the MPR continued to emphasize elevated uncertainty surrounding the outlook.
- The Bank also noted that the near-term inflation remains elevated due to earlier increases in energy prices and judges that "higher gasoline prices adds roughly 1.4 percentage points (ppts) to inflation in the second quarter of 2026". In its outlook the Bank assumes some war-related costs pressures are passed through to consumers. These effects have a "peak impact of about 0.4 [ppts] on consumer price index inflation in the first quarter of 2027". The Bank expects CPI to "ease gradually in the coming months, returning to around 2% in early 2027". There continues to be limited evidence of broad-based pass-through into other prices, core inflation remains close to the 2% target, and "longer-term inflation expectations remain well anchored".
- Finally, Governing Council reiterated that monetary policy remains well positioned to respond should the outlook materially change. While downside risks from ongoing U.S. trade uncertainty remain, the Bank continues to stand ready to "adjust monetary policy as needed".
Key Implications
- There were no surprises in today’s decision - the Bank of Canada's message remains one of patience. Compared with June, the Bank struck a modestly more optimistic tone on the economy. Economic activity has improved modestly following a weak first quarter, labour market conditions have been soft, and inflation pressures outside of energy remain well contained.
- If the repeated closures and reopenings of the Strait of Hormuz were not having such real economic consequences, they would rival the FIFA World Cup for drama. The latest blockade has pushed oil prices roughly 10% higher, placing some upside risk to the BoC’s oil price assumption underpinning their forecast. With the economy still operating below capacity, and core inflation remaining close to target, we continue to expect the Bank of Canada to remain on hold through the balance of the year.
ECB Preview: ECB on Hold, but Not for Long
- We expect the ECB to keep policy rates unchanged, with the deposit rate at 2.25%, on Thursday 23 July, in line with consensus and market pricing.
- We expect Lagarde to keep full optionality on the future policy rate path, leaving the door open to a September hike, but without pre-committing.
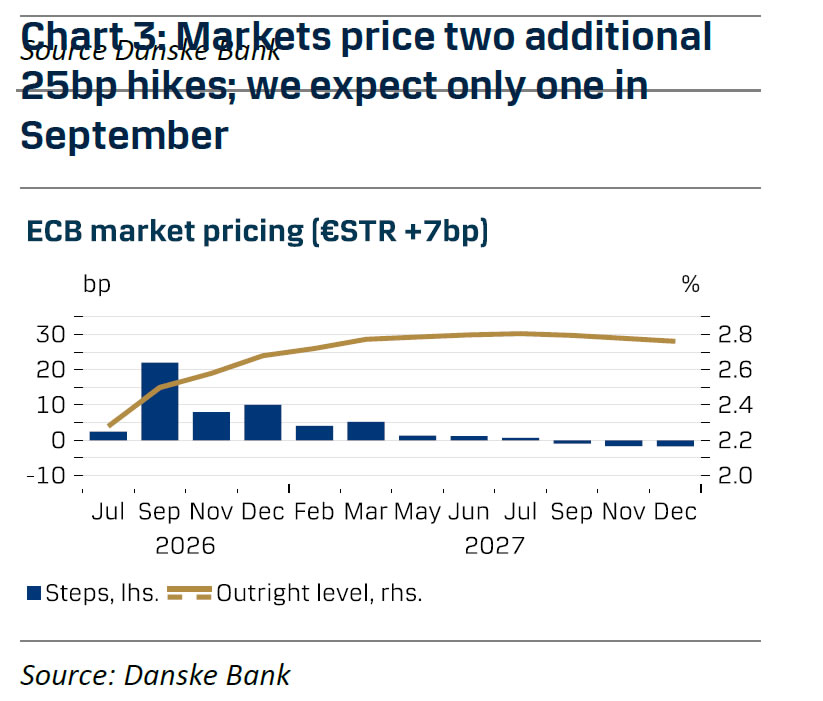
- We expect a final 25bp hike in September, bringing the deposit rate to 2.50%.
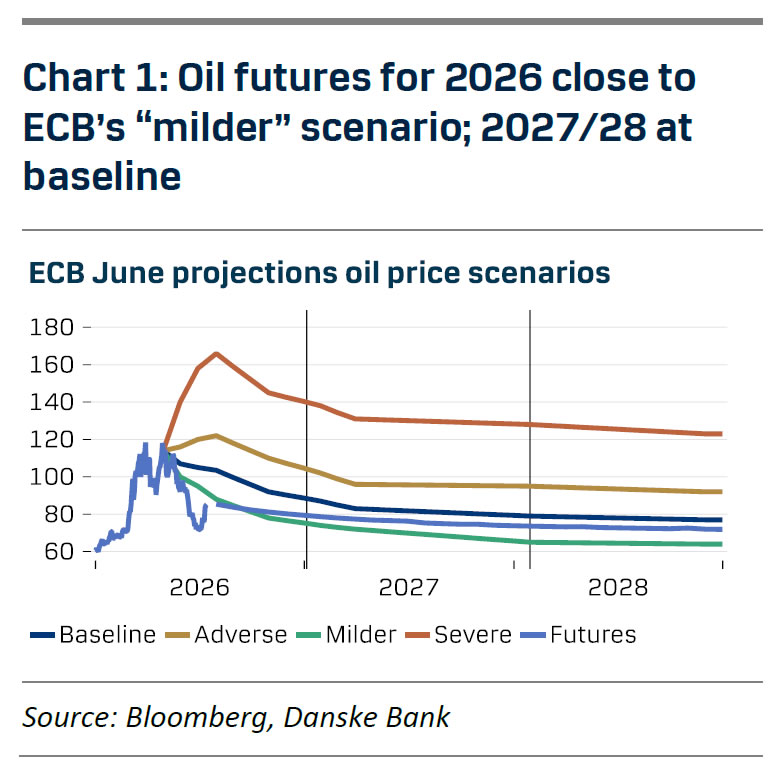
We expect the ECB to leave policy rates unchanged at the July meeting, in line with market pricing and consensus. Since the June meeting, inflation has surprised to the downside, including beyond energy, and near-term oil futures have declined even after the recent end to the ceasefire between the US and Iran. These developments, combined with broadly anchored medium-term inflation expectations, give the ECB the option to wait for new staff projections at the September meeting before potentially hiking policy rates again.
Focus during the meeting will be on signals about the future rate path. We will be particularly attentive to the risk assessment of the inflation and growth outlook. The ECB views inflation risks as tilted to the upside and growth risks as tilted to the downside, but Lagarde stated on 1 July that they are now "probably more balanced". Yet, given the recent escalation of the war in Iran and the lack of new staff projections, we do not expect the risk assessment to be changed.
We expect Lagarde to keep full optionality on the future policy rate path, leaving the door open to a September hike, but without pre-committing. At the Sintra conference, she reiterated that the ECB has set aside forward guidance and instead provides "framework guidance" on its reaction function. With markets currently pricing in 22bp worth of ECB hikes at the September meeting, and given the high uncertainty around the future path of energy prices, we do not believe the ECB has an incentive to rock the boat.
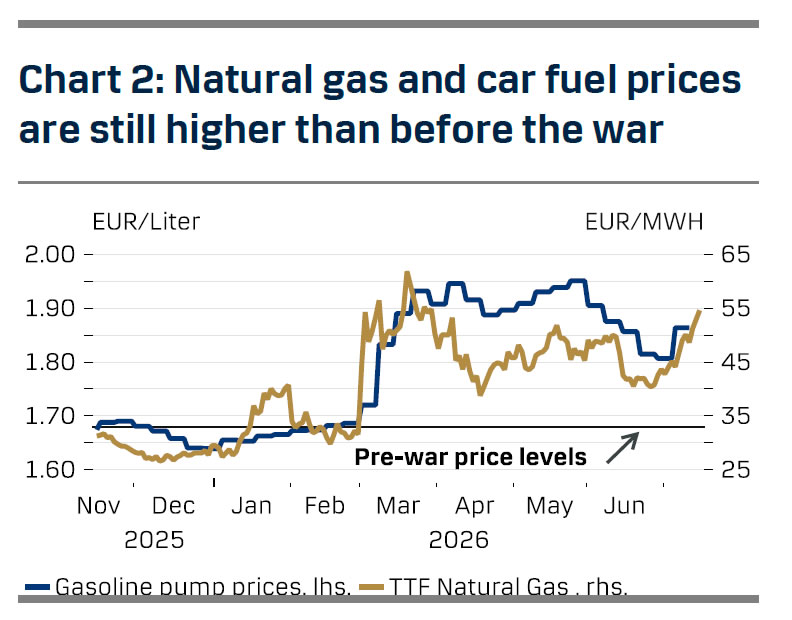
Our baseline remains that the ECB will deliver a final 25bp hike at the September meeting. The bias in the GC remains hawkish, even as it is slightly more balanced now compared to June. While crude oil futures have declined the prices of refined oil products and natural gas remain above pre-war levels, by 10% for gasoline and 170% for natural gas, respectively. Consumer inflation expectations also remain elevated, and markets are pricing inflation to average 3.25% y/y for the rest of 2026 and 2.65% y/y in 2027. Having said that, growth has been weaker than expected in Q2, and the June inflation print was soft, with no signs yet of indirect effects from the energy shock. At the same time, there are no signs of second-round effects, and the labour market is weakening, so we do not expect more than one additional hike and we then see the ECB cutting the deposit rate back to 2.00% next year.
Sunset Market Commentary
Markets
During the previous weeks, interest rate markets were forced into some sharp U-turns as the outlook/expectations on energy supply (and supply of other commodities) still proved highly uncertain/unpredictable even after the US and Iran signed a Memorandum of Understanding (MoU) last month. Even as several key issues still had to be solved, markets (and multiple central bankers) were inclined to believe that the worst of energy supply shock was over. The Brent oil price dropped to $70 p/b and money markets two weeks ago moved to a scenario where one additional interest rate hike in EMU and probably also in the US should suffice to cover inflationary risks. However, a flaring up of the military confrontation between the US and Iran over the control of the passage through the Strait of Hormuz, over the previous week showed that it is too early to position for a benign outcome on supply disruptions related to Hormuz. EMU and US short-term yields jump to or even beyond the highest levels since the start of the conflict. Markets again embraced a scenario where rates mostly likely had to be raised and had to stay at a higher level for longer. An unexpectedly mild US June CPI release published yesterday again triggered some hefty swings at the short-end of the (US) curve. US ST yields eased as a Fed rate hike at the July meeting probably isn't necessary. Even so, Fed Chair Warsh in his semi-annual appearance before the House indicated that there is plenty of work to do as the Fed has no tolerance for persistently elevated inflation. The June inflation release bought the Fed time, but the debate on the need for potential further tightening continues, especially as long as the passage through Hormuz remains as 'complicated' as it currently is. Even after yesterday's correction, both US and EMU markets still tend to discount some kind of higher for longer scenario with two additional ECB rate hikes discounted by H1 2027. In the US, 60% for a similar move is priced. EMU short-term yields (2-y swap 2.95%, Bund 2-y 2.75%) are only a whisker away from the post-war peak levels. At 4.22%, the picture for the US 2-y yield basically isn't much different. For yields at the long end of the curve, the downside also looks well protected with the US 30-y easily holding north of the 5% and the 10-y near 4.6%. German LT yields (30-y 3.65% and 10-y 3.14%) even are not that far away from multi-year peak levels with higher real yields/(fiscal?) risk premia probably playing at the background. This summer, especially at the short-end of the curve more erratic, event driven swings might still occur as headlines from the Middle East are at risk of staying highly inconclusive, if not contradictory. In a daily perspective, today was a 'mini-copy' of yesterday's price action related to the US CPI. US and EMU yields gained a few bps in the run-up to the June US PPI release. At -0.3 M/M and 5.5% Y/Y the final demand headline PPI measure also printed materially softer than expected. The core (ex-ex food and energy) at 0.2% M/M and 4.7% Y/Y also was on the lower side of expectations. After initially rising a few bps, the US 2-y yield currently again cedes 3 bps. The 30-y drops 1 bp. EMU/German yields still mostly trade marginally higher (1-2 bps across the curve). Brent oil ($85 p/b) trades marginally lower in a daily perspective even as US President Trump launched and indicated more military action against Iran. Still more directionless trading in the major FX cross rates with the dollar losing marginally (DXY 110.8; EUR/USD at 1.143).
News & Views
Final Polish inflation numbers confirmed the initial outcome for June: -0.5% M/M and 2.5% Y/Y (from 3.1% in May). Price pressure is expected to pick up in July and August though as the recent fuel tax normalization comes into effect. Since mid-June, the standard excise duty on fuels has been reinstated, while from July the authorities have moved to restore the standard 23% VAT rate and removed administratively imposed fuel price caps. This expected inflation pick-up contrasts with NBP governor Glapinski's suggestion end last week to file a motion for a 25 bps rate cut after the summer break. It's clear that not everybody inside the MPC stands by that idea. NBP Kotecki said that it is too early to declare support for or opposition to a possible proposal to cut rates. He does consider the rate hike discussion over. That's unlike his colleague Zarzecki who yesterday said that a rate hike is more likely than a rate cut as the NBP's next move (in Q1 2027). The Polish zloty hit its weakest level against the euro (4.35) since November 2024 on Glapinski's comments. The pair consolidates since then, currently changing hands around 4.33. Polish money markets see stable policy rates as the most likely outcome for the next 12 months.
Fed’s Williams: Five Reasons Inflation Should Continue to Ease
Markets expecting another Federal Reserve rate hike found little support from New York Fed President John Williams, who argued that inflation has likely peaked and outlined five reasons why price pressures should continue easing without further policy tightening. "There are encouraging reasons to expect that inflation has peaked and should edge down in coming quarters," Williams said, adding that he expects inflation to slow to around 3.25% by year-end before continuing "on a glide path toward our 2 percent goal in 2027 and land on target in 2028."
Williams argued that the main drivers behind this year's inflation surge are already beginning to fade. He said there should not be "significant additional impulse" from tariffs because expiring duties are largely being replaced rather than substantially expanded. On energy, Williams maintained that the oil-price spike has "likely peaked and will come down closer to levels seen before" the recent conflict, while AI-related investment should become less inflationary as supply catches up with demand and current "imbalances" gradually recede. He also emphasized that the labor market is "solid and stable" rather than overheating, and that longer-term inflation expectations remain "well anchored," reducing the risk that temporary price shocks become embedded in broader inflation.
Taken together, Williams' framework suggests the Federal Reserve has room to remain patient despite heightened geopolitical uncertainty. "The current stance of monetary policy is well positioned" to restore inflation to target, he said, arguing that restrictive policy can continue working without additional tightening for now. Whether that outlook proves correct will depend largely on whether higher oil prices persist as the US-Iran conflict evolves. If energy prices retreat as Williams expects, his case for continued disinflation strengthens considerably. If crude remains elevated or climbs further, markets may instead gravitate toward the more hawkish view.