

Sample Category Title
USD/JPY: Battling at the Top of the Triangle
On 3 July, Japan's Finance Minister, Satsuki Katayama, stated that the Ministry of Finance remains in close contact with US authorities regarding developments in USD/JPY as the yen traded near its weakest level in almost 40 years. Similar verbal warnings have become increasingly common whenever the pair approaches the 162.00 area, although no direct intervention has been announced so far.
At the same time, weaker-than-expected US inflation data added pressure to the dollar. On 14 July, June's Consumer Price Index came in below forecasts, significantly reducing expectations of a Federal Reserve rate hike at the July meeting and pushing US Treasury yields lower. The combination of increasingly cautious rhetoric from Japanese officials and softer US inflation expectations may keep USD/JPY range-bound, preventing buyers from establishing a sustained break above its multi-decade highs.
Technical Picture
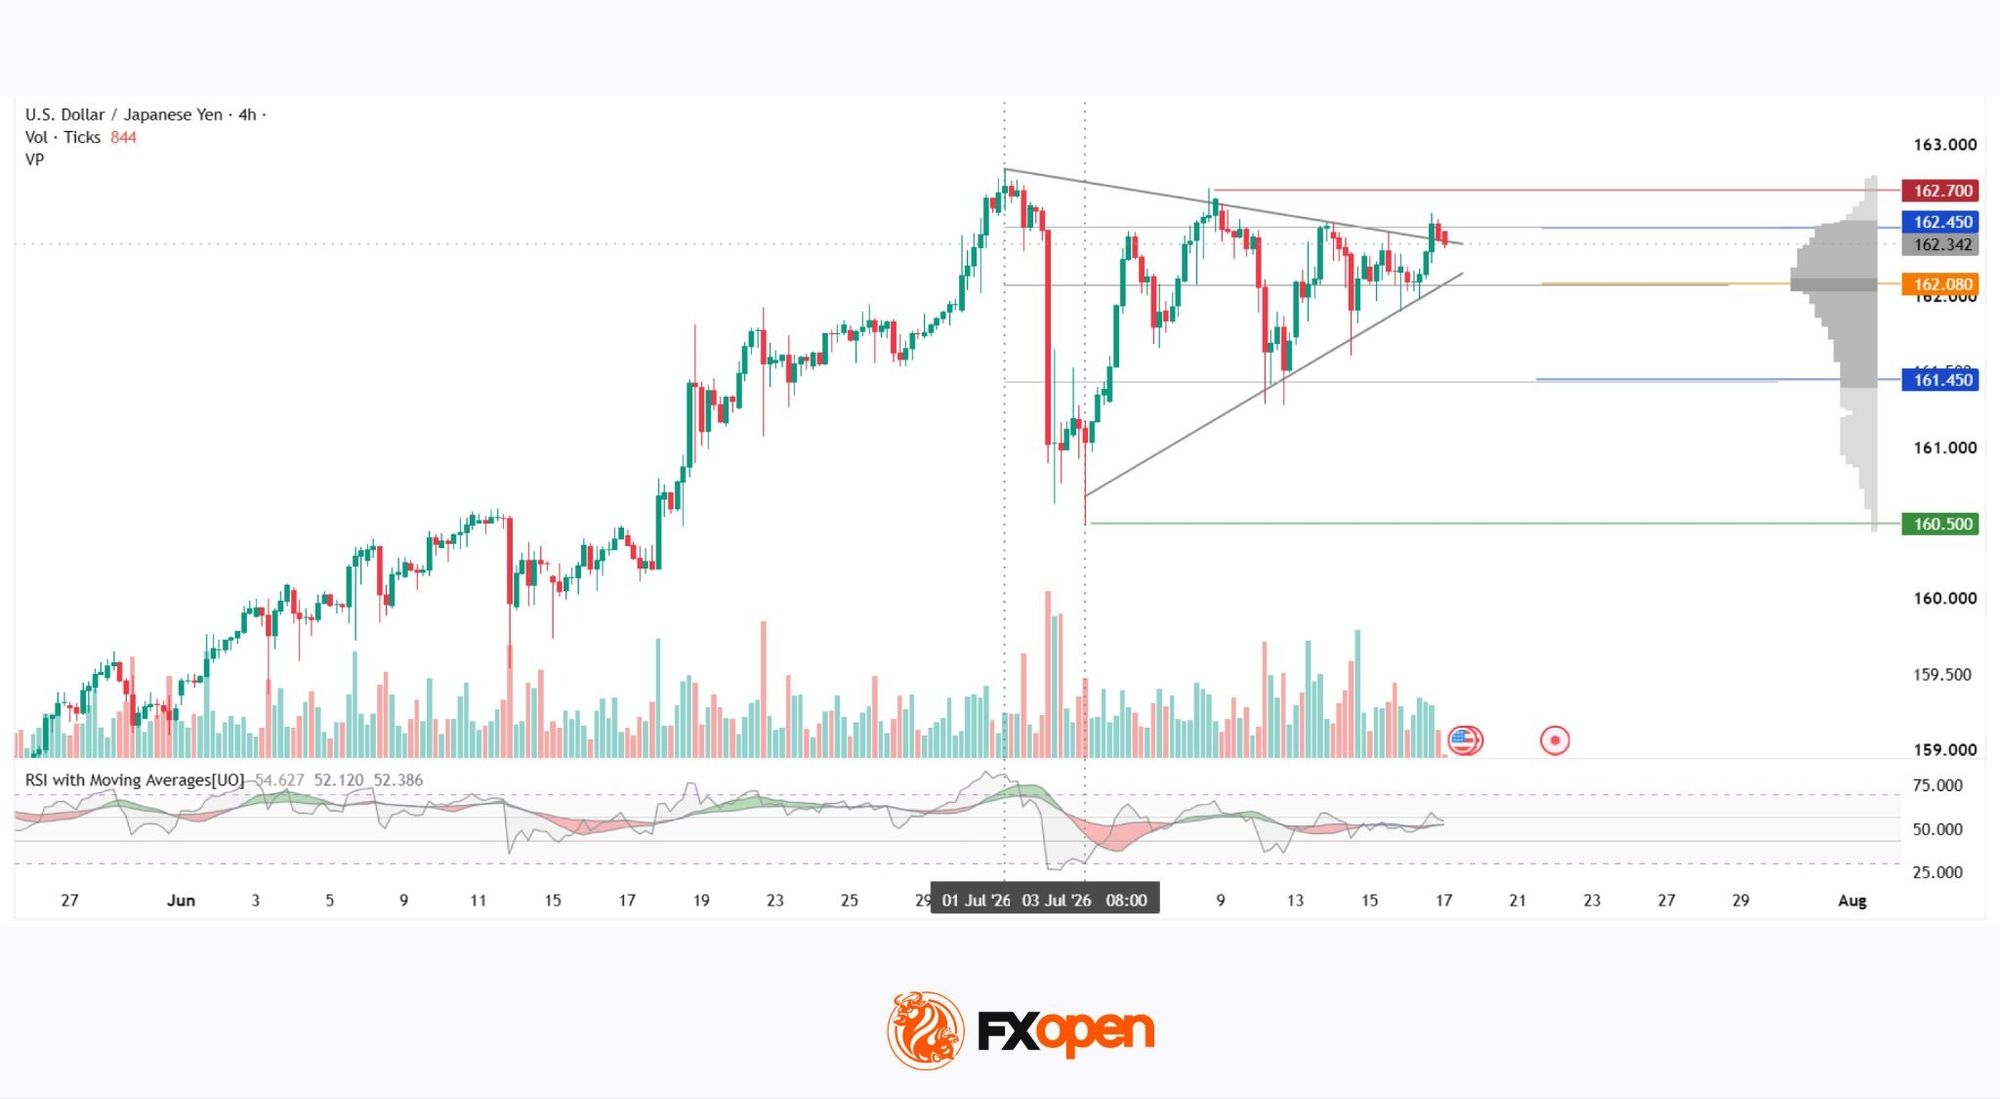
On the four-hour chart, USD/JPY advanced steadily throughout June, reaching a peak near 162.80 on 1 July. A sharp reversal followed, with the pair dropping rapidly to the 160.50 area, where the green support zone is currently located. The decline coincided with market speculation about a possible currency intervention by the Japanese authorities.
After rebounding from the 3 July low, the pair began forming a triangle pattern. Price is now testing the upper boundary of the formation, although the attempted upside breakout is currently being capped by the upper edge of the current volume profile at 162.45. Just above this level lies the red resistance zone at 162.70.
The Point of Control (POC) is located around 162.08 and could become a key magnet if the pair moves back towards the lower part of the range, where two additional important technical levels are visible: the lower boundary of the volume profile at 161.45 and the green support zone at 160.50.
Volume behaviour also deserves attention. The break above the triangle's upper boundary was not supported by strong bullish volume, indicating limited buying conviction and increasing the risk that the breakout could soon reverse. Meanwhile, the RSI + MAs oscillator stands at 54, 52 and 52 respectively, with all three readings remaining firmly in neutral territory, reinforcing the current lack of directional conviction.
Key Takeaways
USD/JPY is testing the upper boundary of its current market structure while momentum indicators remain neutral. The lack of bullish volume at the breakout adds uncertainty, while the Point of Control around 162.08 could be the key reference level if price begins to move lower.
Trade over 50 forex markets 24 hours a day with FXOpen. Take advantage of low commissions, deep liquidity, and spreads from 0.0 pips (additional fees may apply). Open your FXOpen account now or learn more about trading forex with FXOpen.
This article represents the opinion of the Companies operating under the FXOpen brand only. It is not to be construed as an offer, solicitation, or recommendation with respect to products and services provided by the Companies operating under the FXOpen brand, nor is it to be considered financial advice.
Sunrise Market Commentary
Markets
This week's benign US CPI and PPI (June) figures didn't resonate in Fed rhetoric. Dallas Fed President Logan (2026 FOMC voter) called for modestly higher interest rates as inflation "does not appear to be on track all the way back to 2%" while upside risks remain. Kansas City Fed Schmid thinks it is premature to put too much weight on one data point in an echo of Fed Chair Warsh's suggestion earlier this week that it isn't mission accomplished. Schmid also threw the new rise of energy prices in the mix. Fed vice-chair Jefferson currently believes that the Fed is well-positioned, but it could be appropriate to reconsider that stance if inflation doesn't ease. Markets took the data rather than the Fed speak into stride though with Fed July rate hike bets falling from almost 50% at the start of the week to currently only 10%. A 25 bps move is now fully discounted by the December instead of the September FOMC meeting. Today's eco calendar contains import/export prices, housing data, industrial production figures (all June) and Michigan consumer confidence (July) but they won't move the market needle as the Fed enters its communications blackout period.
The situation in the Middle East and general risk sentiment take center stage in the run-up to central bank gatherings (starting with ECB next week). Relentless military strikes between the US and Iran slowed Hormuz traffic to a trickle and pushed energy prices up. Brent crude spiked lower this morning on headlines that China and Pakistan called on the US and Iran to cease fire and resume talks. The move didn't last though as it was followed by more (intercepted) Iranian strikes directed at Jordan and Oman. Risk of escalation remains high with the axis of resistance threatening to shut down Bab al-Mandab if the US hits Iranian energy installations. US stock markets look somewhat more vulnerable with especially momentum stocks in the defensive. The Nasdaq yesterday lost 1.5%. Risk aversion spreads to Asia this morning with the likes of China, Taiwan and Japan ceding 3% to 6%. South Korean bourses are closed. The US dollar is again better bid after EUR/USD bumped into first minor technical resistance earlier this week at 1.1473/1.15.
News & Views
The IMF in its latest annual so-called Article IV report warned the UK and the incoming prime minister Burnham about the dire budgetary situation and stressed the need to deliver on the promised fiscal tightening. "[…] the authorities should be very selective in accommodating new demands and reprioritise, while sticking to the deficit reduction plan." Burnham in recent weeks had signaled the cost of living for households to be one of his early priorities and signaled "some room" for movement on tax. But the IMF said the UK should focus on reallocating resources across departments instead of increasing total spending. Short term measures such as ending VAT exemptions or raising tax on capital gains can help fill the current hole. But with taxes already set to climb to a historic high, the UK in the longer-term needs to address the spending side of the question. Burnham is set to take over as prime minister early next week.
The European Commission will release an overhaul to the banking rulebook today. Among the changes are proposals that deal with the "output floor", which sets a limit on how far banks can use their internal models to reduce capital requirements. The draft also includes measures to address what the EC calls "excessive" sovereign exposure, along with incentives to encourage diversity in those bond portfolios. What is lacking in the overhaul, though, is a substantial change to the actual capital requirement, which some in the industry say is so high that it gives them a competitive disadvantage compared to peers including in the US.
Ethereum Leads Bitcoin Again. Is Crypto Finally Turning the Corner?
Ethereum has emerged as the standout performer in the cryptocurrency market this week after softer-than-expected US inflation data improved appetite for risk assets. While both Bitcoin and Ethereum extended their near-term rebounds following June's CPI surprise, Ethereum has pulled decisively ahead. Over the past five trading days, Ether has climbed around 7%, compared with Bitcoin's roughly 2% gain. The ETH/BTC ratio has also rebounded from a 10-month low near 0.02737 reached around June 17 to around 0.0297, an advance of roughly 8-9%. The divergence has revived speculation that cryptocurrencies may finally be emerging from nearly a year of persistent selling.
There is historical precedent supporting that optimism. As Yahoo Finance reported earlier this week, Fundstrat digital asset strategist Sean Farrell argued that Ethereum is becoming "increasingly compelling" and noted the historical precedent for ETH leading broader crypto recoveries." During the 2022 bear market, Ethereum began outperforming Bitcoin several months before Bitcoin ultimately established its cycle bottom. If history repeats, Ethereum's recent leadership could prove to be an early signal that sentiment across digital assets is beginning to stabilize after months of weakness.
Still, drawing that conclusion today would be premature. Both Bitcoin and Ethereum remain well below their previous cycle highs despite this week's gains. Bitcoin is still roughly 50% below its October record peak, while Ethereum remains down around 60% from its August 2025 high near 4,868. Against declines of that magnitude, a 7% rally over five trading days is better viewed as a meaningful short-term recovery than confirmation of a new bull market. The softer US CPI has eased concerns over aggressive Fed tightening, but it has yet to fundamentally change the macro backdrop that weighed on cryptocurrencies throughout the past year.
More importantly, this market cycle differs from previous crypto recoveries because speculative capital now has a formidable alternative. In 2022, improving macro conditions naturally encouraged investors back into digital assets. Today, however, cryptocurrencies are competing with the powerful AI-driven rally in global equities. As semiconductor stocks, AI infrastructure companies and related technology names continue attracting capital, crypto is no longer simply competing against risk aversion—it is competing against one of the strongest growth narratives in financial markets. Until capital begins rotating away from AI beneficiaries, cryptocurrencies may struggle to attract the sustained inflows needed for a broad-based bull market.
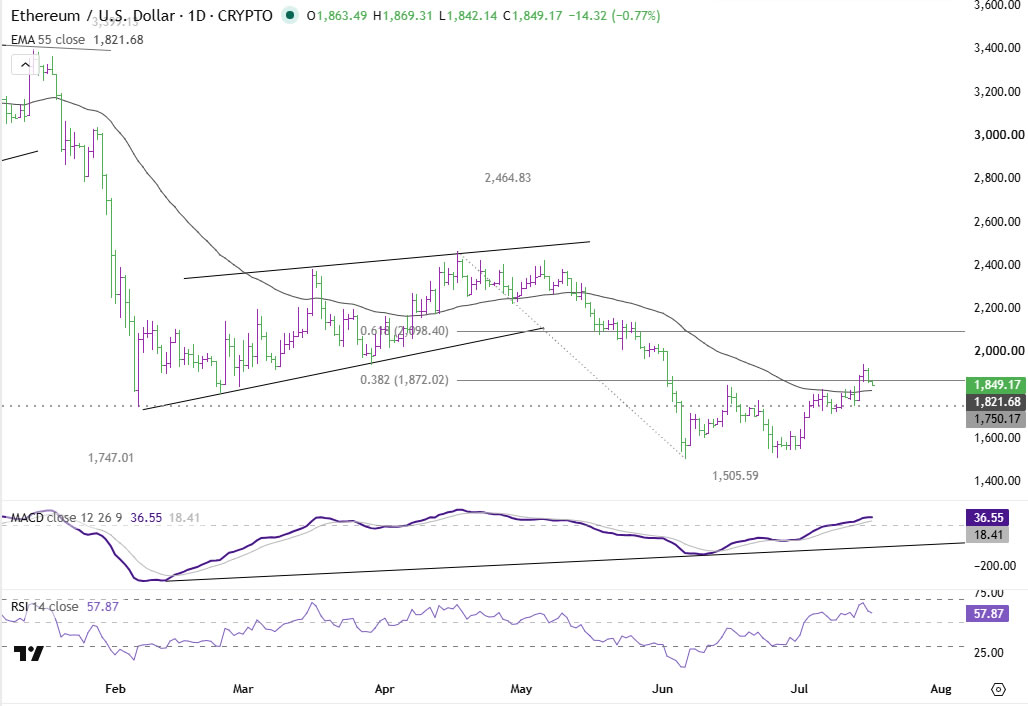
Technically, Ethereum's outlook is nevertheless improving. Its decisive break above 55 D EMA, now around 1,821.75, suggests the decline from 2,464.83 to 1,505.06 has completed. As long as support at 1,750.17 remains intact, further gains toward 61.8% retracement at 2,098.40 are favored, even as a correction. Sustained move above that level would strengthen the argument that a more durable trend reversal is developing and shift attention toward resistance at 2,464.83 for confirmation.
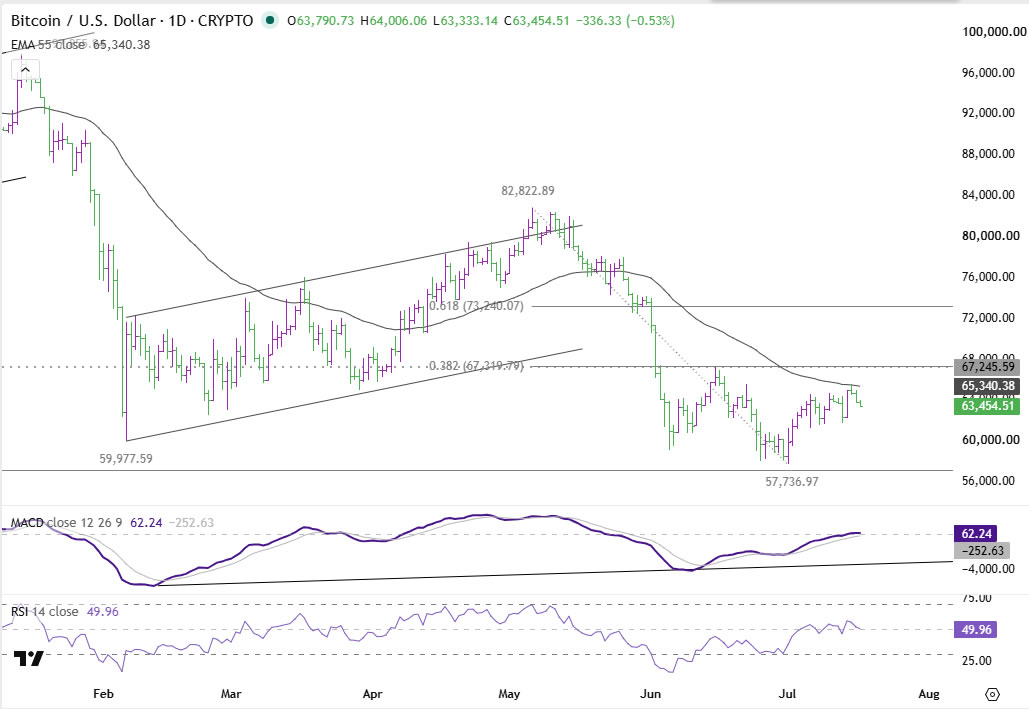
Bitcoin's technical picture is considerably less constructive. It remains capped by both its 55 D EMA near 63,516 and 38.2% retracement of 82,822 to 57,736 at 67,319, suggesting further range trading is likely, with risks still tilted toward a break of 57,736 low before a lasting bottom forms.
The current technical setup therefore favors continued Ethereum outperformance over Bitcoin in the near term. But that remains a tactical rather than structural view. A genuine crypto recovery would require both stronger chart confirmation—Ethereum clearing 2,098.40 and Bitcoin reclaiming its 55-day EMA—and a broader shift in macro capital flows. Until cryptocurrencies regain competitiveness against the AI-equity trade for speculative investment, Ethereum's leadership should be viewed as an encouraging early signal rather than definitive evidence that a new crypto bull market has begun.
Fed’s Jefferson Keeps Door Open to Rate Hike if Inflation Fails to Cool
Federal Reserve Vice Chair Philip Jefferson kept the door open to another interest rate hike if inflation fails to improve, while maintaining that current policy remains appropriate for now. Speaking in prepared remarks at the Stanford Institute for Economic Policy Research on Thursday, Jefferson said the Fed's current stance "should continue to support the labor market while allowing inflation to resume its decline toward our 2% target." However, he added that "in a scenario where actual inflation does not start to cool down soon, I believe that it could be appropriate to reconsider our current policy stance," underscoring that further tightening has not been ruled out.
Still, Jefferson's remarks focused heavily on upside inflation risks. He warned that "the quick succession of shocks raises the risk that inflation becomes entrenched and inflation expectations become unanchored," highlighting the combined effects of tariffs, Middle East tensions and higher energy prices. Jefferson said the key question is whether the recent rise in oil prices feeds into longer-term inflation expectations and results in a persistent increase in inflation.
Jefferson also highlighted artificial intelligence as both a potential source of productivity gains and a near-term inflation risk. While AI could eventually boost supply and ease price pressures, he warned that "optimism about AI may boost investment and consumption today, even before these productivity gains fully materialize." His remarks suggest the Fed remains inclined to keep rates steady for now, but policymakers are prepared to tighten further if inflation fails to resume its path toward the 2% target.
Fed’s Logan Becomes First Official to Publicly Call for Rate Hike Under Warsh
Dallas Fed President Lorie Logan became the clearest advocate yet for renewed monetary tightening, becoming the first Fed official to publicly support another interest rate increase since Kevin Warsh became chair. In prepared remarks delivered in Houston on Thursday, Logan argued that "modestly higher interest rates would better balance the outlook and risks" because inflation remains well above target despite June's softer CPI report. She said inflation "has been too high, for too long," and "does not appear to be on track all the way back to 2%."
Making the case for pre-emptive action, Logan argued that policy is not sufficiently restrictive to ensure inflation returns sustainably to target. "The labor, consumption and financial data indicate that monetary policy is not restraining the economy," she said. Logan warned that waiting too long would increase the eventual economic cost of restoring price stability, saying, "Better modest restriction now than severe restriction later." She also downplayed the significance of the latest inflation report, describing a return to 2% under current conditions as "more a hope than a likelihood."
Logan identified both geopolitical and structural factors that could keep inflation elevated. She warned that renewed fighting in the Middle East threatens to push energy prices higher again, while the boom in AI investment is already lifting demand across the economy. Although AI could eventually improve productivity, she said "the potential size and timing of those gains are uncertain," whereas "the demand effects are here already." Logan's comments underscore growing differences within the FOMC ahead of the July 28-29 meeting and increase the likelihood of a more contentious policy debate even if the committee ultimately leaves rates unchanged.
Fed’s Schmid Warns Inflation Is Not ‘Intrinsically Transitory’ Despite Soft CPI
In a speech on Thursday, Kansas City Fed President Jeff Schmid cautioned against drawing premature conclusions from this week's softer-than-expected June CPI report, arguing that inflation remains too high and price pressures continue to be broad-based. While stopping short of calling for another interest rate hike, Schmid said current inflation, running at roughly double the Fed's 2% target, remains "concerning" given the continued resilience of the labor market. He stressed that policymakers should not overreact to a single month's data, warning that "it would be premature to put too much weight on a single data point relative to recent trends."
Schmid delivered one of his strongest rebuttals yet to the view that inflation will naturally fade over time. "I am uncomfortable ever assuming that a burst of inflation is likely to be temporary," he said, adding that "inflation shocks are not intrinsically transitory." He also warned that recent relief from lower energy prices may prove short-lived, noting that "with the price of oil once again rising, it is uncertain how persistent any relief on energy will be." His remarks reinforce the Fed's preference to see sustained evidence of easing inflation before considering any shift in policy.
Beyond the economic outlook, Schmid also defended the importance of clear communication from policymakers at a time when Fed Chair Kevin Warsh has advocated a more restrained approach to forward guidance. "Independence demands accountability," Schmid said, arguing that the central bank must remain transparent about how it reaches policy decisions to preserve public confidence and avoid perceptions of political influence. His comments suggest that while the Fed may speak less about the future path of interest rates, officials will continue explaining the reasoning behind their decisions.
USD/JPY Breakout Watch: Bulls Target Higher Ground
Key Highlights
- USD/JPY started a fresh increase above 162.00 and 162.20.
- A major bullish trend line is forming with support at 161.90 on the 4-hour chart.
- EUR/USD again failed to gain strength for a move above 1.1475.
- GBP/USD rallied above 1.3450 before it faced sellers near 1.3560.
USD/JPY Technical Analysis
The US Dollar remained supported above 161.50 against the Japanese Yen. USD/JPY gained strength for a fresh move above 162.00.
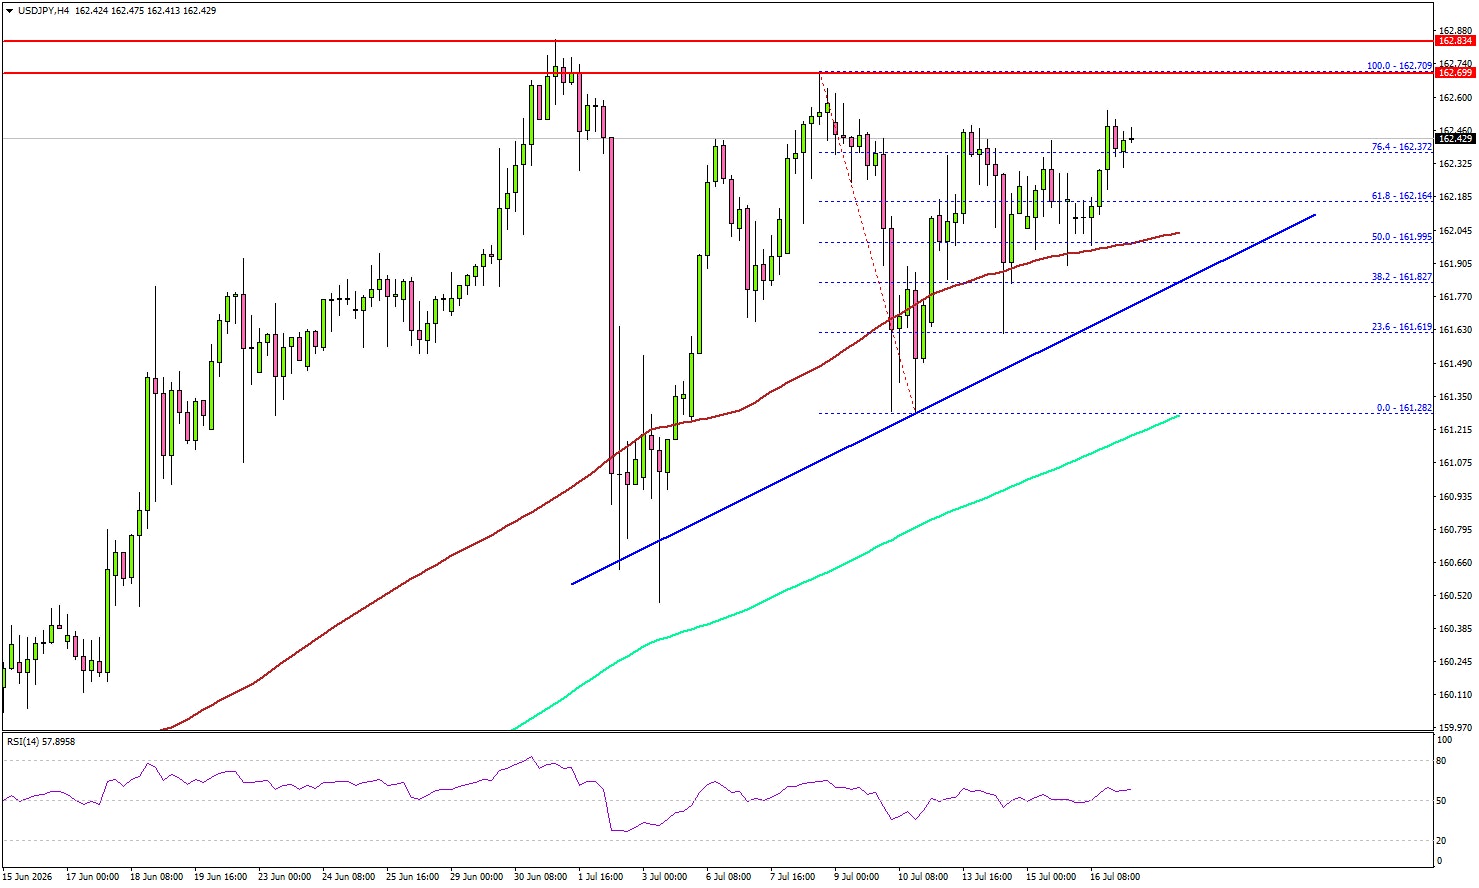
Looking at the 4-hour chart, the pair surpassed the 61.8% Fibonacci retracement level of the downward move from the 162.70 swing high to the 161.28 low. The pair even settled above 162.20, the 100 simple moving average (red, 4-hour), and the 200 simple moving average (green, 4-hour).
On the upside, the pair could face strong resistance at 162.70. The next major resistance might be 162.85. A close above 162.85 could start a steady increase. In the stated case, the bulls could aim for a move to 163.50.
If there is a downside correction, the pair might find support near 162.00. There is also a major bullish trend line forming with support at 161.90.
The first major support could be near 161.30 and the 200 simple moving average (green, 4-hour). A downside break and close below 161.30 might send the pair toward 161.00. Any more losses could open the doors for a test of 160.00.
Looking at EUR/USD, the pair attempted a fresh increase, but the bears are still active near the 1.1475 resistance zone.
Upcoming Key Economic Events:
- US Import Price Index for June 2026 (MoM) – Forecast -0.7%, versus +1.9% previous.
- US Export Price Index for June 2026 (MoM) – Forecast -0.4%, versus +1.3% previous.
- US Industrial Production for June 2026 (MoM) – Forecast 0.2%, versus 0.1% previous.
- Michigan Consumer Sentiment Index for July 2026 (Prelim) – Forecast 51.0, versus 49.5 previous.
New Zealand CPI Preview, June Quarter 2026: Pain at the Pump
- With the war in the Middle East pushing oil prices sharply, consumer price inflation is set to rise to a two-year high.
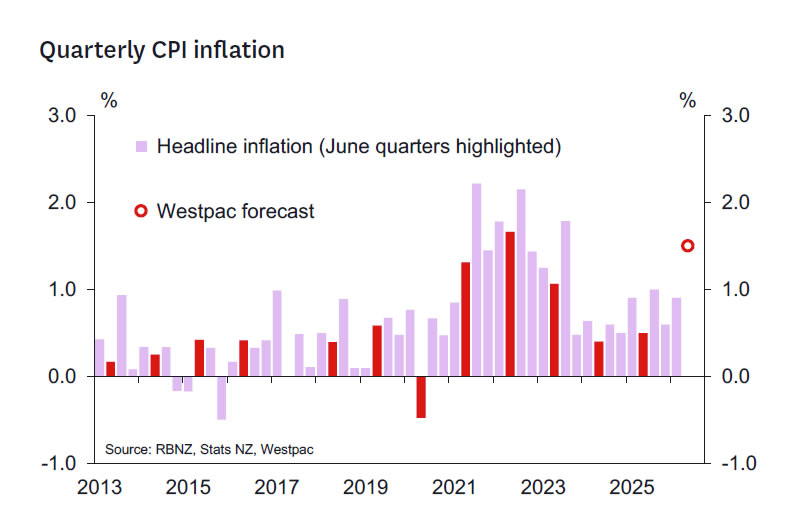
- We estimate that New Zealand consumer prices rose by 1.5% in the June quarter. That's slightly higher than our previous forecast, consistent with the firmer than expected increases in prices for volatile items like holiday accommodation in Stats NZ's June update.
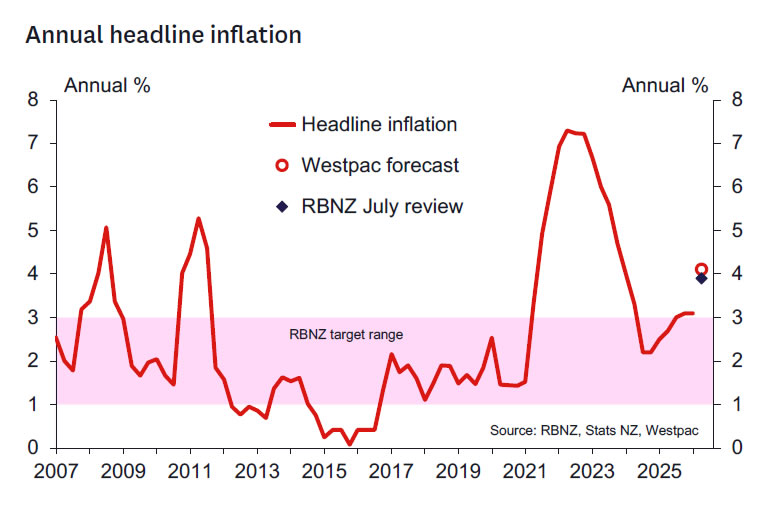
- The annual inflation rate is expected to rise to 4.1% (up from 3.1% previously).
- Core inflation has been softening but remains above the RBNZ's 2% target midpoint. That's despite the downturn in economic growth and softness in the labour market.
- Our forecast is close to the RBNZ's updated forecast for 3.9% annual inflation.
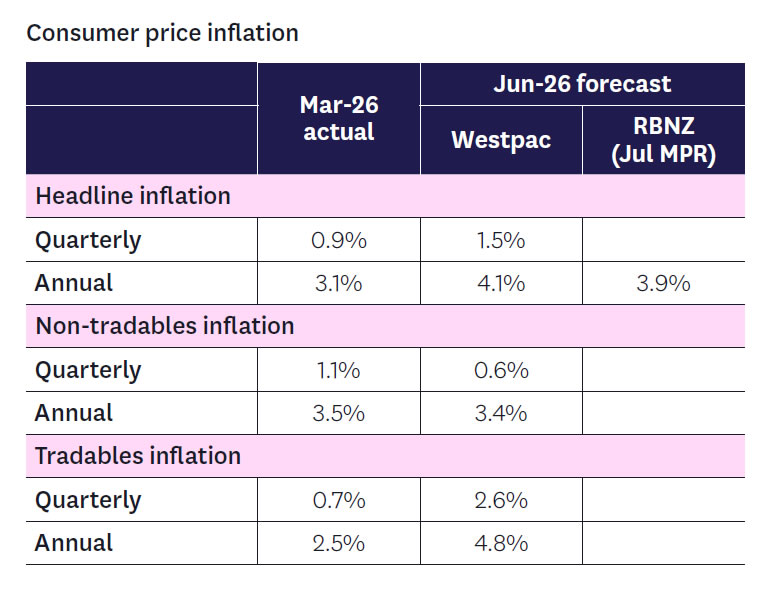
We expect the June quarter inflation report (out on 21 July) will show that New Zealand consumer prices rose 1.5% over the past three months. That would see the annual inflation rate rising to 4.1% - up from 3.1% in the year to March and the highest level in two years.
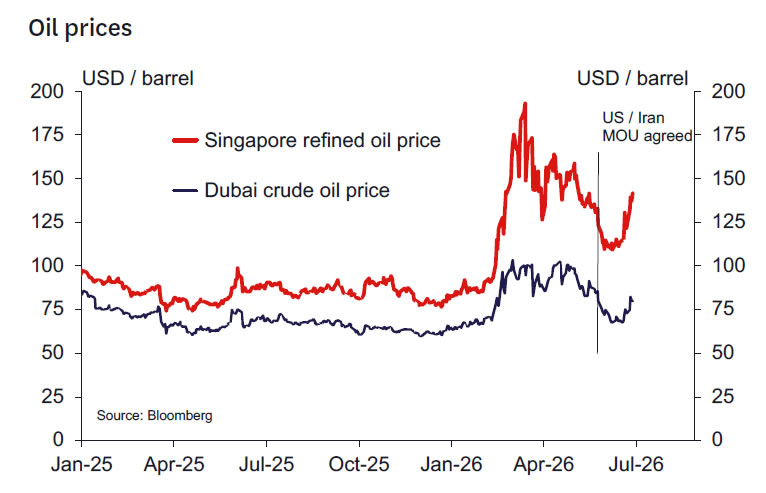
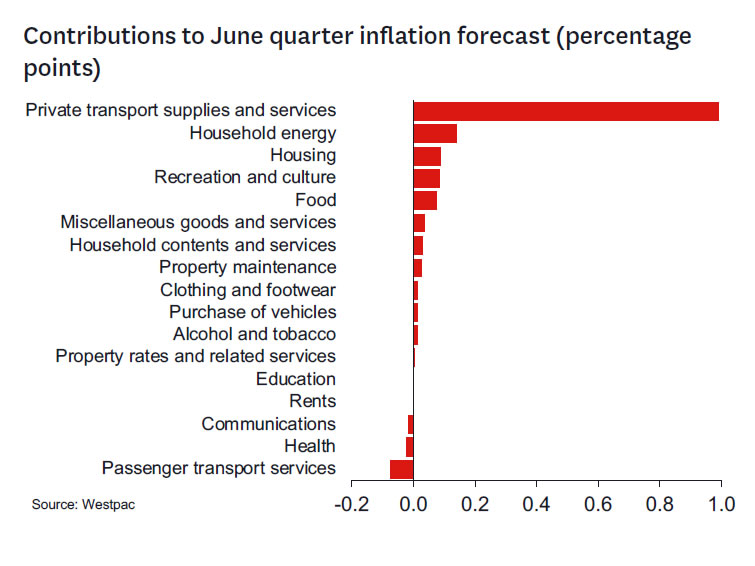
The main driver of June's spike in consumer prices has been the sharp rise in fuel prices since the start of the Middle East war. While prices have dropped in recent weeks, petrol prices have risen 20% over the June quarter and diesel prices were up an eye-watering 51% (together, those costs account for around 4% of the CPI).
Recent months have also seen further large increases in household energy prices (3% of the CPI). Electricity prices rose 4% over the June quarter and are up 12% over the past year. Similarly, household gas prices rose 2% over the quarter, leaving them up 11% over the past year.
Also adding to inflation has been the 0.4% rise in food prices over the quarter (18% of the CPI).
Oil Spill(overs)
With a sharp rise in energy prices, many businesses have reported large increases in other operating costs, including transportation and materials. For instance, in the construction sector, the cost of PVC piping and other inputs rose sharply in recent months. Consistent with that, we expect the cost of building new home (which makes up close to 10% of the CPI) to take a step higher this quarter after muted gains over the past year.
But while production costs have been rising, soft demand has been a brake on many businesses' ability to pass those higher costs through into output prices. That will limit the rise in overall consumer prices but does mean continued pressure on businesses' margins.
The risk that increased fuel costs spillover into broader inflation pressures is a significant concern for the RBNZ. With that in mind, measures of core inflation will be a key focus. (Note: core inflation measures smooth through the large quarter-to-quarter swings in individual prices and instead track the underlying trend in inflation). In terms of specifics, we expect:
- CPI ex-fuel inflation: +2.8% yr (vs +3.2% previously)
- CPI ex-fuel and food: +2.9% yr (vs +3.0% previously)
- CPI ex-fuel, food and household energy: +2.5% yr (vs +2.6% previously)
- 30% trimmed mean: +2.4% (vs +2.3% previously)
Although the various measures of core inflation have been dropping back, we're reluctant to describe them as 'low.' Despite a sharp slowdown in economic growth and softness in the labour market, the various measures of core inflation have lingered above the 2% midpoint of the RBNZ's target range for an extended period. And with the recent oil related lift in inflation pressures, recent business surveys point to the risk of at least a temporary broader lift in inflation over the coming months.
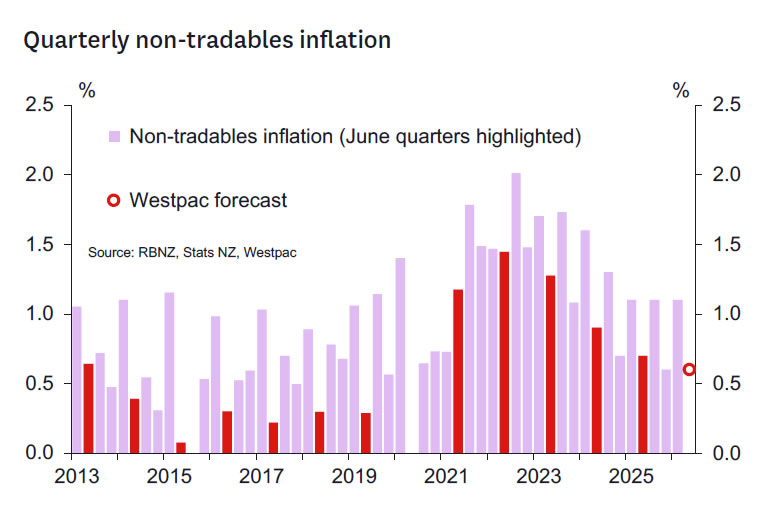
Much of the firmness in core inflation has been due to increases in domestically oriented non-tradables prices. We expect these prices will rise 0.6% over the quarter. That would see annual non-tradables inflation softening to 3.4%, down from 3.5% last quarter but still well above average levels. Much of that strength has been related to continued large increases in administered prices, like council rates and electricity.
Bucking that trend of general firmness in non-tradeable prices, however, has been notable softness in housing rents (11% of the CPI). With abundant supply and low population growth, average housing rents have shown no growth since late last year, and regions likely Wellington have seen outright falls.
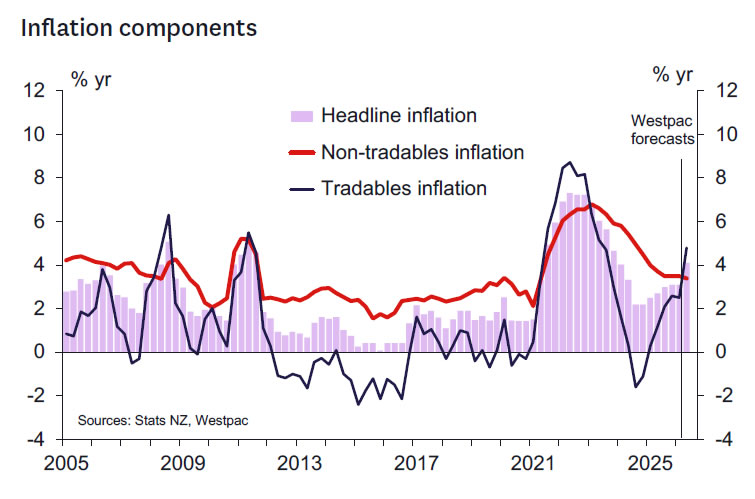
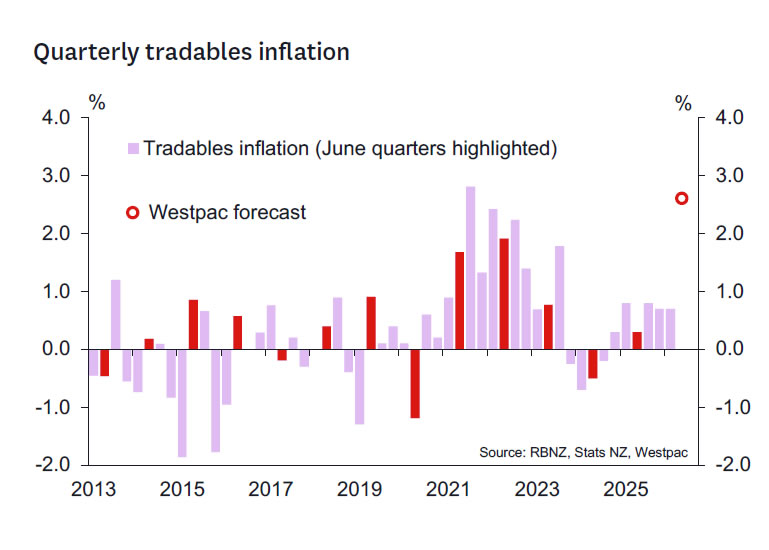
On the imported front, higher fuel costs are expected to see tradables prices rising by a huge 2.6% over the quarter. That would result in annual tradables inflation rising from to 4.8% from 2.5%yr previously. But while higher fuel costs have been a significant driver of the rise in imported inflation, the lower New Zealand dollar is also playing an important role. Excluding food and fuel costs, we estimate that tradables prices were up 3.2% over the past year. The average value of the trade-weighted exchange rate (TWI) in the June quarter was almost 4% lower than a year earlier.
How Do Our Forecasts Compare to the RBNZ's Assumptions?
Under the direction of new Governor Anna Breman, the RBNZ has made efforts to strengthen it communications. That includes the releases of addition information and forecasts updates at its interim policy reviews (previously, such information was only released when the more detailed quarterly Monetary Policy Statements were released). This has been very welcome move from the RBNZ, especially given the significant and rapid changes in the global economic backdrop in recent weeks.
The RBNZ's July update show inflation peaking in the year to June at 3.9%. The RBNZ didn't publish a quarterly inflation track in July, but we estimate that their annual forecast is consistent with a 1.4% quarterly rate in consumer prices.
Our forecast for a 4.1% rise in consumer prices is slightly higher than the RBNZ's expectations. However, given the rapid changes in the economic outlook over the past few weeks and related uncertainty about the outlook, a result in line with our forecast would not be a major surprise to the RBNZ.
However, even if the overall inflation result is close to forecasts, the underlying detail will be a key interest. The RBNZ will be watching closely for signs that high fuel prices are spilling over into other prices, especially with global oil prices taking another step higher recently. With that in mind, the strength of the various core inflation measures will be a key focus for the RBNZ.
Updates from the June Selected Price Report
Our updated forecast for a 1.5% rise in consumer prices in the June quarter is slightly stronger than our previous forecast for a 1.4% rise. That reflects updated data from Stats NZ's June Selected Prices report. Of note, June saw a larger than expected increases in the volatile holiday accommodation category. That more than offset a more modest than expected rise in electricity prices.
In the other big categories, food prices were up 0.6% over the month as expected. Housing rental growth remained very muted, rising just 0.1% over the month.
Cliff Notes: Frayed Nerves
Key insights from the week that was.
The Westpac–MI Consumer Sentiment Index rose 4.1% in July; but at 83.9, the index is still in the bottom decile of historical outcomes, pointing to deep pessimism. Lower fuel prices have provided some breathing room, contributing to a less-negative assessment of ‘family finances vs a year ago’ (+5.6%) and ‘family finances next 12mths’ (+13.4%). Consumers remain sensitive to developments in the Middle East, however, last week’s re-escalation of the conflict resulting in a progressive deterioration in daily responses while the survey was in the field.
Views on the economic outlook are weak and little changed, the one- and five-years ahead sub-indexes lifting just 0.6% and 0.7% in the month; more encouragingly, concerns over the jobs outlook have eased. Most consumers still expect mortgage rates to rise over the next year, though the share has declined from 66% to 60%, with a rising proportion reporting uncertainty about where rates are headed. Ultimately, the survey reported a reprieve from worst-case fears but is also evidence of the scale of challenges ahead.
The latest NAB business survey echoed similar themes. Business confidence continued to retrace the sharp falls seen at the onset of the Middle East conflict, rising +9pts to a less-pessimistic reading of –5. Lower fuel prices contributed to slower growth in purchase costs and final prices, but the cumulative impact of these pressures have weighted on capital expenditure plans and labour demand. Business conditions remain subdued, holding at +3 for a third consecutive month having weakened earlier in 2026. This is consistent with sluggish activity growth as households and businesses approach the outlook with caution.
Offshore, US inflation data was supportive of interest rates remaining on hold in coming months. Headline prices fell 0.4% in June as energy prices responded to the Middle East ceasefire agreed mid-month, pulling annual inflation down from 4.2%yr to 3.5%yr. Of greater significance for monetary policy, however, was the flat monthly read for core inflation, 2.6%yr.
Members of the FOMC want to see further evidence of disinflation towards the 2.0%yr target. In our view, the multi-month trends are consistent with such an out-turn, with core goods prices broadly unchanged year-to-date and core services inflation averaging just below 0.3% per month. The June PPI report corroborates this view, headline producer prices falling 0.3%, while May was revised down sharply from 1.1% to 0.6%. Ex food and energy, prices rose a modest 0.2%mth, and the prior month's gain was revised lower from 0.4% to 0.1%. The latest readings on consumer demand are also consistent with inflation returning to target, nominal control group retail sales up a modest 0.5% in June after a 0.8% gain in May, and the latest Beige Book also pointing to consumer demand being constrained by cost-of-living pressures. The duration and severity of the renewed conflict in the Middle East will be critical to the US growth outlook given University of Michigan consumer sentiment remains stuck near multi-decade lows.
Over in Asia, China's Q2 GDP and June activity data provided a mixed read on their economy. Q2 GDP met expectations at 0.9%qtr, although the annual rate disappointed at 4.3%yr. Year-to-date, growth remains broadly consistent with our expectation of 4.7%, but such an outcome would be at the lower end of authorities' 4.5–5.0% full-year target. The industrial sector continues to drive aggregate momentum, production growth rebounding to 5.3%yr in June from around 4.0%yr through April and May. But the domestic growth story remains fragile, primarily owing to declining investment, -5.7%ytd in June. Retail sales growth recovered from -0.6%yr in May to 1.0%yr in June, though that still leaves it at the lower end of the historical rage. Together, the state of domestic investment and household consumption call for urgent pro-active stimulus to support cyclical momentum as well as structural change to help the gains of trade flow to the wider economy.
The Bank of Korea raised rates by 25bp this week and signalled further tightening is likely. Inflation remains elevated, due to a combination of higher energy, exchange rate and food costs alongside resilient domestic demand. But the BoK's greater challenge is managing an increasingly two-speed economy, with tech-related sectors benefiting directly from the AI and data centre investment boom while others wait for those gains to spill over. For now, policymakers appear comfortable leaning against inflation and expecting the benefits of AI production and investment to broaden; although, in the interim, this leaves Korea exposed should enthusiasm around AI turn. Investment and the implications for growth and policy is a focus of this month's edition of The Wrap on Asia; and, with a particular focus on AI investment, Chief Economist Luci Ellis’ weekly essay.
Eco Data 7/17/26
| GMT | Ccy | Events | Act | Cons | Prev | Rev |
|---|---|---|---|---|---|---|
| 08:00 | EUR | Eurozone Current Account (EUR) May | 25.1B | 18.1B | -15.7B | 17.5B |
| 09:00 | EUR | Eurozone CPI Y/Y Jun F | 2.80% | 2.80% | 2.80% | |
| 09:00 | EUR | Eurozone Core CPI Y/Y Jun F | 2.40% | 2.40% | 2.40% | |
| 12:30 | USD | Building Permits Jun | 1.37M | 1.420M | 1.410M | |
| 12:30 | USD | Housing Starts Jun | 1.43M | 1.330M | 1.177M | 1.20M |
| 12:30 | USD | Import Price Index M/M Jun | 0.30% | -0.70% | 1.90% | 1.70% |
| 13:15 | USD | Industrial Production M/M Jun | 0.10% | 0.20% | 0.10% | |
| 13:15 | USD | Capacity Utilization Jun | 76.10% | 76.20% | 76.20% | 76.10% |
| 14:00 | USD | UoM Consumer Sentiment Jul P | 54.4 | 51 | 49.5 | |
| 14:00 | USD | UoM 1-Yr Inflation Expectations Jul P | 4.20% | 4.60% |
| 08:00 | EUR |
| Eurozone Current Account (EUR) May | |
| Actual | 25.1B |
| Consensus | 18.1B |
| Previous | -15.7B |
| Revised | 17.5B |
| 09:00 | EUR |
| Eurozone CPI Y/Y Jun F | |
| Actual | 2.80% |
| Consensus | 2.80% |
| Previous | 2.80% |
| 09:00 | EUR |
| Eurozone Core CPI Y/Y Jun F | |
| Actual | 2.40% |
| Consensus | 2.40% |
| Previous | 2.40% |
| 12:30 | USD |
| Building Permits Jun | |
| Actual | 1.37M |
| Consensus | 1.420M |
| Previous | 1.410M |
| 12:30 | USD |
| Housing Starts Jun | |
| Actual | 1.43M |
| Consensus | 1.330M |
| Previous | 1.177M |
| Revised | 1.20M |
| 12:30 | USD |
| Import Price Index M/M Jun | |
| Actual | 0.30% |
| Consensus | -0.70% |
| Previous | 1.90% |
| Revised | 1.70% |
| 13:15 | USD |
| Industrial Production M/M Jun | |
| Actual | 0.10% |
| Consensus | 0.20% |
| Previous | 0.10% |
| 13:15 | USD |
| Capacity Utilization Jun | |
| Actual | 76.10% |
| Consensus | 76.20% |
| Previous | 76.20% |
| Revised | 76.10% |
| 14:00 | USD |
| UoM Consumer Sentiment Jul P | |
| Actual | 54.4 |
| Consensus | 51 |
| Previous | 49.5 |
| 14:00 | USD |
| UoM 1-Yr Inflation Expectations Jul P | |
| Actual | 4.20% |
| Consensus | |
| Previous | 4.60% |