Sample Category Title
Fed Speakers Eyed As Safe Havens Pare Gains
- EUR remains under pressure after German election;
- Safe havens pare gains as US labels declaration of war “absurd”;
- Fed officials provide distraction from political and geopolitical headlines.
It's been a steady start to trading on Tuesday, with political uncertainty and geopolitical risk once again weighing on risk appetite.
Coalition talks in Germany and New Zealand following elections over the weekend will likely lead to some uncertainty in the near-term which is weighing on the kiwi but having less of a negative impact on German-related assets. Bund yields fell slightly in the immediate aftermath of the election while the euro has fallen back towards 1.18 against the dollar but it's important to note that both had made significant gains prior to this and the latter in particular was looking a little overstretched.
Rather than being a source of negativity for the euro, I think traders are seeing the election as an opportunity to lock in some profits which is triggering a small but arguably necessary correction. With 1.18 now coming under pressure, I think further downside could be on the cards in the near-term, with 1.1660 being the next test to the downside potentially more to come. A correction would provide the EBC the opportunity to announce tapering next month with the currency trading at more comfortable levels.
We saw some safe haven flows on Monday after it was claimed that US President Donald Trump had declared war on North Korea with his comments over the weekend. Foreign Minister Ri Yong-ho made this statement in New York which immediately triggered moves towards traditional safe havens such as Gold, although these moves have already been partially reversed today. The US immediately rejected these claims and branded them absurd which has possibly helped alleviate any concerns although it's clear that the rhetoric between the two countries is intensifying.
This underlying risk will remain in the markets, leaving them vulnerable to these bouts of sudden safe haven flows, until we start to see signs of a diplomatic solution being found. Something that doesn't look like it's coming any time soon with the leaders of both countries clearly more intent on appearing dominant than finding a solution.
Politics and geopolitics aside, we will get some economic data from the US today and also hear from a number of Federal Reserve officials. Chair Janet Yellen is clearly the most notable of the Fed speakers today but we'll also hear from Charles Evans, Loretta Mester, Lael Brainard and Raphael Bostic which should make it an interesting day for the dollar and US yields, particularly as the central bank stood by expectations of one more rate hike at its meeting this month. CB consumer confidence and new home sales data will also accompany these appearances.
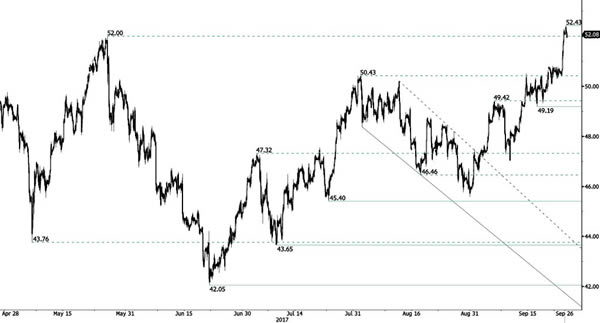
CRUDE OIL Buying Demand
.
Crude oil is edging higher above the $50 level. Key support is given at 45.40 (17/08/2017 high). Strong resistance found at 50.43 (31/07/2017) has been broken. Expected to show another leg higher.
In the long-term, crude oil has recovered after its sharp decline last year. However, we consider that further weakness are very likely. Strong support lies at 35.24 (05/04/2016) while resistance can now be found at 55.24 (03/01/2017 high).
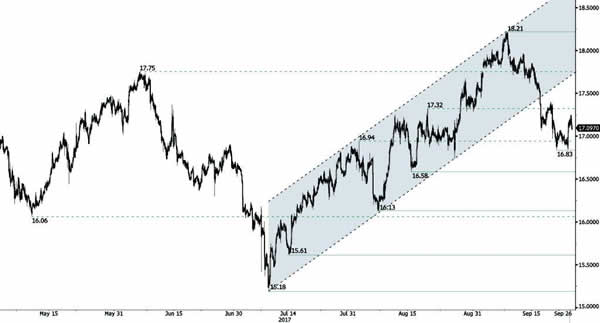
SILVER Consolidation
Silver has reversed and has broken uptrend channel by breaking support implied by its lower bound. Strong resistance is given at 18.65 (17/04/2017 high) while support can be found at 16.58 (15/08/2017 high). Expected to show further bearish move.
In the long-term, the trend is rater negative. Further downsides are very likely. Resistance is located at 25.11 (28/08/2013 high). Strong support can be found at 11.75 (20/04/2009).
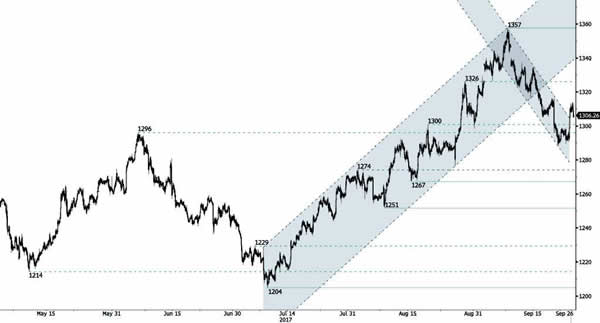
GOLD Bullish Breakout
Gold has pushed above 1300. Hourly support is now given at 1288 (21/08/2017 low). Hourly resistance is located at 1357 (08/09/2016). Stronger support lies at 1204 (10/07/2017 high). Expected to show further bearish move.
In the long-term, the technical structure suggests that there is a growing upside momentum. A break of 1392 (17/03/2014) is necessary ton confirm it, A major support can be found at 1045 (05/02/2010 low).
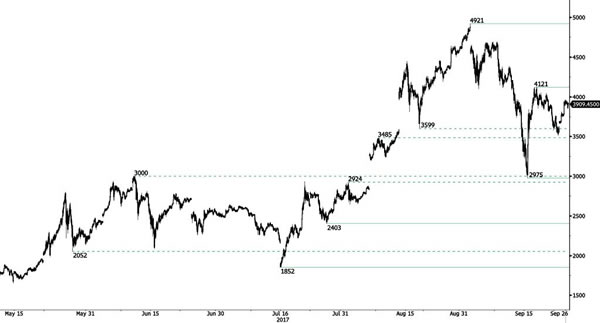
BITCOIN Ready For Further Decline
Bitcoin has taken a dive after strong interest over the summer. The digital currency has set up a new support at 2975 (22/08/2017 low). Hourly resistance is given at 4121 (18/09/2017 low). Key resistance can be located at 4921 (01/09/2017 high). The road is wide open for further shortterm decline.
In the long-term, the digital currency has had an exponential growth. There are decent likelihood that the asset will reach $10'000.
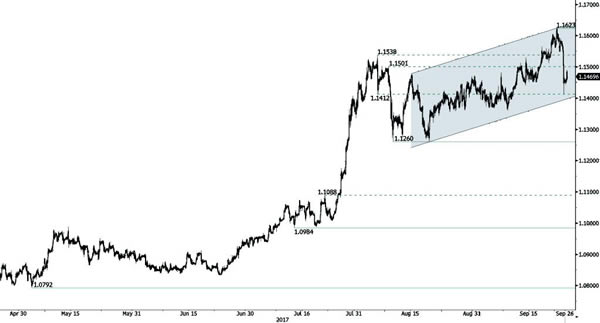
EUR/CHF Ready To Bounce Back
EUR/CHF's buying pressures are going up and the pair has broken resistance area between 1.1356 and 1.1472. The pair has also broken resistance at 1.1538 (04/08/2017 high). Expected to show continued bullish pressures.
In the longer term, the technical structure has reversed. Strong resistance is given at 1.20 (level before the unpeg). Yet, the ECB's QE programme is likely to cause persistent selling pressures on the euro, which should weigh on EUR/CHF. Supports can be found at 1.0184 (28/01/2015 low) and 1.0082 (27/01/2015 low).
EUR/GBP Weakening
EUR/GBP is trading lower. The pair is having strong selling pressures. As long as prices remain below the resistance at 0.9176 (declining trendline), the short-term technical structure is biased to the downside. Hourly support is given at 0.8719 (16/06/2017). Strong resistance lies at 0.9306 (29/07/2017 high).
In the long-term, the pair has largely recovered from recent lows in 2015. The technical structure suggests a growing upside momentum. The pair is trading above from its 200 DMA. Strong resistance can be found at 0.9500 (psychological level)

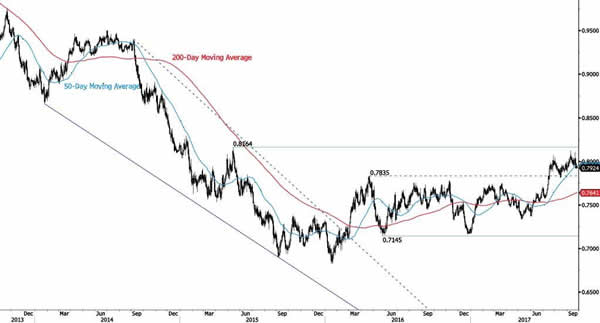
AUD/USD Targeting Long-Term Resistance
AUD/USD is weakening in the short-term. Hourly resistance is given at 0.8164 (14/05/2017 high). Hourly support is given at 0.7908 (22/09/2017 low). Expected to further weaken.
In the long-term, the trend is turning positive. Key supports stands at 0.6009 (31/10/2008 low) . A break of the key resistance at 0.8164 (14/05/2015 high) is needed to invalidate our long-term bearish view.
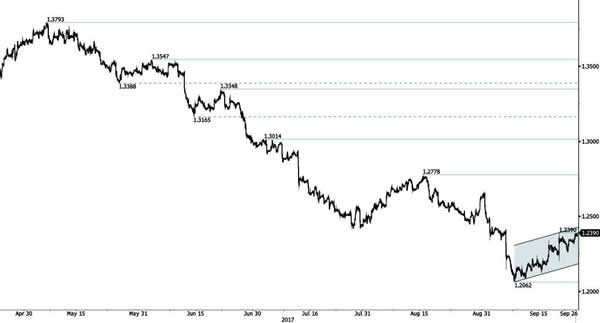
USD/CAD Bullish Pressures Continues
USD/CAD continues to move higher. Hourly support is located at 1.2062 (08/09/2017 low). Resistance is given at a distance at 1.2390 (20/09/2017 high). Expected to show continued short-term bullish pressures.
In the longer term, the pair has broken longterm support that can be found at 1.2461 (16/03/2015 low). Strong resistance is given at 1.4690 (22/01/2016 high). The pair is likely to head further lower.
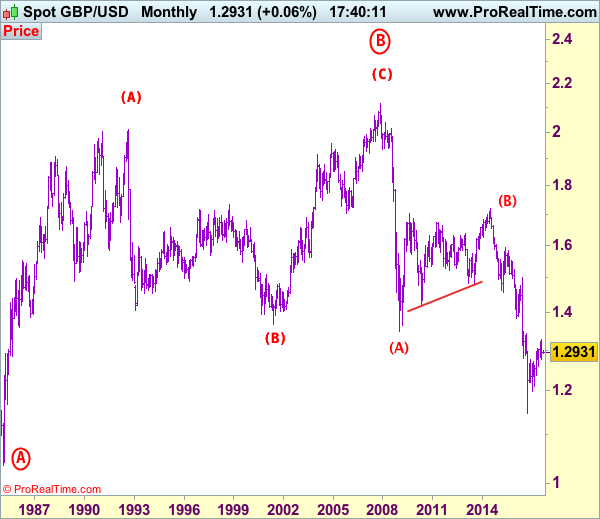
GBP/USD Elliott Wave Analysis
GBP/USD – 1.3437
Although sterling resumed recent upmove and rose to as high as 1.3658 last week, lack of follow through buying and the subsequent retreat suggest consolidation below this level would be seen and pullback to 1.3400 cannot be ruled out, however, reckon 1.3350-55 would limit downside and bring another rise later, above 1.3595-00 would signal the retreat from 1.3658 has ended, bring retest of this level, break there would extend the medium term erratic rise from 1.1986 low to 1.3700-10 but overbought condition should limit upside to 1.3800 and price should falter well below 1.3955-60 (50% Fibonacci retracement of intermediate downtrend from 1.5930-1.1986).
Our preferred count on the daily chart is that cable's rebound from 1.3500 (wave (A) trough) is unfolding as a wave (B) with A ended at 1.7043, followed by triangle wave B and wave C as well as wave (B) has possibly ended at 1.7192, below support at 1.4232 would add credence to this count, then further fall to 1.4000 level would follow but reckon downside would be limited to 1.3655 support and price should stay above previous support at 1.3500.
On the downside, although current pullback from 1.3658 suggests initial downside risk is for minor correction to 1.3400, reckon downside would be limited to 1.3350-55 and bring another rise later to aforesaid upside targets. Below previous resistance at 1.3329 (now support) would defer and suggest a temporary top is possibly formed, bring retracement of recent rise to 1.3290-00, then 1.3240-50 but said support at 1.3153 should remain intact, bring another upmove later.
Recommendation: Buy again at 1.3355 for 1.3555 with stop below 1.3255.
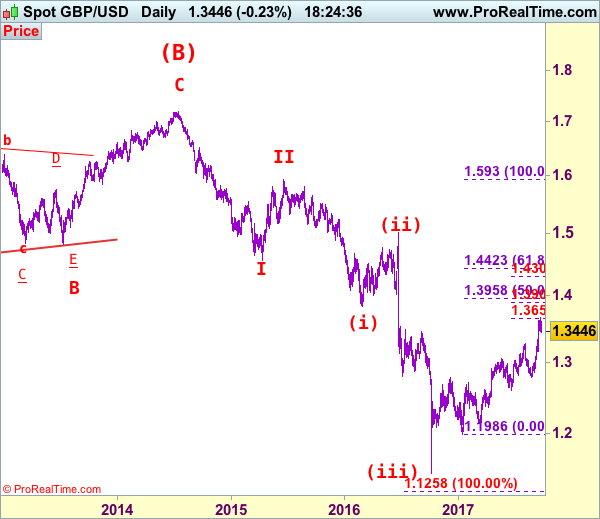
Longer term - Cable's rise from 1.0520 (Feb 1985) to 2.0100 (September 1992) is seen as [A], the decline to 1.3682 is labeled as (B) and (C) wave rally has ended at 2.1162 (9 Nov, 2007) which is also the top of larger degree wave B with circle. The selloff from there is a 5-waver with wave (A) ended at 1.3500 (23 Jan 2009), wave (B) itself is labeled as A: 1.6733, triangle wave B: 1.4813 and wave C as well as top of wave (B) ended at 1.7192 (2014), hence the selloff from there is an impulsive wave (C) with wave I : 1.4566, wave II 1.5930, an extended wave III is unfolding and already exceeded our downside target at 1.3500 and 1.3000, hence weakness to 1.2500 and possibly 1.2000 cannot be ruled out, however, price should stay well above psychological level at 1.0000.