
Sample Category Title
GBP/AUD Analysis: the Tug-Of-War Begins
Oil is back in the driver's seat, and both the pound and the aussie are feeling its grip. The Bank of England held rates at 3.75% in June, but with UK inflation at 2.8% and crude oil climbing on renewed Middle East tensions, markets now lean towards a hike before year-end. Down under, the Reserve Bank of Australia held its cash rate at 4.35% after three straight increases, with core inflation stuck at 3.6%, keeping the door open for further tightening. Two hawkish central banks, one shared inflationary culprit—yet it's the existing 60-basis-point rate gap in Australia's favour that is giving GBP/AUD its current shape, with the pair holding firm near the 1.93 handle as traders watch which bank blinks first.
Technical Outlook
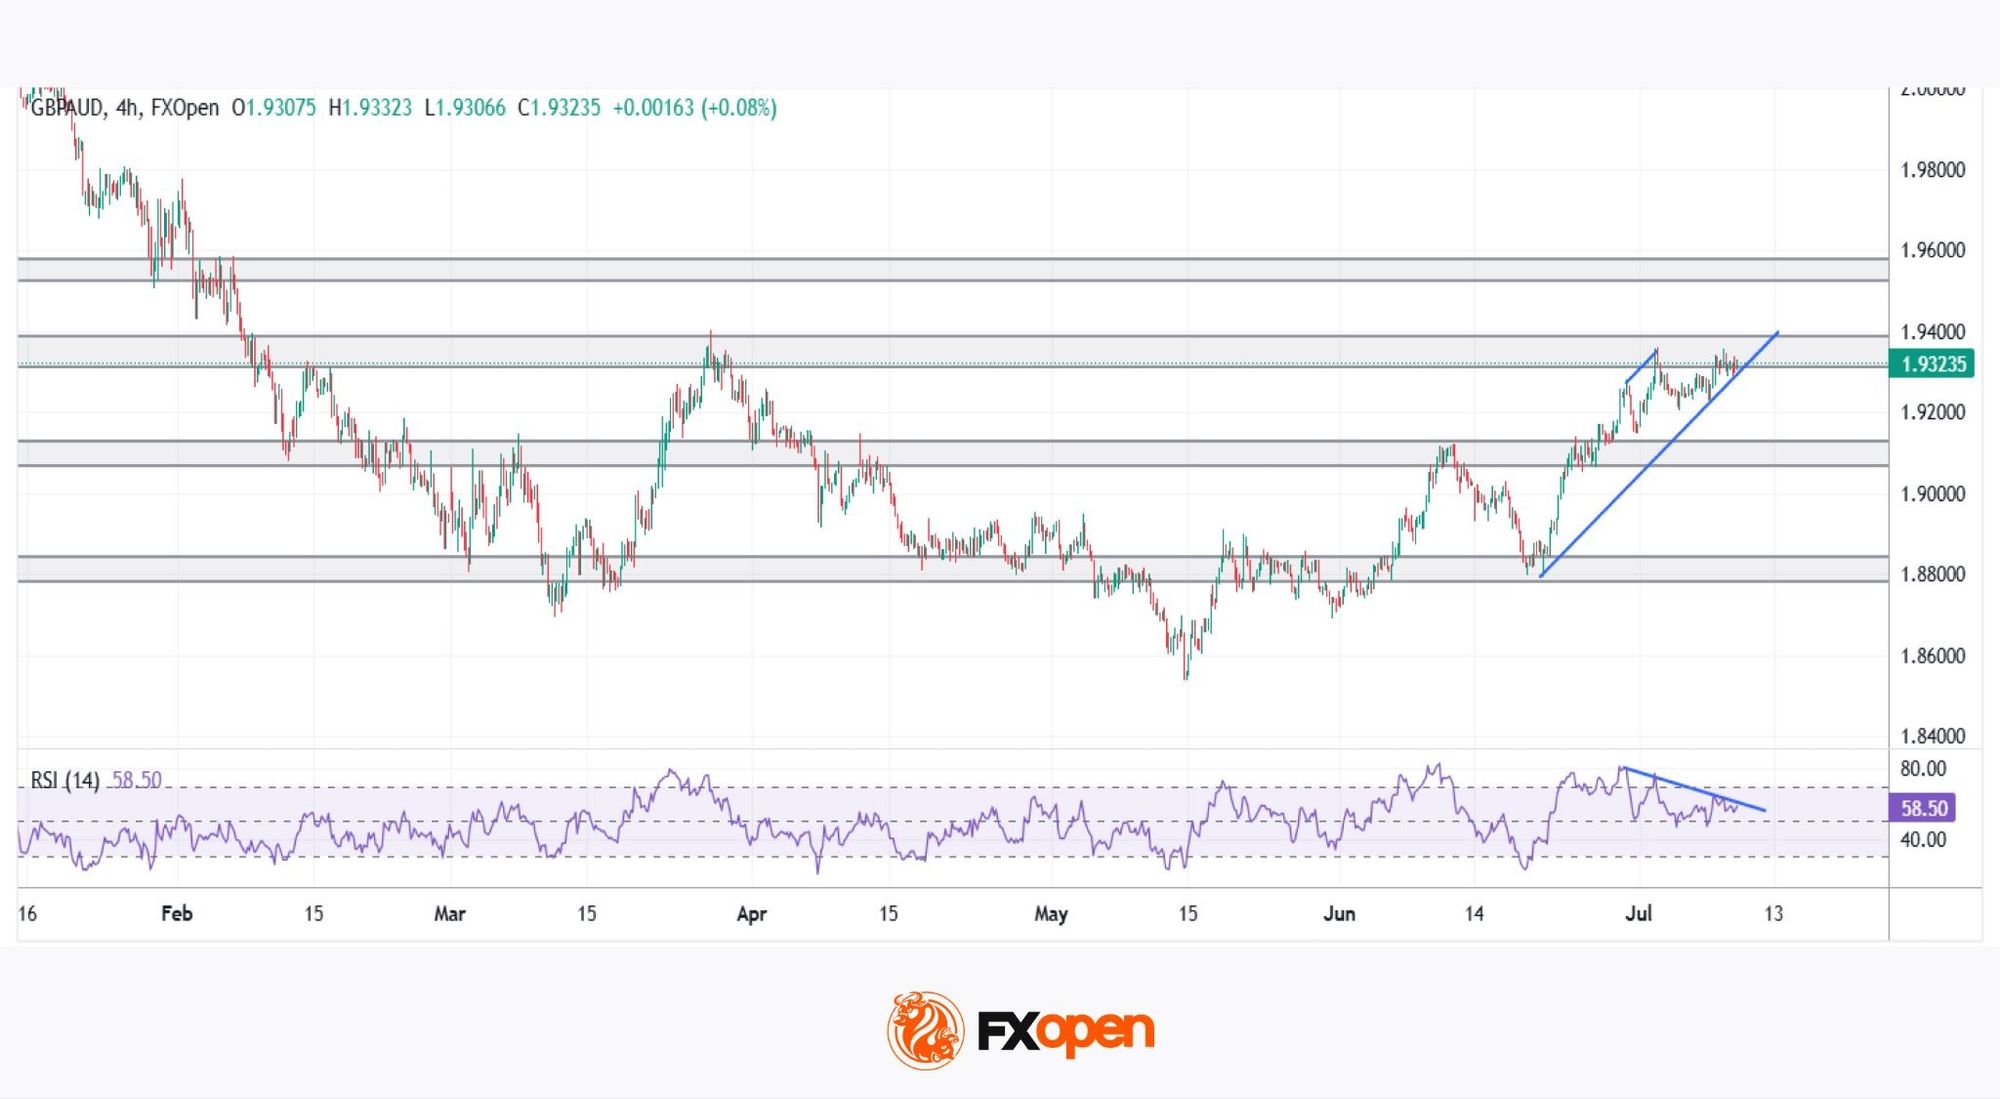
GBP/AUD pits two currencies backed by hawkish central banks against each other. After a sharp downtrend, the pair found a floor in May 2026 and has since reversed into a medium-term uptrend as sterling claws back ground against the aussie. Price is now testing a key resistance zone that has previously capped upside attempts, making the coming sessions pivotal.
Bullish Scenario
Several sessions of strong bullish momentum have kept sterling supported. The pair is testing a crucial resistance zone at 1.9350–1.9400, which has rejected price before.
A confirmed break above could open the path towards the next resistance at 1.9520–1.9550.
Such a breakout would likely require fundamental support, such as further escalation in the Middle East or an even more hawkish BoE.
Bearish Scenario
Price could reject the resistance zone once again, reinforcing it as a key barrier.
A bearish RSI divergence on the 4H chart adds weight to this scenario, with price posting higher highs while the RSI prints lower highs—a sign of fading momentum.
The ascending trendline is now the nearest relevant support; a break below could expose the intermediate zone at 1.9080–1.9120, where price may pause and consolidate.
Should tensions ease or fresh UK political developments emerge, sterling could lose ground, breaking below this zone to test the next support at 1.8780–1.8820.
Ultimately, GBP/AUD's next move will hinge on geopolitical and macroeconomic developments, alongside these key technical levels. Which of the two currencies will show greater strength in the sessions ahead?
Trade over 50 forex markets 24 hours a day with FXOpen. Take advantage of low commissions, deep liquidity, and spreads from 0.0 pips (additional fees may apply). Open your FXOpen account now or learn more about trading forex with FXOpen.
This article represents the opinion of the Companies operating under the FXOpen brand only. It is not to be construed as an offer, solicitation, or recommendation with respect to products and services provided by the Companies operating under the FXOpen brand, nor is it to be considered financial advice.
The Dollar: Things Are Heading Towards De-Escalation
- Rumours of talks between the US and Iran are dragging down the USD index.
- The ECB intends to act decisively on raising interest rates.
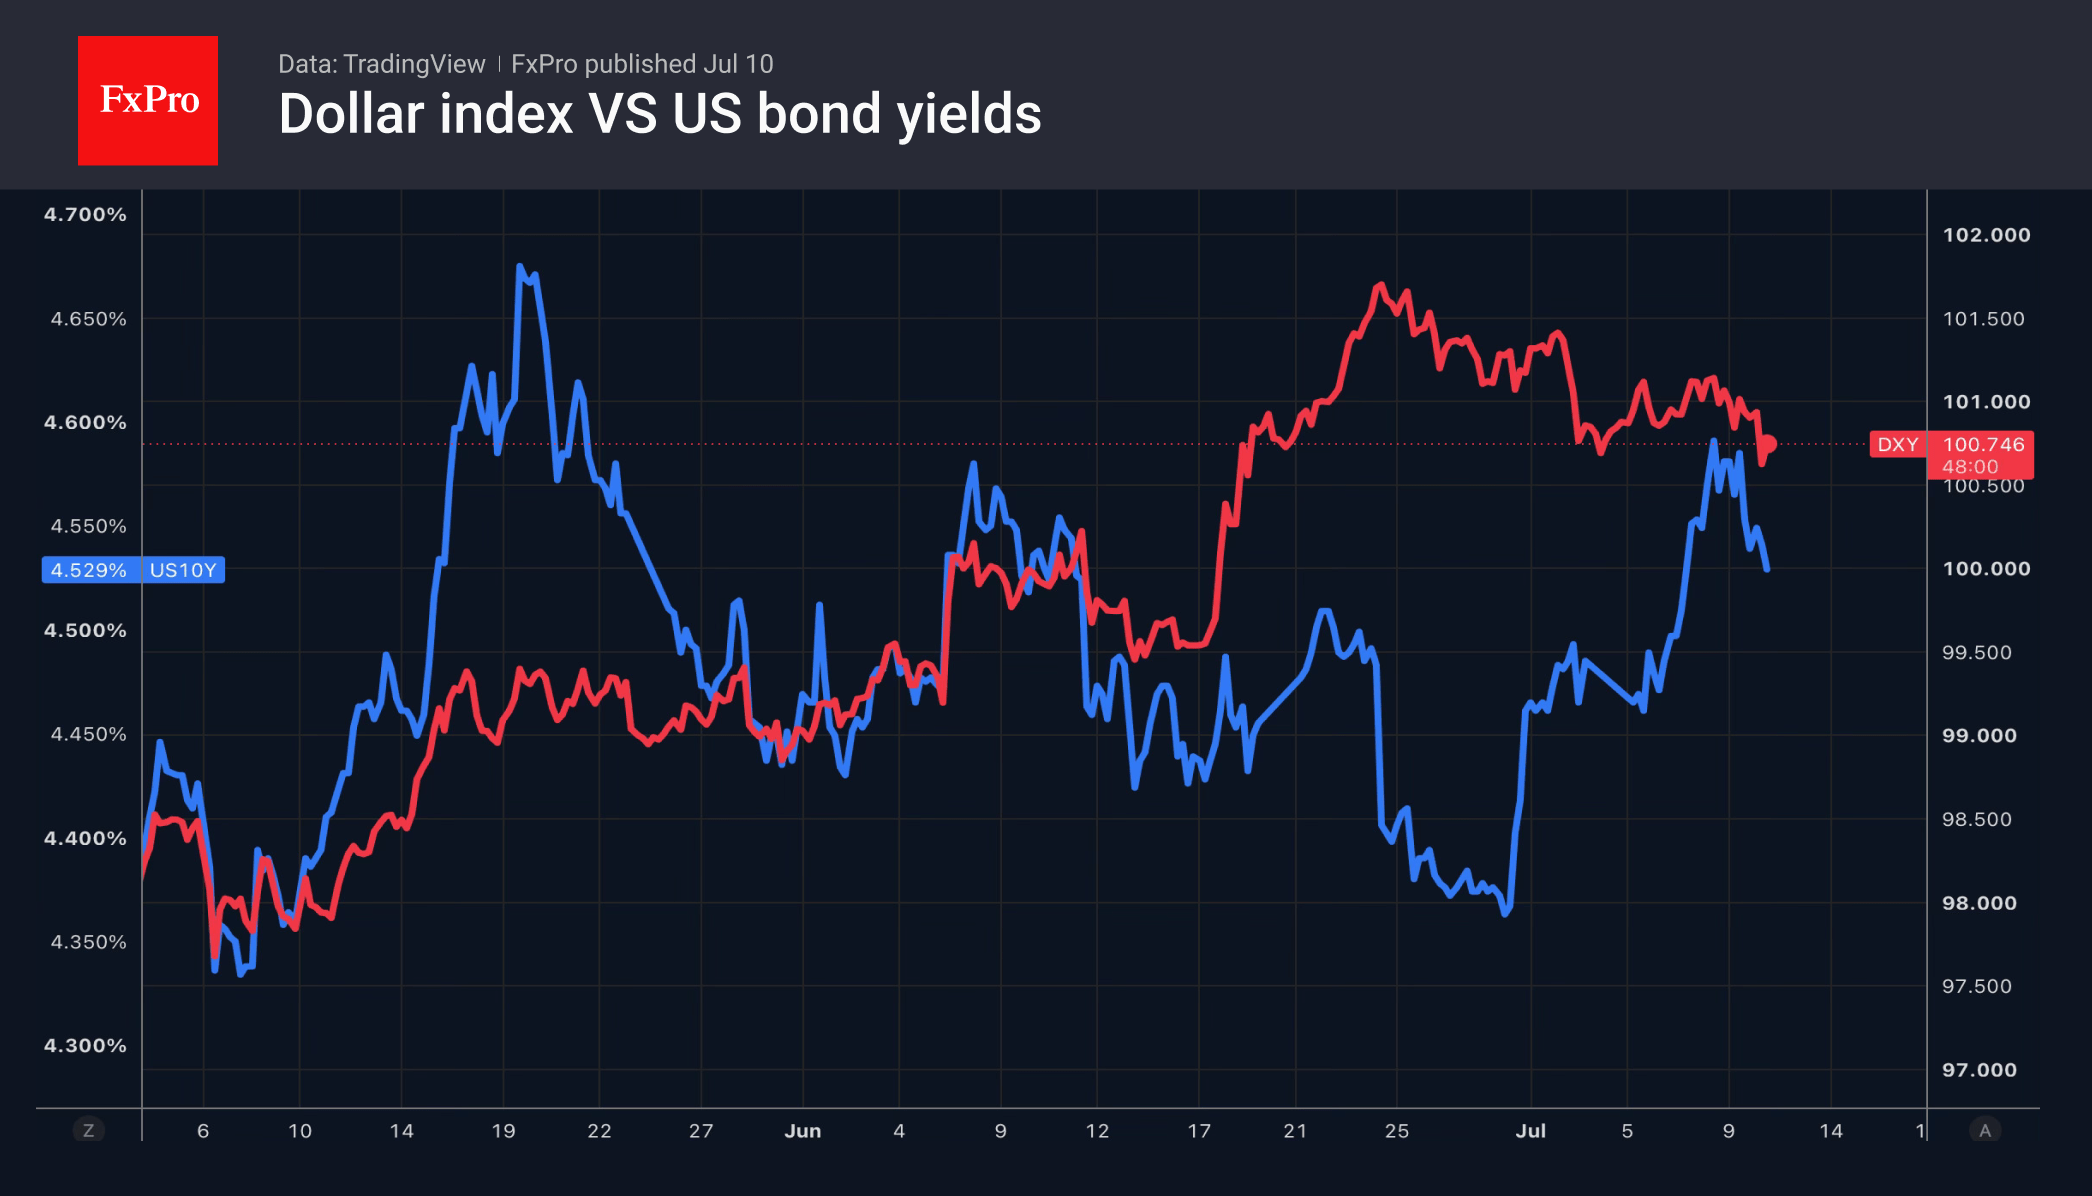
The US dollar continued to retreat following Donald Trump’s statement that Iran is seeking a deal. Investors have encountered such rhetoric from the US president many times since April, and each time, escalation has been followed by de-escalation. A rise in the S&P 500 and Brent crude pulling back from local highs, coupled with falling Treasury bond yields, is creating headwinds for the USD index.
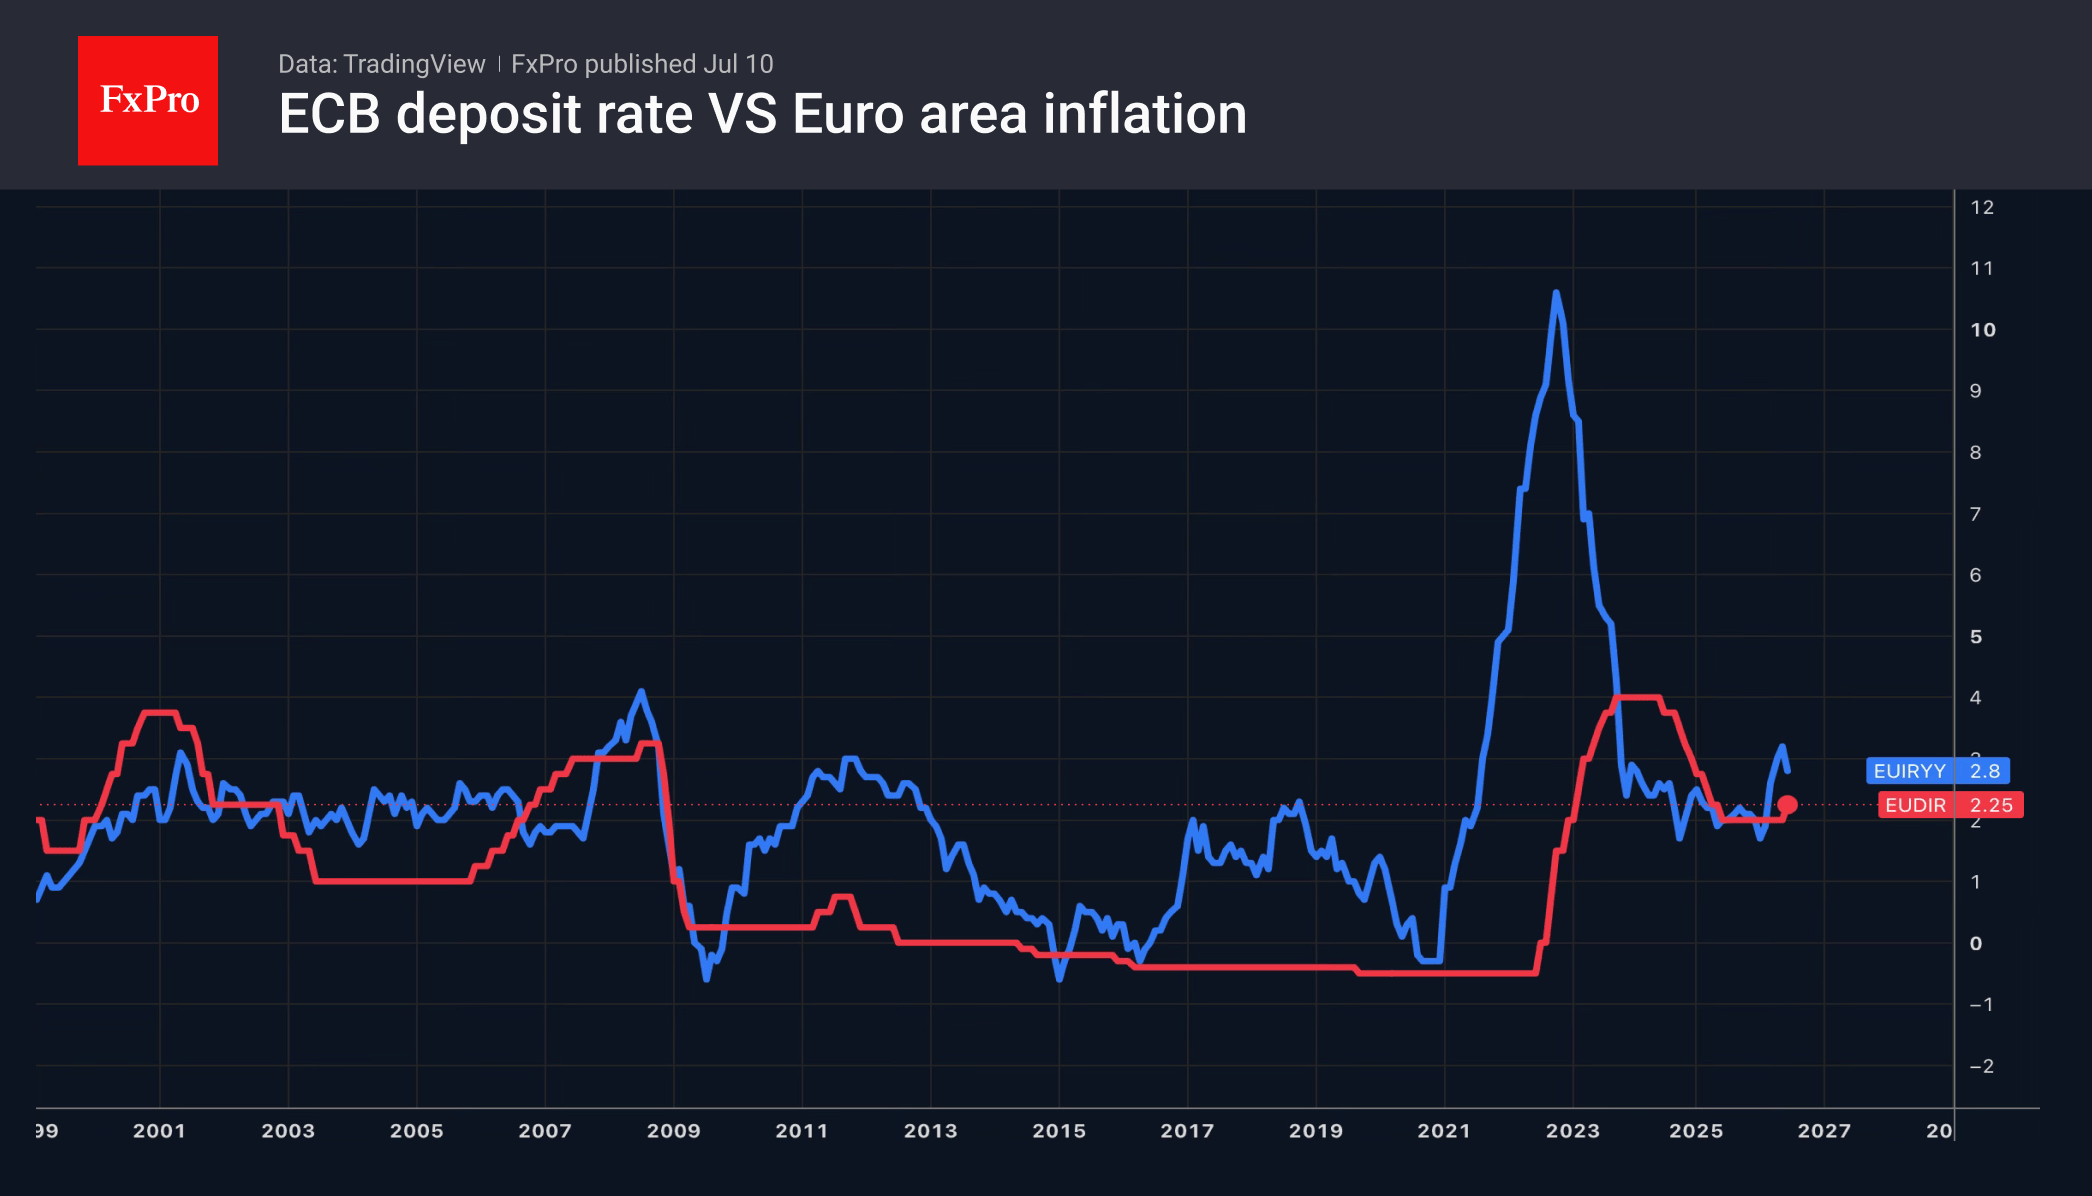
The oil rally has revived the prospect of monetary tightening in European countries. The futures market assesses the probability of two rounds of monetary tightening by the ECB and the Bank of England in 2026 as 50%. It puts the probability at 90% that the European Central Bank will raise its deposit rate in September. The minutes of its June meeting noted that inflation would remain above the 2% target in the first half of 2027, even if monetary policy were tightened three times by that point.
The ECB came under heavy criticism for being slow to raise interest rates in 2022 amid soaring consumer prices. It does not want to make the same mistake again, although the situation is now different from four years ago, with the eurozone economy weaker, and borrowing costs higher. Nevertheless, fears that rising energy prices will become embedded in core inflation and that inflationary expectations are pushing the European Central Bank to take decisive action.
The futures market is pricing in only a 40% probability of two Fed rate hikes, which is lower than for the ECB, and playing into the hands of the bulls on EURUSD.
In fact, the markets are focusing on TACO rather than the actions of central banks. Brent has stabilised above $76 per barrel. Although traffic in the Strait of Hormuz has ground to a halt and the number of tankers passing through has fallen to 25 from 30–50 in recent days, hopes for talks between the US and Iran are preventing oil prices from rising further.
The weakness of the US dollar has allowed the bears on USDJPY to mount a counterattack. Satsuki Katayama further fuelled the pullback. The Finance Minister’s call for pension funds, including the GPIF, to increase their investments in Japanese assets proved more effective than verbal interventions.
The FxPro Analyst Team
Bitcoin and Ethereum Have Rebounded to Intermediate Resistances
Market Overview
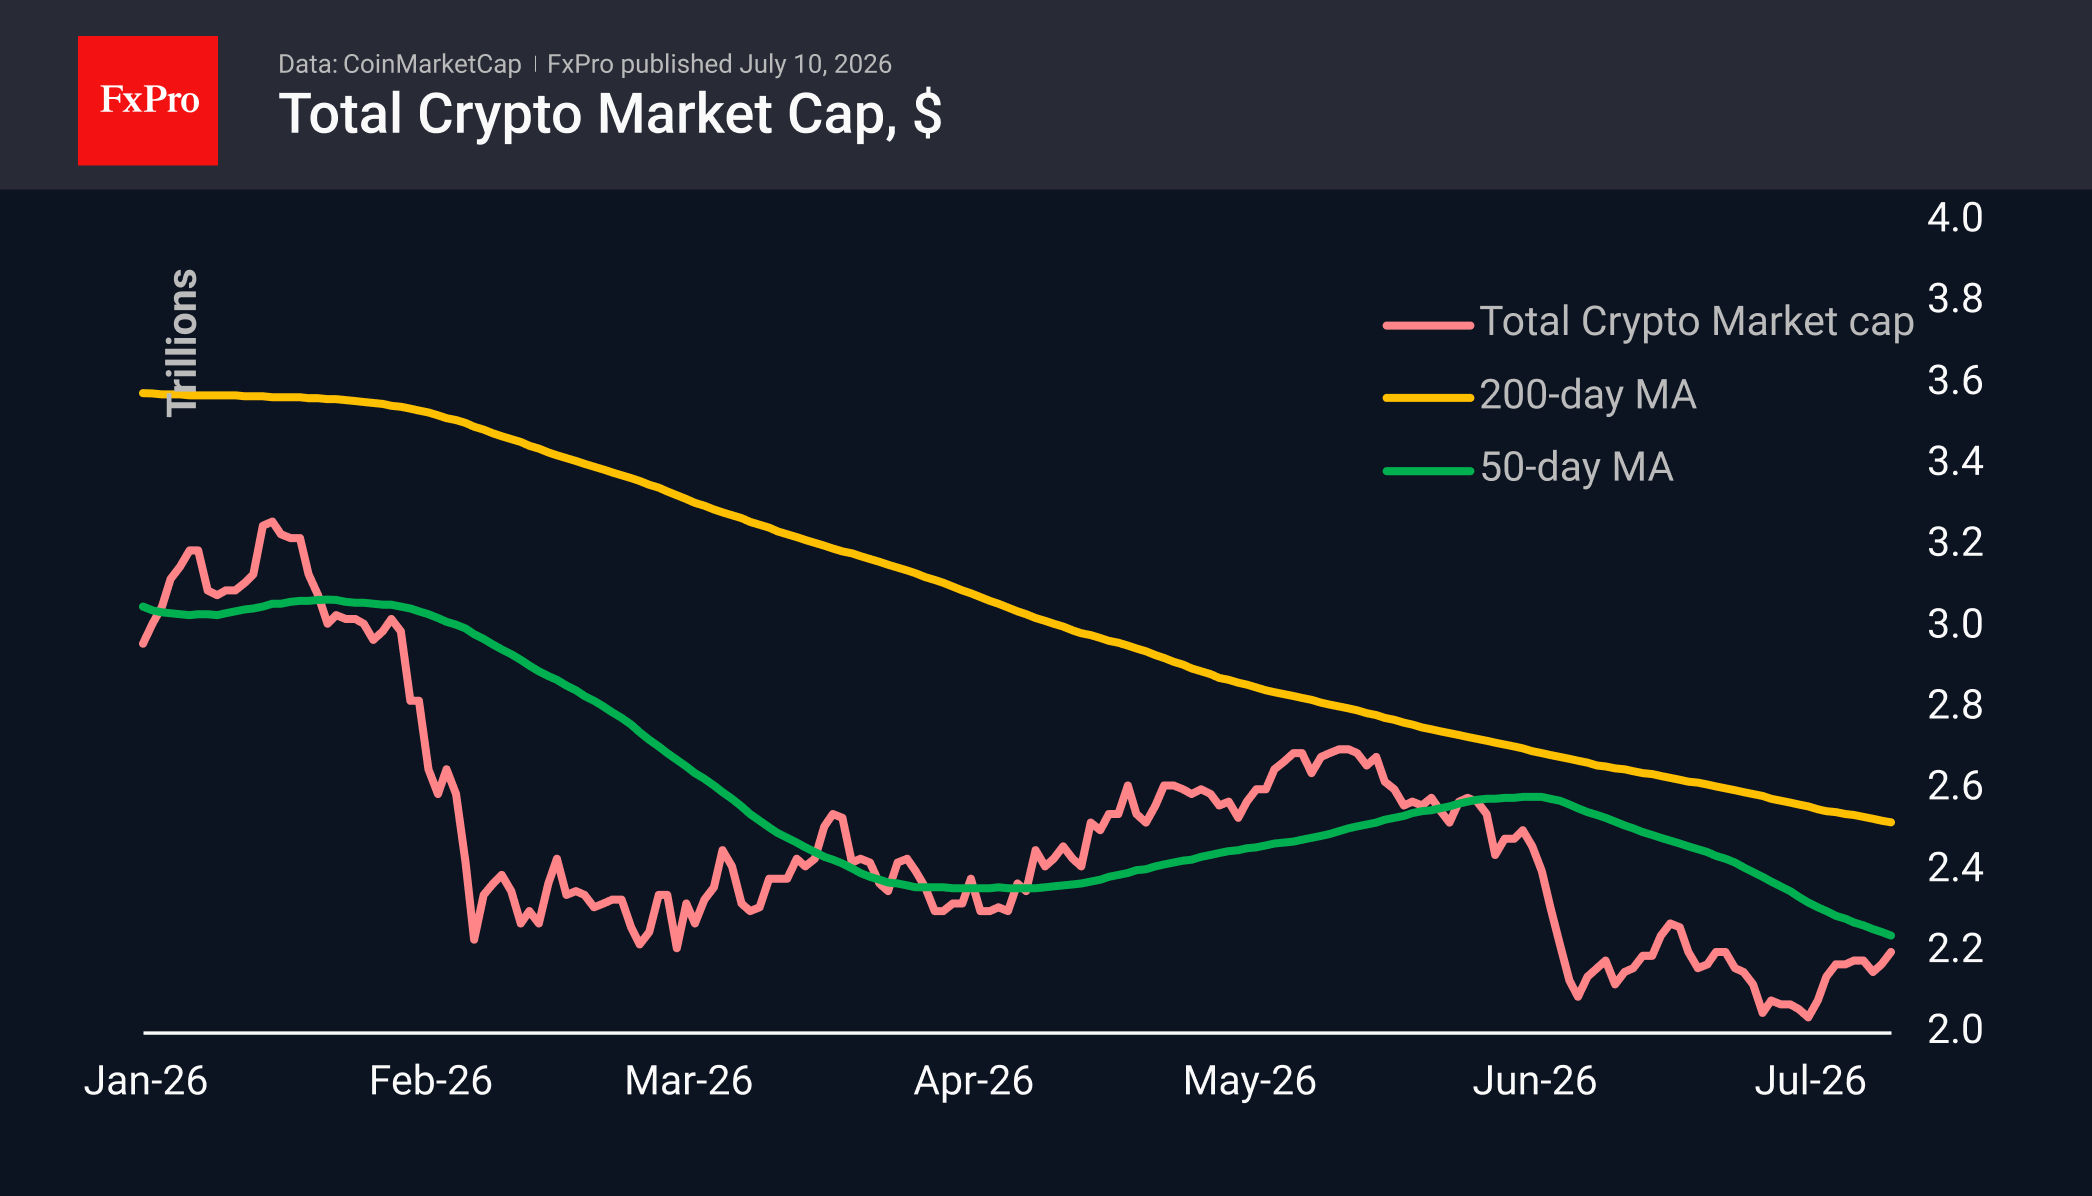
The crypto market capitalisation has reached $2.2T, rising again after a brief pause. This steady increase has formed a smooth upward trend since 8 July, which appears to be part of a broader rebound from the lows seen at the end of June. The top performers among the most actively traded coins over the past 24 hours were IOTA (+7.9%), Aave (+6.8%) and Zcash (+6.7%). Tron (-0.2%), Theta Network and Hedera (both 0%) underperformed the market, though none saw any significant declines, indicating broad-based growth.
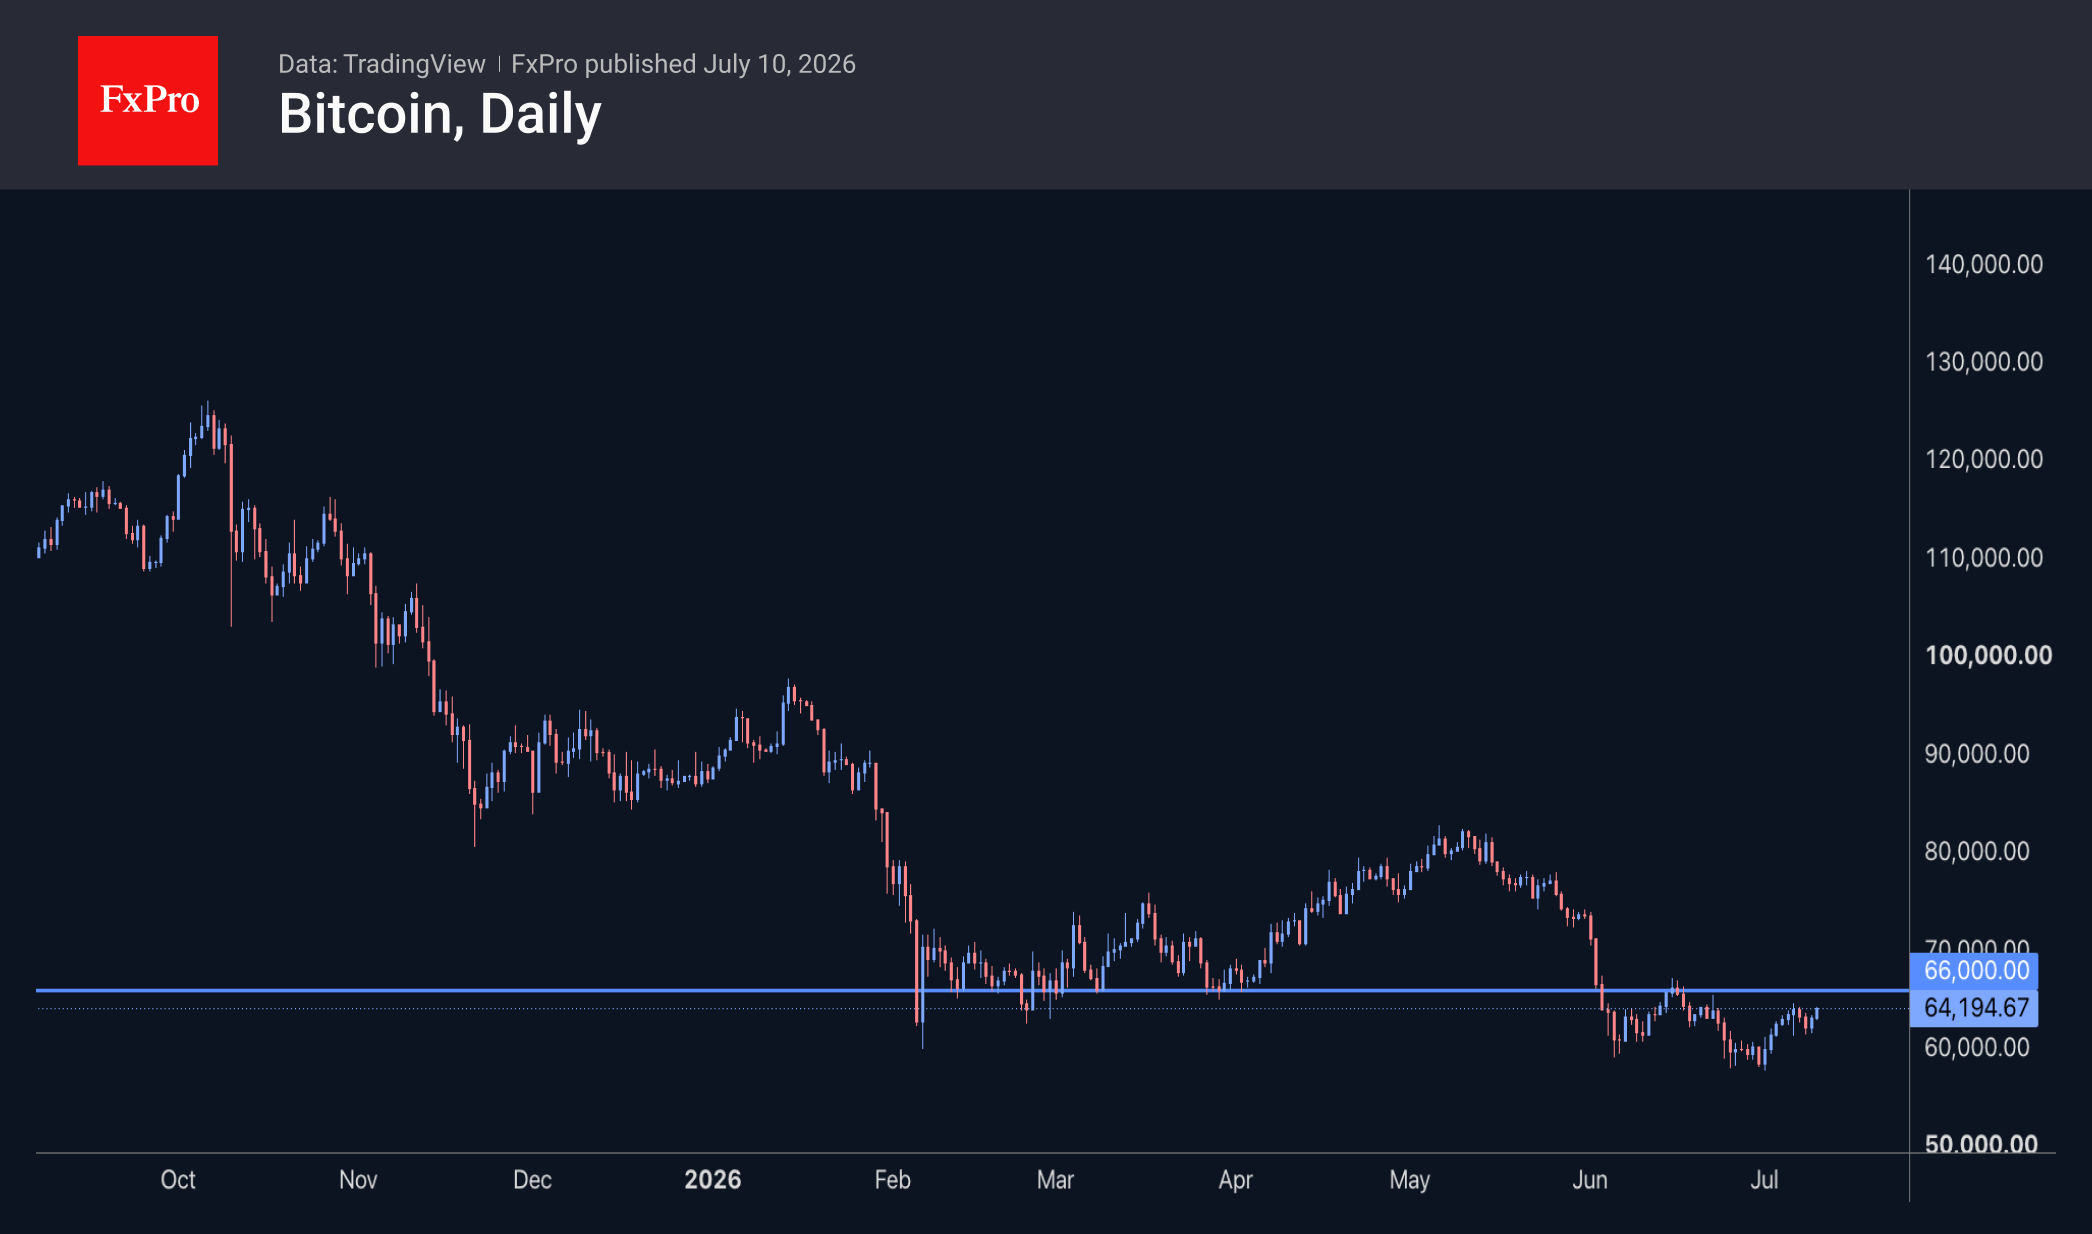
Bitcoin has returned to the intermediate local highs around $64K, with increased buyer interest during dips to $62K. And this resilience from the flagship cryptocurrency is quite positive news for the entire market. Admittedly, significant resistance still lies ahead, but it is quite possible that over the weekend, due to reduced market liquidity, levels above $66K may also give way, drawing in more active participation from risk-taking buyers in response to technical reversal signals.
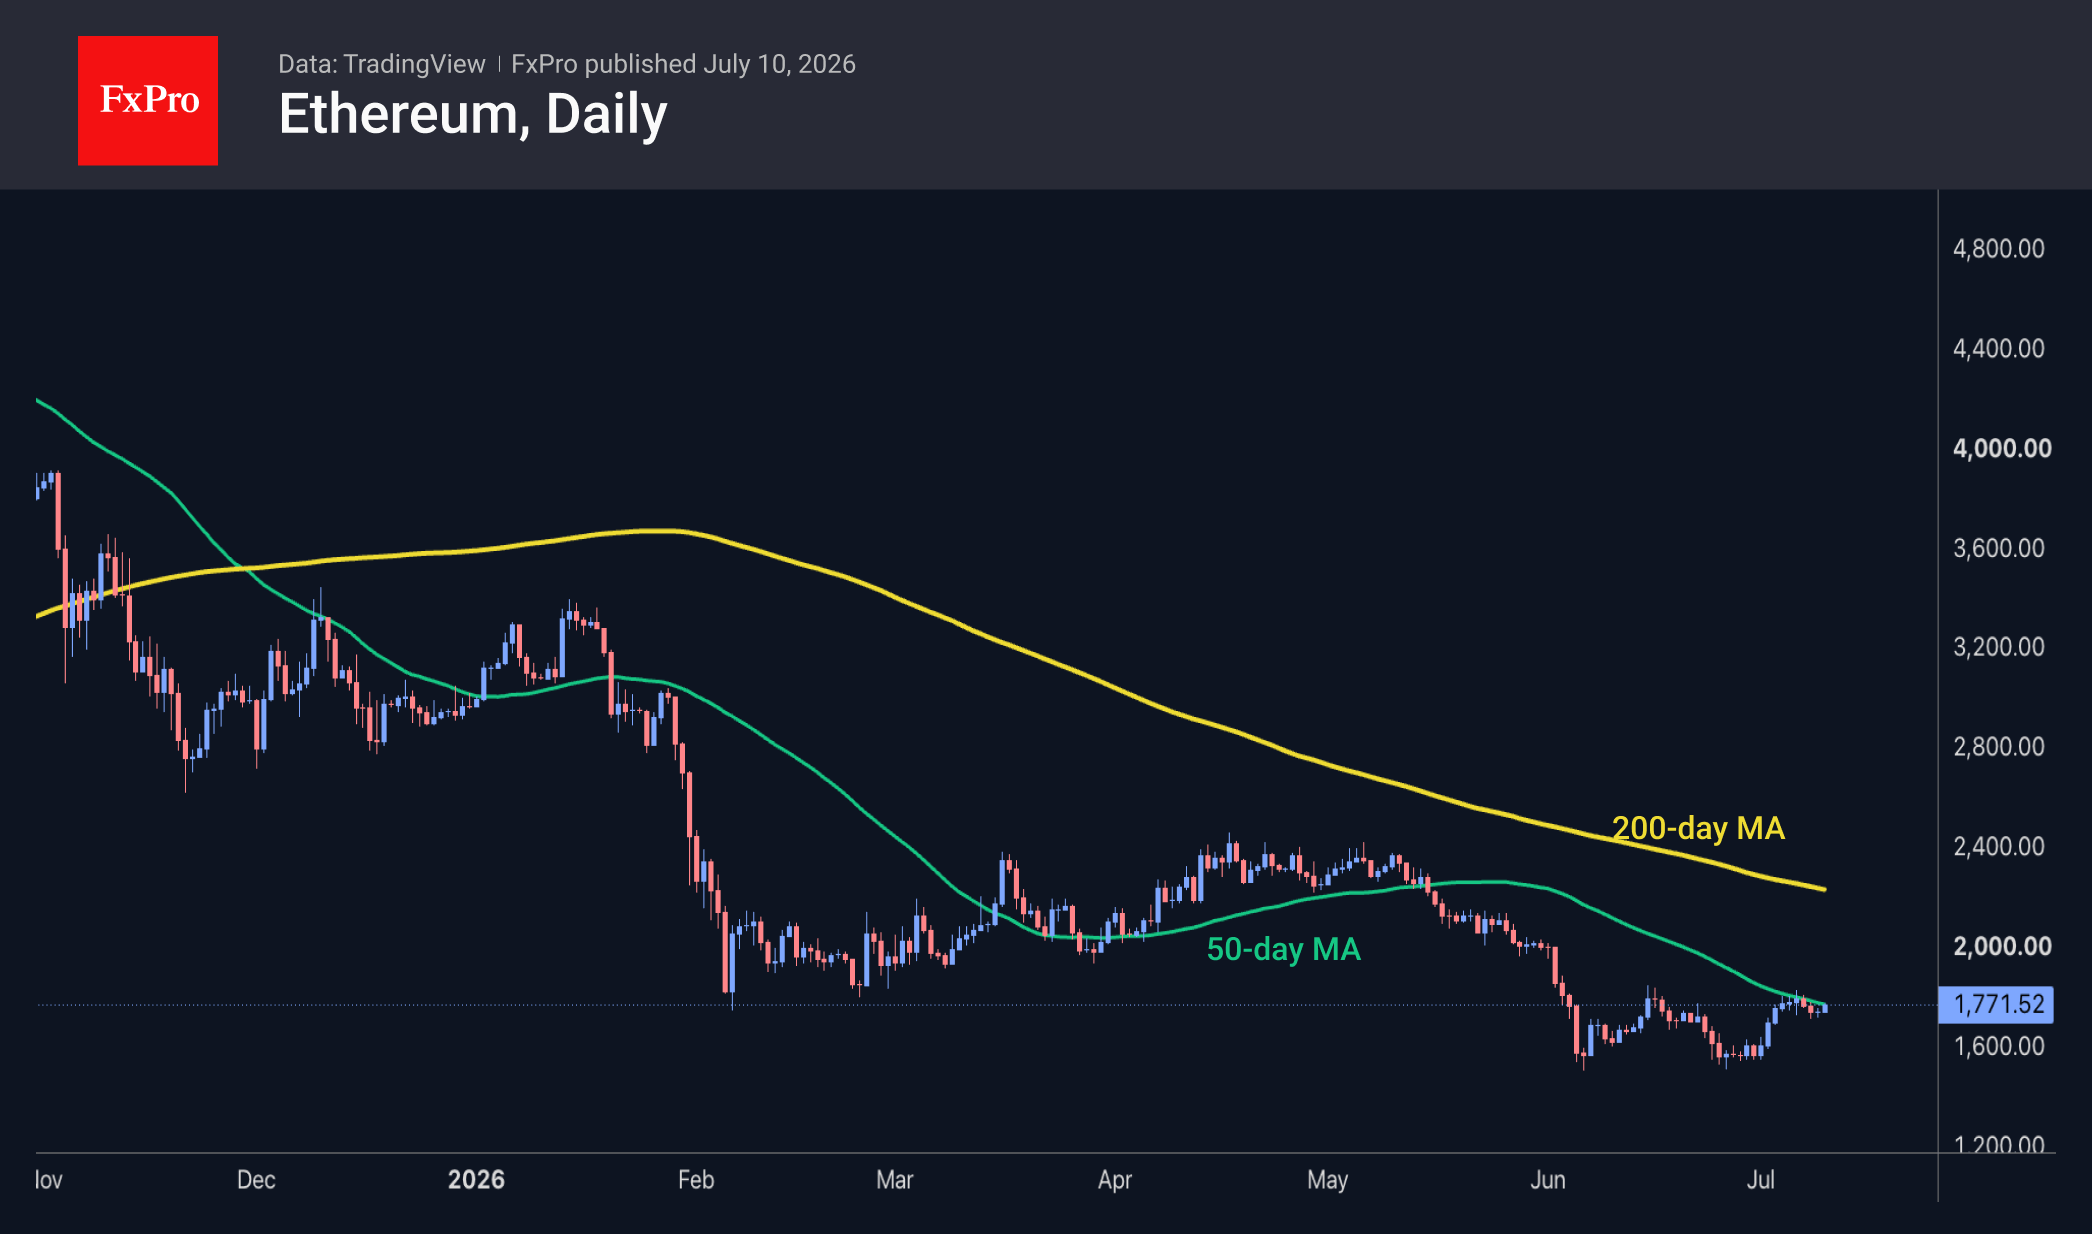
Ethereum’s recovery stalled after reaching the 50-day moving average region near $1,800 at the start of the month. Resistance is further reinforced by the fact that the coin reversed around this level last month and, prior to that, in February, found support here. ETHUSD failed to quickly confirm a break of the downtrend following the rebound from June’s lows, as the previous support level has now become significant resistance. A sustained move above the 50-day moving average at $1,770 could signal a short-term bullish trend, whilst a firm rise above $1,800 would confirm it.
News Background
Bitcoin has been trading below its realised value of $76,600 for five months now. Such a prolonged period of undervaluation has occurred only a few times in history and has often preceded the formation of a long-term market bottom, according to Glassnode.
According to CryptoQuant, USDC reserves on Binance have fallen by 21.6% over the past month, whilst abnormal one-day USDT outflows have been recorded on the Ethereum network. Such a significant withdrawal of liquidity deprives the market of buying power and makes it more vulnerable to volatility.
Michael Selig, Chair of the US Commodity Futures Trading Commission (CFTC), has described Bitcoin as “one of the most anti-fragile assets”, having survived repeated market upheavals and tough measures by the authorities. In his view, BTC should be regarded as a commodity, similar to gold, silver or oil. The CFTC Chair has called on Congress to expedite passage of the CLARITY Act.
Crypto custodian BitGo is set to launch quantum-resistant Bitcoin wallet tools for institutional clients in the coming weeks, including address risk assessment, automatic transfer of funds from vulnerable wallets and a new UTXO selection method.
Trading volume on the Robinhood Chain DEX reached a record $564 million a week after its launch, amid the hype surrounding meme coins. The layer-two (L2) network is built on Arbitrum and focuses on real-world assets (RWAs).
The FxPro Analyst Team
USD/JPY Falls as Yen Recovers Weekly Losses
USD/JPY fell to 161.67 on Friday, with the yen fully recovering its losses from the beginning of the week. Market participants are once again increasing expectations of possible intervention by Japanese authorities, following the national currency's recent move to nearly 40-year lows.
Investors are also awaiting the release of official intervention data later this month to determine whether the Bank of Japan's actions were behind the yen's sharp – though brief – gains in recent weeks.
Fresh macroeconomic data has attracted additional attention. Japan's producer prices rose 7.1% year-on-year in June, marking the fastest pace since March 2023. Cost pressures remain elevated due to the Middle East conflict and the significant weakening of the yen.
At the same time, the Japanese currency found support from lower oil prices following reports that the US and Iran intend to continue peace negotiations despite the recent escalation. The decline in oil prices prompted a retreat in both the dollar and US Treasury yields, while also easing concerns about rising import costs for Japan, which remains one of the largest buyers of Middle Eastern oil.
Technical Analysis
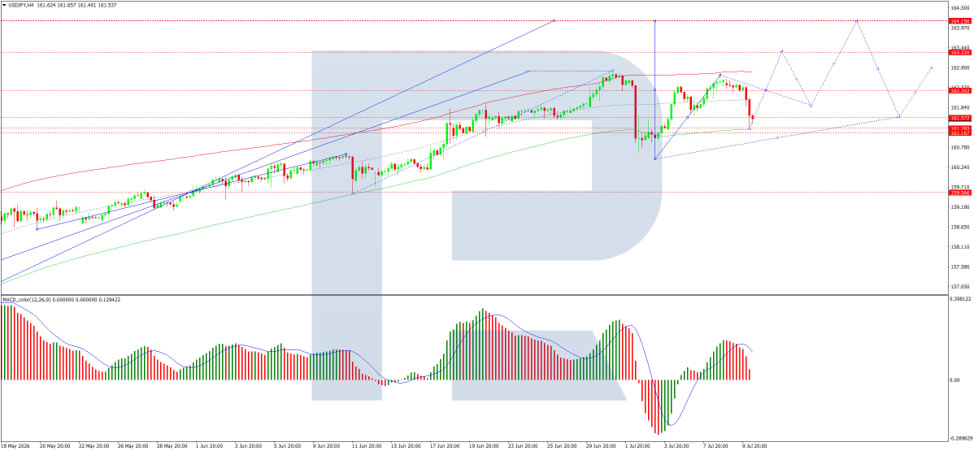
On the H4 USD/JPY chart, the market is forming a consolidation range around the 161.57 level, currently extending up to 162.62. A decline towards 161.30 is expected today, followed by a rebound to 162.62, with scope for the trend to extend to 164.15. The MACD indicator supports this scenario, with its signal line above zero and pointing firmly upwards, reflecting continued bullish momentum.
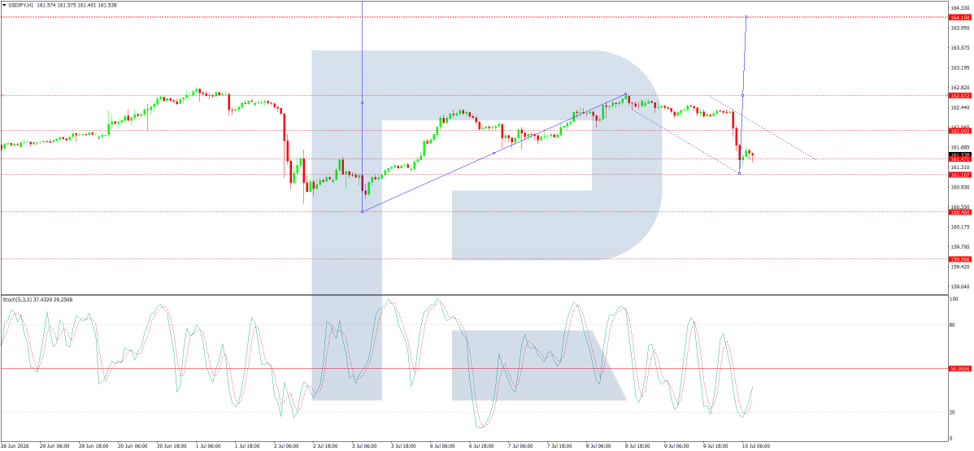
On the H1 chart, the market has completed a downward move to 161.20, with a possible extension to 161.16. A move higher towards 162.62 is expected. A breakout above this level would open the way for a continuation towards 164.15. The Stochastic oscillator confirms this scenario, with its signal line above 20 and pointing upwards towards 80, indicating increasing short-term upside momentum.
Conclusion
The yen has fully recovered its losses from the start of the week, supported by renewed expectations of potential Japanese intervention and lower oil prices following signs of US–Iran peace negotiations. Producer prices in Japan rose at their fastest pace since March 2023, reflecting persistent cost pressures from the Middle East conflict and currency weakness. However, falling oil prices eased concerns over Japan's energy import costs and contributed to a retreat in the dollar and Treasury yields. Technically, USD/JPY may see further downside towards 161.30 in the near term, but the broader uptrend remains intact, with potential for a rebound towards 162.62 and beyond. The market's focus now turns to official intervention data for confirmation of recent central bank activity.
Australian Dollar Holds Above the Current Market Profile
The minutes from the Reserve Bank of Australia's (RBA) June meeting, released on 30 June, suggested that policymakers are not yet ready to rule out further policy tightening. Board members noted persistent excess demand and broad-based inflationary pressures across the economy, leaving the door open for another interest rate increase if required. Against this backdrop, the interest rate differential between Australia and the United States continues to support the Australian dollar, particularly as markets have scaled back expectations for further tightening by the Fed in the coming months. This combination of a relatively hawkish RBA and a more cautious Fed has helped underpin demand for the Australian dollar, although further macroeconomic data from both economies will likely be needed to reinforce this trend.
Technical Picture
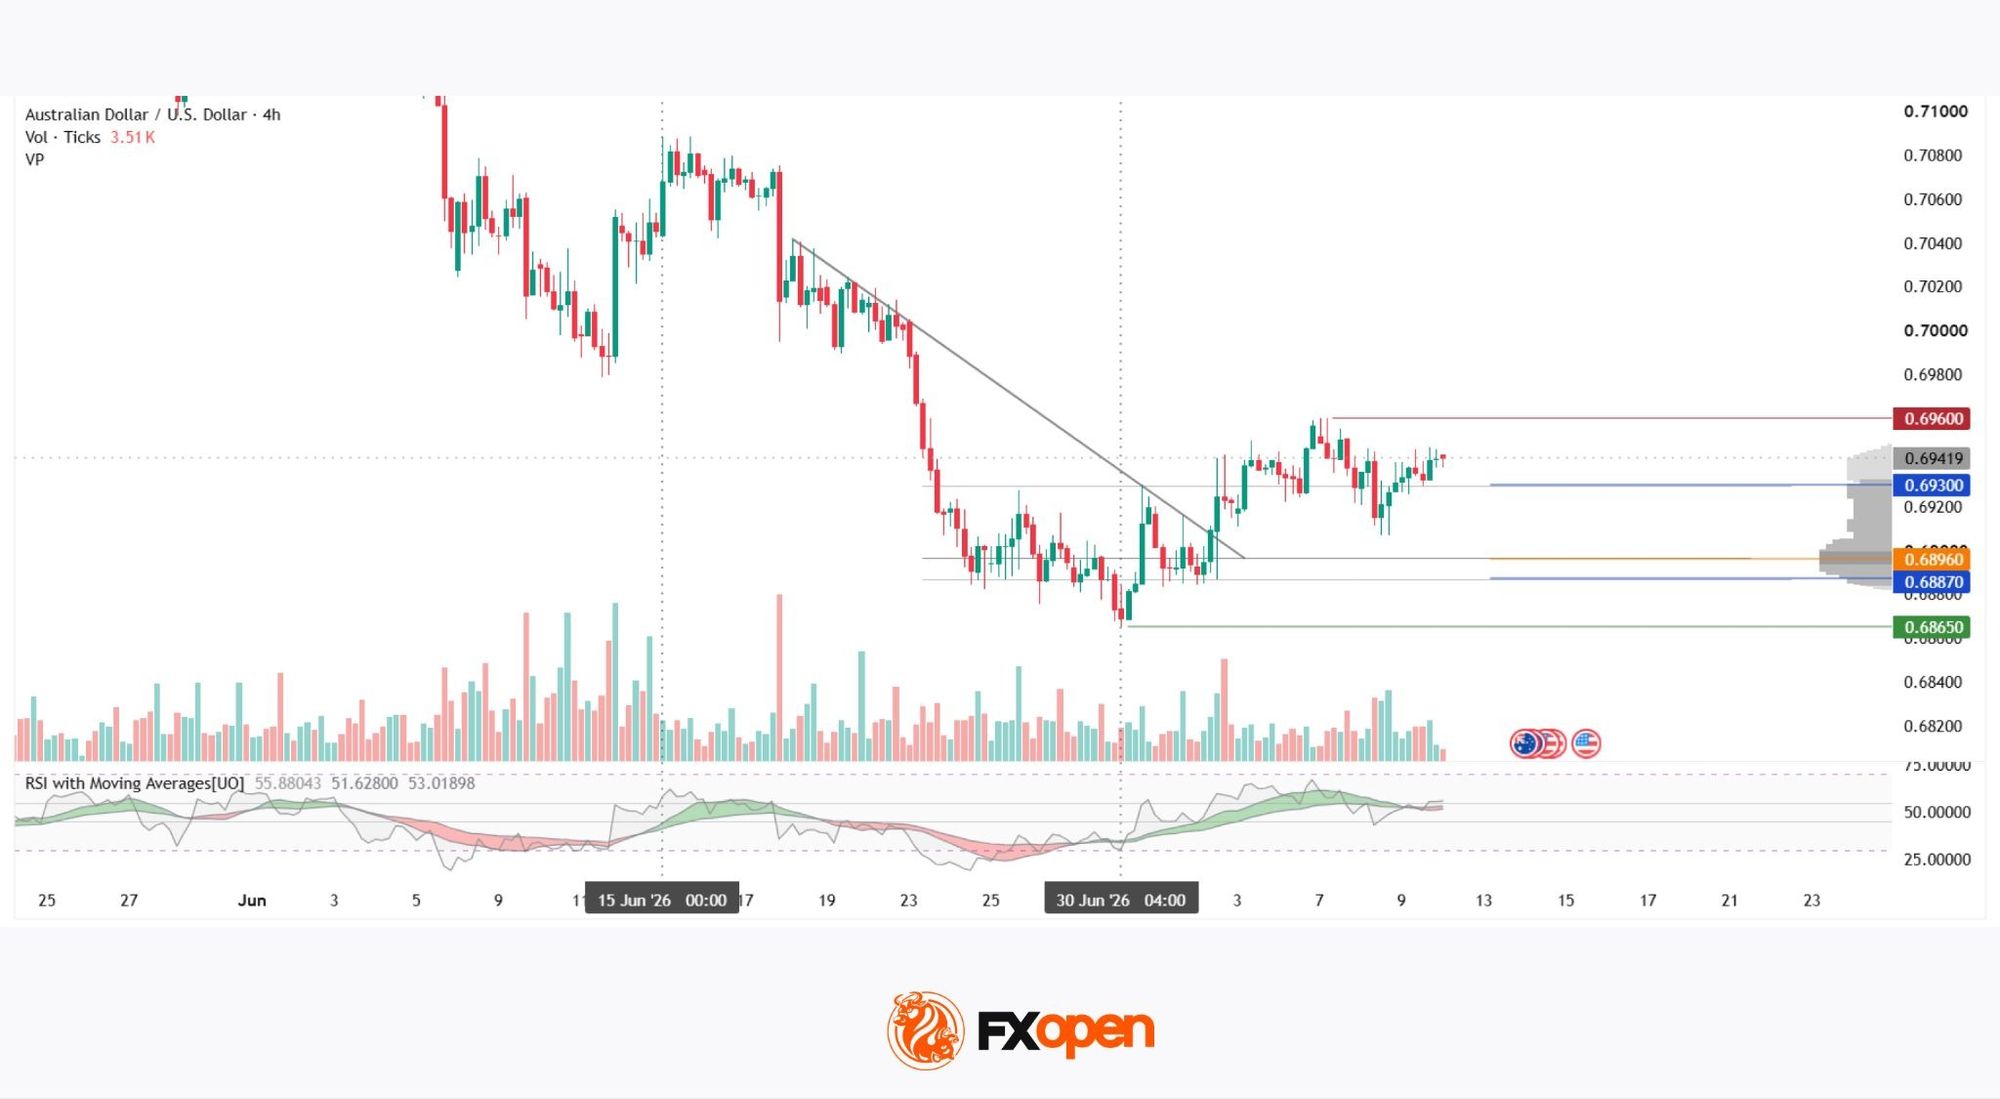
On the 4-hour chart, AUD/USD recovered after declining from the 0.7080 area to June lows near 0.6865. During the rebound, the pair broke above its descending trendline, which some market participants may interpret as a sign that the previous downtrend has come to an end.
The pair is currently trading above the upper boundary of the current market profile at 0.6930 and is approaching the local high around 0.6960. Below the current price lies the Point of Control (POC) at approximately 0.6896, followed by the lower boundary of the market profile at 0.6887. This area could be viewed by buyers as a potential support zone.
Beneath this range sits the green support level 0.6865, representing the next significant reference point should a deeper correction develop. The RSI + MAs indicator remains close to the equilibrium zone, with readings of 55, 51, and 53. The moving averages are broadly flat, suggesting a lack of strong momentum and indicating that the market may be pausing before choosing its next direction.
Summary
The pair's position above the market profile and the break of the descending trendline may be viewed as supportive for buyers. However, the approach towards the 0.6960 resistance area could limit further gains unless additional fundamental catalysts emerge.
Trade over 50 forex markets 24 hours a day with FXOpen. Take advantage of low commissions, deep liquidity, and spreads from 0.0 pips (additional fees may apply). Open your FXOpen account now or learn more about trading forex with FXOpen.
This article represents the opinion of the Companies operating under the FXOpen brand only. It is not to be construed as an offer, solicitation, or recommendation with respect to products and services provided by the Companies operating under the FXOpen brand, nor is it to be considered financial advice.
Sunrise Market Commentary
Markets
While upward pressure on oil prices eased throughout the day yesterday, (natural) gas prices kept adding to the recent gains. The Dutch TTF future hit the €50/MWh for the first time in a month, up 25% from their recent lows (which in turn were about a third higher than pre-war levels). That followed reports from key producer Qatar pausing its push to ramp up LNG output over concerns that transit through the Hormuz Strait isn't safe. Gas is an important component in the euro area's energy mix and features the ECB discussions as prominent as oil does. Markets however took comfort from the latter's price developments over the last 24 hours. Core bonds recovered from their Wednesday whammy, dragging German yields up to 6 bps down at the front end. An October ECB hike remains more than fully priced in. Longer maturities ended flat after turning in additional, marginal gains earlier on the day. Gilts outperformed Bunds with UK yields shedding 6.7-9 bps across the curve. The US Treasury yield curve bull steepened as well, correcting lower by 0.8-4.5 bps. A $22bn 30-yr auction yesterday stopped through with demand metrics strong, helping to push bonds higher be it temporarily. Stock markets rebounded, led by tech (Nasdaq +1.3%) and kept the USD slightly in the defensive. DXY finished sub 101. EUR/USD rose a bit higher north of the 1.14 big figure. USD/JPY stabilized around 162+ levels. The yen, however, is taking the lead in Asian dealings this morning. The pair pushes lower towards 161.5. That followed on news that the Japanese government is pursuing measures that would include one of the world's largest pension funds to do substantially greater investments in Japanese financial assets (see below). It's triggering some of the biggest moves overnight (including in JGB's). Other news is limited. The US said that technical talks with Iran are continuing, perhaps easing some concerns for the conflict to re-escalate into a full blown war. It is, however, nothing new. President Trump, after considering the ceasefire to be over for him, kept the door open for talks, leaving it up to the negotiators to do as they see fit. Brent even slightly grinds higher to $76. Today's eco calendar is all but empty. In technical and probably uninspiring trading going into the weekend we do keep an eye at the long end of the curve that appears to be easily triggered into a yield rise but not as much into a decline.
News & Views
Japanese Finance Minister Satsuki Katayama said the government wants the country's pension funds to substantially lift investments in domestic assets. The Fin Min explained this aim as she assessed that the government wants 'to ensure that the public can directly benefit from Japan's economic growth'. From a market point of view, it would be especially relevant for Japanese financial markets if the Government Pension Investment Fund, managing 293.6 trillion yen (about $1.8 tn), would allocate more of its investments into the domestic markets. Japanese markets at least performed constructively this morning with the Nikkei gaining 1.7%. Long-term Japanese bonds rebound after a difficult period of late (10-y JGB -9.6 bps; 30-y JGB -7.3 bps). Even the yen rebounded from the USD/JPY 162.4 area to the USD/JPY 161.5 area. Regarding Japanese data, Japanese June PPI printed 0.4% m/m and 7.1% y/y (from 1.1% and 6.6% in May). The y/y measure was the highest since the spring of 2023. This kind of pass-through of costs also still supports the case for a continuation of policy normalization.
Inflation in Mexico eased for the third consecutive month in June. Headline inflation declined 0.27% m/m, slowing y/y inflation from 3.94% to 3.37%, the lowest figure since early 2021. Core inflation printed at 0.24% m/m and 4.03% y/y (from 4.19%). The central Bank of Mexico has an inflation target of 3% with a tolerance band of 1ppt. It published the minutes of its June 25 decision when it left the policy rate unchanged at 6.5% in a unanimous decision. The unchanged decision came after a 25 bps cut in May. The bank saw appropriate to keep the policy rate at current level and expects that it might stay at that level for some time to come, even as it discussed upside inflation risks especially in the services sector. The recent decline of inflation was seen as having been driven by non-core components. After a sustained rally throughout most of 2025, the peso over the previous months holds rather strong in a relative tight range between USD/MXN 17.1 and 17.7.
Yen Jumps as Markets See Katayama’s Pension Fund Push as Structural Fix for Currency Weakness
Yen strengthened broadly today after Japanese Finance Minister Katayama said Tokyo wants to encourage pension funds, including the Government Pension Investment Fund (GPIF), to increase investment in domestic financial assets. While no formal policy changes were announced, markets interpreted the comments as a potential shift toward addressing one of the Yen's most persistent structural weaknesses: sustained capital outflows into overseas assets.
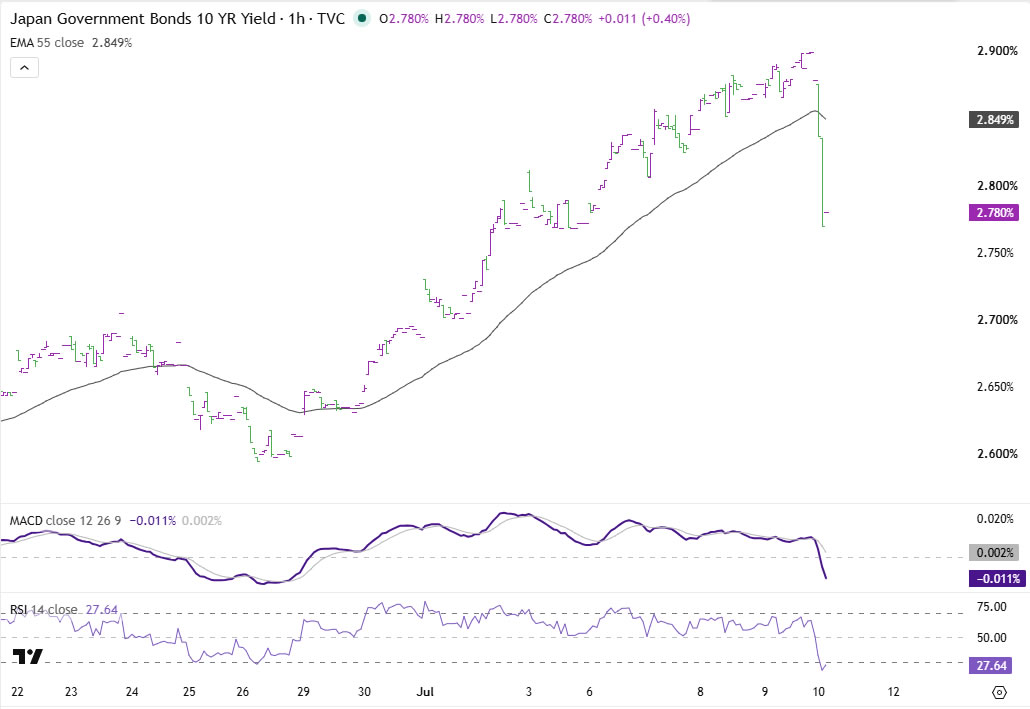
The reaction extended well beyond the currency market. Japanese government bonds rallied sharply across the curve, with the 20-year yield falling 11.5 basis points to 3.75%, the 10-year yield dropping 10 basis points to 2.775%, and both the 30- and 40-year yields declining by more than 8 basis points.
A Shift From Intervention Toward Capital Flows
The market's response reflects the sheer scale of Japan's institutional investors. GPIF, the world's largest pension fund with approximately JPY 292.6 trillion in assets, has maintained a broadly balanced allocation between domestic and overseas bonds and equities since its landmark portfolio overhaul in 2014.
That shift away from Japan created a decade of structural capital outflows as hundreds of trillions of Yen were converted into foreign currencies to purchase overseas assets. Katayama's comments were therefore interpreted as opening the possibility—however tentative—of partially reversing that process.
Why Markets Reacted So Strongly
Such a shift could support the Yen through two channels:
- First, greater allocation to domestic assets would require converting part of existing foreign-currency holdings back into Yen, creating structural demand for the currency independent of any official intervention.
- Second, stronger demand for Japanese government bonds would provide additional long-term support for the JGB market at a time when investors have become increasingly concerned about rising long-end yields and Japan's fiscal outlook. In that sense, encouraging greater domestic investment could simultaneously strengthen the Yen and ease pressure on government borrowing costs.
More broadly, the proposal fits Japan's search for alternatives to conventional foreign-exchange intervention. With the interest-rate gap between the Federal Reserve and the Bank of Japan still around 250-275 basis points, aggressive BoJ tightening remains unlikely in the near term. Addressing capital flows instead offers policymakers another avenue to moderate structural Yen weakness without relying solely on either rate hikes or spot-market intervention.
A Structural Idea, Not Yet a Policy
Nevertheless, today's market move may prove premature if concrete follow-through fails to materialize. Katayama spoke only of encouraging greater domestic investment rather than announcing any formal portfolio changes. GPIF operates under an independent board with a fiduciary responsibility to maximize long-term returns, and its strategic asset allocation is typically reviewed only during its multi-year planning process rather than in response to ministerial comments.
Markets have seen similar episodes before, including last week's speculation over changes to Japan's intervention strategy, which quickly faded once no policy action followed. Moreover, even a meaningful reallocation by GPIF would not eliminate the large interest-rate differential that continues to underpin global carry trades against the Yen.
USD/JPY Extending Consolidations
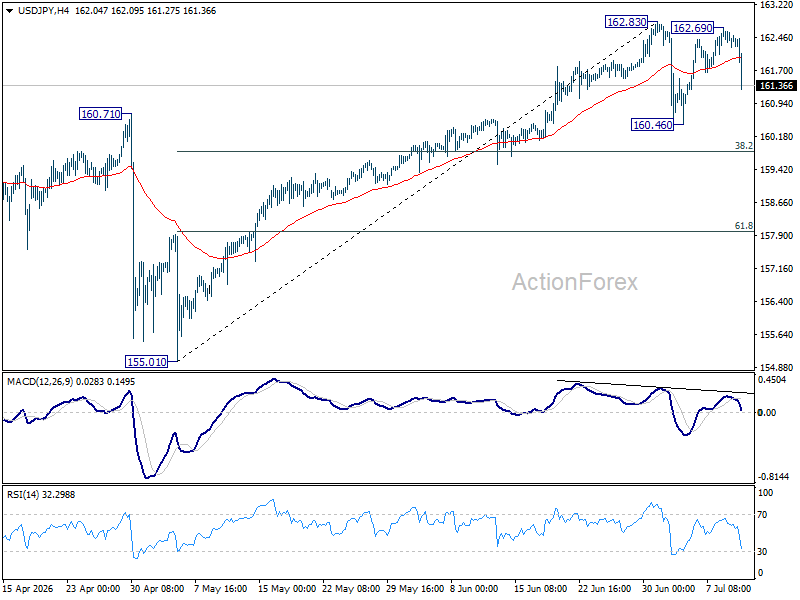
Technically, USD/JPY's sharp decline confirms that the rebound from 160.46 has completed at 162.69 after rejection by the 162.83 high. However, the broader outlook remains unchanged.
The decline from 162.83 is viewed as the third leg of a consolidation pattern within the larger uptrend from 155.01. Deeper pullback could be seen to 160.46 and below. But strong support to emerge at 38.2% retracement of 155.01 to 162.83 at 159.84 to contain downside. The long term up trend is expected to resumed at a later stage, just delayed.
USD/JPY Holds Firm, but Is Another Upswing Ahead?
Key Highlights
- USD/JPY started a fresh increase but struggled near 162.80.
- A major bullish trend line is forming with support at 161.60 on the 4-hour chart.
- Bitcoin could gain bullish momentum if it settles above $65,000.
- WTI Crude Oil prices recovered some losses before the bears appeared near $76.20.
USD/JPY Technical Analysis
The US Dollar gained bullish momentum after it settled above $160.80 against the US Dollar. USD/JPY even climbed above 162.00 before it faced rejection.
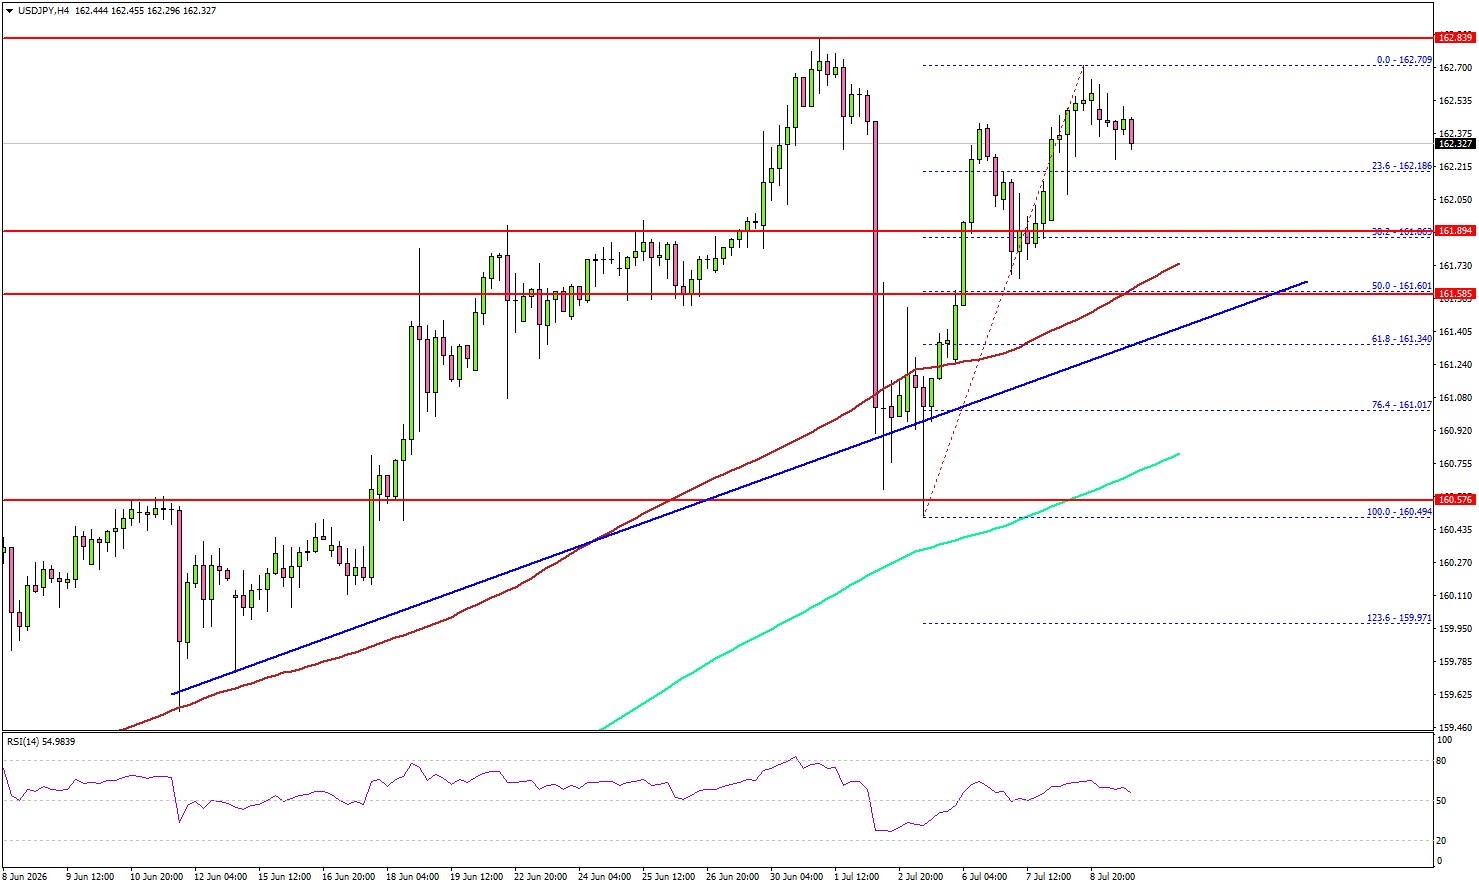
Looking at the 4-hour chart, the pair again struggled to surpass the 162.70 and 162.80 levels. It is now correcting some gains and might dip toward the 38.2% Fibonacci retracement level of the upward move from the 160.49 swing low to the 162.70 high.
If there are more losses, the pair might find support near 161.60. Besides, there is a major bullish trend line forming with support at 161.60, the 100 simple moving average (red, 4-hour), and the 50% Fibonacci retracement.
The first major support could be near 160.80 and the 200 simple moving average (green, 4-hour). A downside break and close below 160.80 might send the pair toward 160.00. Any more losses could open the doors for a test of 158.80.
On the upside, the bears might remain active near 162.80. The next major resistance might be 163.40. A close above 163.40 could spark a sharp increase. In the stated case, the bulls could aim for a move to 165.00.
Looking at Bitcoin, the price could start a fresh increase, but a close above $65,000 is important for upside continuation.
Upcoming Key Economic Events:
- USDA WASDE Report.
- Canada’s Net Employment Change for June 2026 – Forecast 10K, versus 87.8K previous.
- Canada’s Unemployment Rate for June 2026 - Forecast 6.6%, versus 6.6% previous.
Japan PPI Hits Fastest Pace Since 2023 as Energy, AI Demand Drive Costs Higher
Japan's producer inflation accelerated more than expected in June, highlighting mounting cost pressures from the Middle East conflict, robust AI-related demand and the persistent weakness of the Yen. Producer Price Index rose 0.4% month-on-month and 7.4% year-on-year, exceeding expectations of 0.3% and 6.8% respectively. Annual producer inflation accelerated from 6.6% in May to its fastest pace since March 2023, suggesting upstream price pressures remain firmly elevated.
The increase was led by a 22.8% surge in fuel prices as higher energy costs continued to feed through supply chains following the conflict in the Middle East. At the same time, non-ferrous metal prices climbed 39.2% from a year earlier, reflecting strong global demand for AI-related raw materials. Together, the data indicate that both geopolitical supply shocks and structural investment trends are continuing to lift production costs across Japanese industry.
A weak Yen added another inflationary pressure. The Yen-based import price index accelerated to a 29.7% year-on-year increase in June from a revised 26.1% in May, underscoring the rising cost of imported raw materials. While producer inflation does not automatically translate into consumer inflation, the latest figures reinforce the Bank of Japan's assessment that price pressures remain elevated and will keep attention on how much of these higher input costs firms are able to pass on to households in the months ahead.
| Indicator | June | May | Expectation |
|---|---|---|---|
| PPI (MoM) | 0.4% | 1.1% | 0.3% |
| PPI (YoY) | 7.4% | 6.6% | 6.8% |
| Fuel Prices (YoY) | 22.8% | — | — |
| Non-Ferrous Metals (YoY) | 39.2% | — | — |
| Import Price Index (JPY basis, YoY) | 29.7% | 26.1% | — |
Loonie Tunes: Playing Second Fiddle to the Greenback
Highlights
- The Loonie has lost substantial ground to the greenback this year, a fate it shares with several other major G10 currencies.
- Wider interest-rate gaps have made U.S. assets more attractive, adding pressure on CAD alongside other advanced-economy currencies.
- The baseline still points to eventual loonie recovery, but that view is vulnerable if U.S. productivity strength keeps rates higher and USD assets more attractive for longer.
The Canadian dollar has weakened materially against the U.S. dollar this year, trading near the bottom of its year-to-date range after falling roughly 3.5% to 4% over the first half of the year. The move has been too broad and too closely tied to the repricing of U.S. assets to be read as a purely Canada-specific story. Instead, CAD weakness looks like one expression of a wider shift back toward U.S. dollar exposure, as markets moved away from earlier expectations that the Fed would be able to ease policy more quickly than other central banks.
That distinction matters for the outlook. If the loonie were simply being marked down on domestic concerns, the path forward would depend mainly on Canadian growth, inflation, and Bank of Canada policy. But if the larger force is renewed demand for U.S. dollar assets, CAD is more exposed to the broader global regime: how investors are pricing U.S. growth, U.S. rates, and the relative appeal of holding dollars versus other currencies. The recent evidence points more strongly to the second interpretation.
Loonie vs. Other Currencies
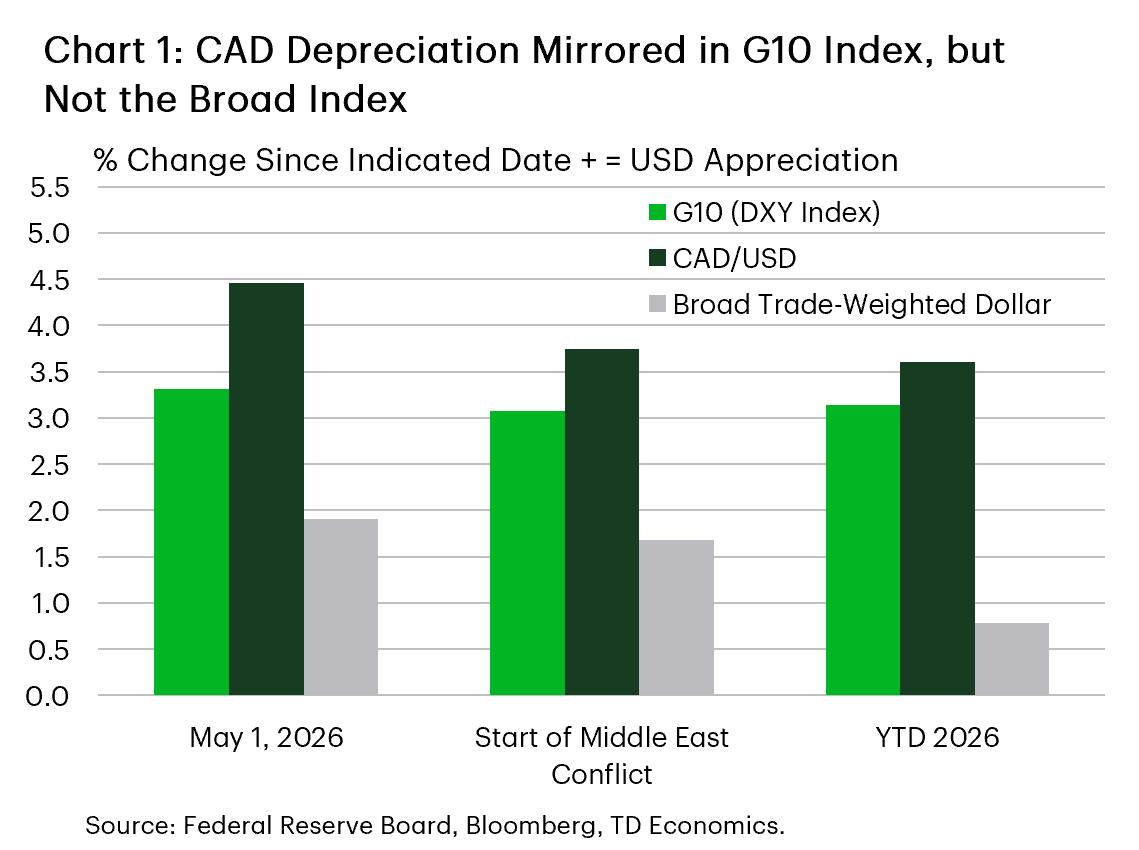
The cross-currency evidence supports this broader framing, but it is important to distinguish between different ways of measuring the U.S. dollar. DXY, the commonly cited "dollar index," tracks the dollar against a small group of major currencies, with the euro carrying by far the largest weight. That makes it useful as a quick read on dollar strength against major advanced-economy currencies, but less representative of how the dollar is moving against the full set of U.S. trading partners. Chart 1 shows that the latest dollar strength has been concentrated most heavily in the currencies that matter most for DXY, while the Federal Reserve's broader dollar index shows a more mixed pattern across the United States' 26 largest trading partners.
A closer inspection of the currencies in the broad index is offered in Chart 2. There, we can see three groups: the first group contains the currencies that have borne a disproportionate share of the latest dollar move, including the euro, loonie, Korean won, Indian rupee, and the Japanese yen. These are large, liquid currencies that carry meaningful weight in most dollar indexes, so their weakness helps explain why the bilateral CAD move has felt severe even though it is not isolated.
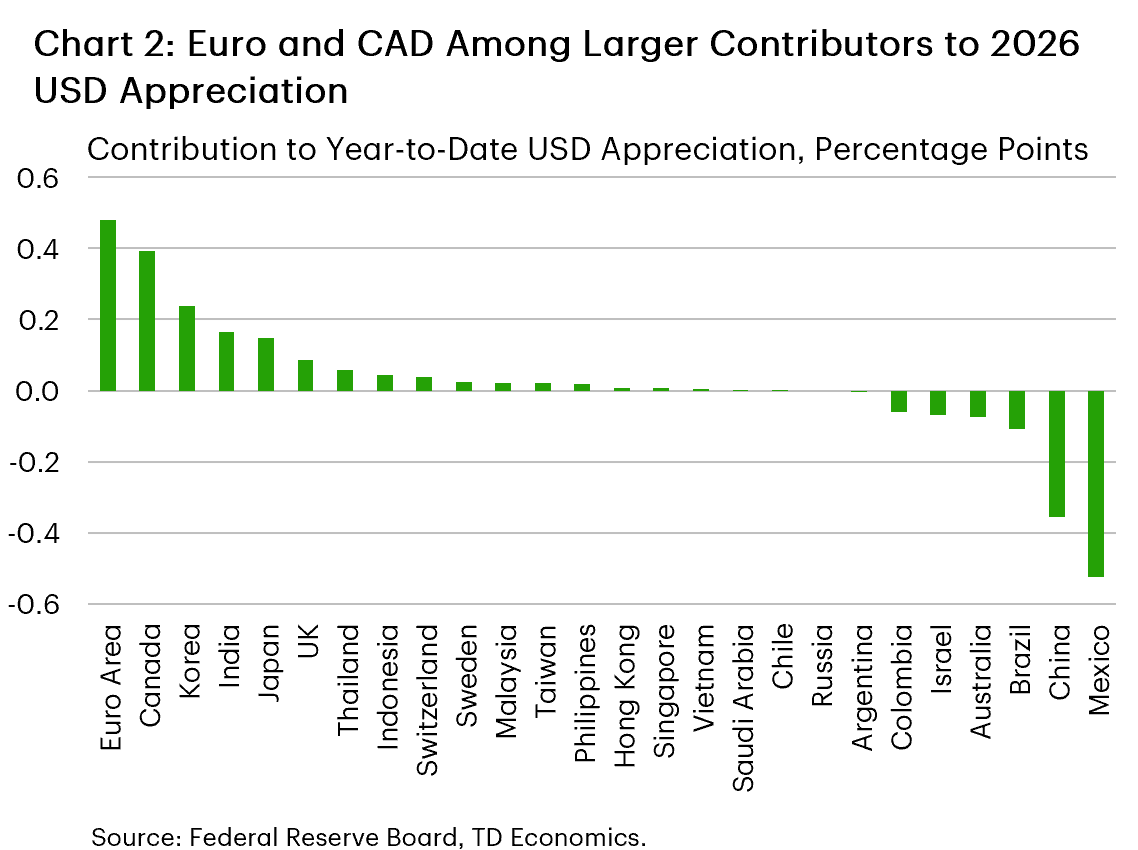
A second group has moved against the broader trend, led by the Mexican peso and Chinese renminbi. The peso is the clearest outlier, supported by high real rates, resilient domestic growth, and optimism around nearshoring, while the renminbi has been steadier than China's soft domestic backdrop would otherwise suggest, helped by policy management and efforts to limit sharp currency moves.
Most remaining currencies sit closer to the middle, moving broadly in line with the aggregate dollar move rather than clearly standing out in either direction.
This split reinforces that CAD has weakened because the dollar backdrop became more supportive, but the intensity of the move also depends on its own mix of growth, rates, policy credibility, and investor positioning. Canada fell into the group where the case for holding local currency became less compelling relative to the U.S. dollar, leaving the loonie more vulnerable once capital began moving back toward USD assets. We consider the usual candidate explanations for this development below.
Signs of Preference for the USD Coming Back
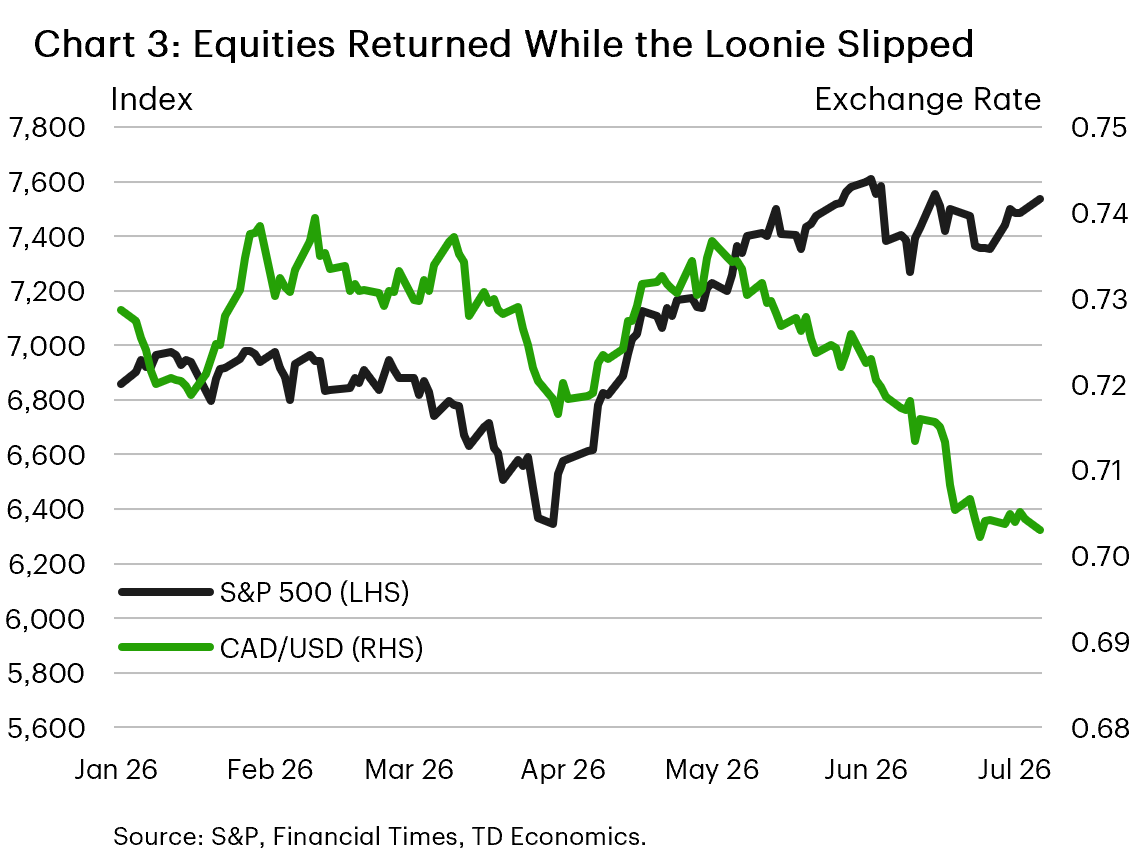
The timing of the move points to renewed preference for U.S. dollar exposure rather than a stand-alone CAD selloff. Chart 3 compares equities with CAD/USD and shows that the loonie started to weaken in May after the U.S. equity markets had recovered. That rebound helped confirm that markets had moved into a more comfortable risk backdrop and capital increasingly gravitated toward the U.S. dollar.
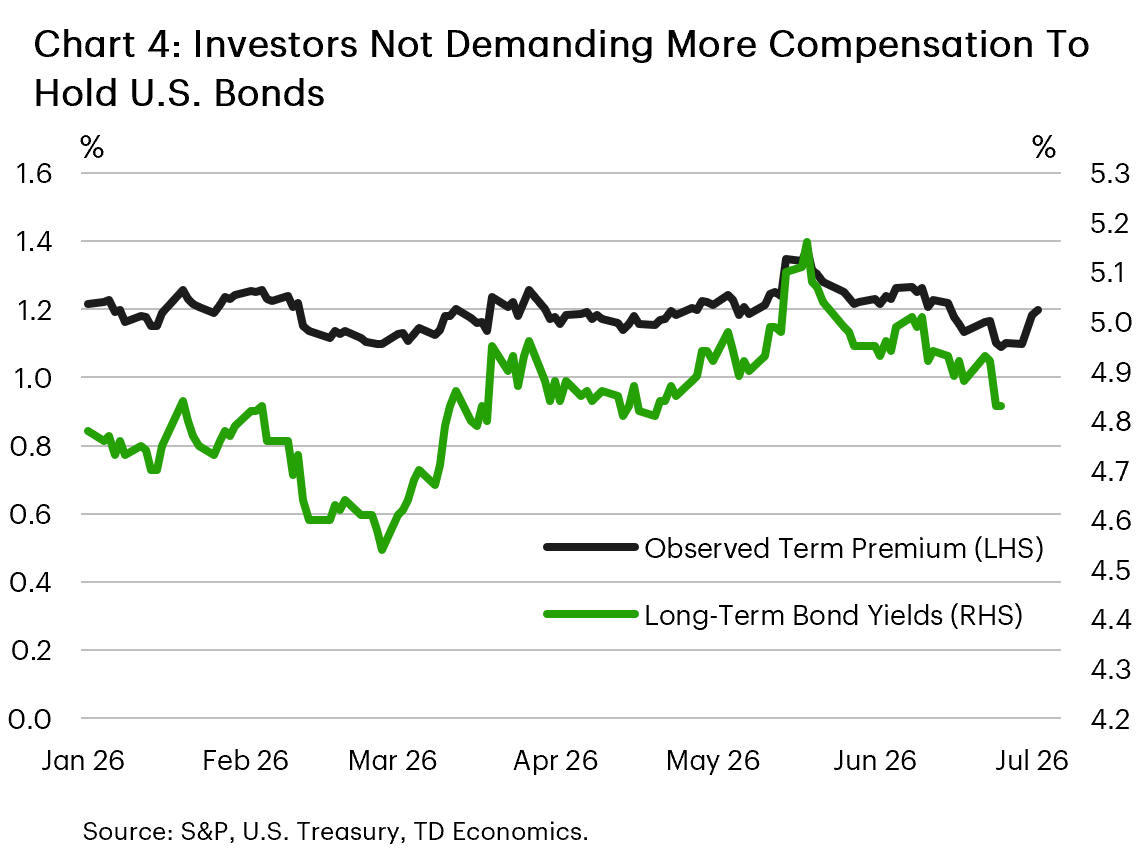
The bond market tells a similar story (Chart 4). Since mid-May, long-term Treasury yields and the observed term premium have moved lower, consistent with renewed demand for U.S. duration and a stronger preference for USD assets. Taken together, the equity and bond signals suggest that the market regime shifted from broad risk repair into a more dollar-centric phase, where investors were willing to take risk but preferred to do so through U.S. assets.
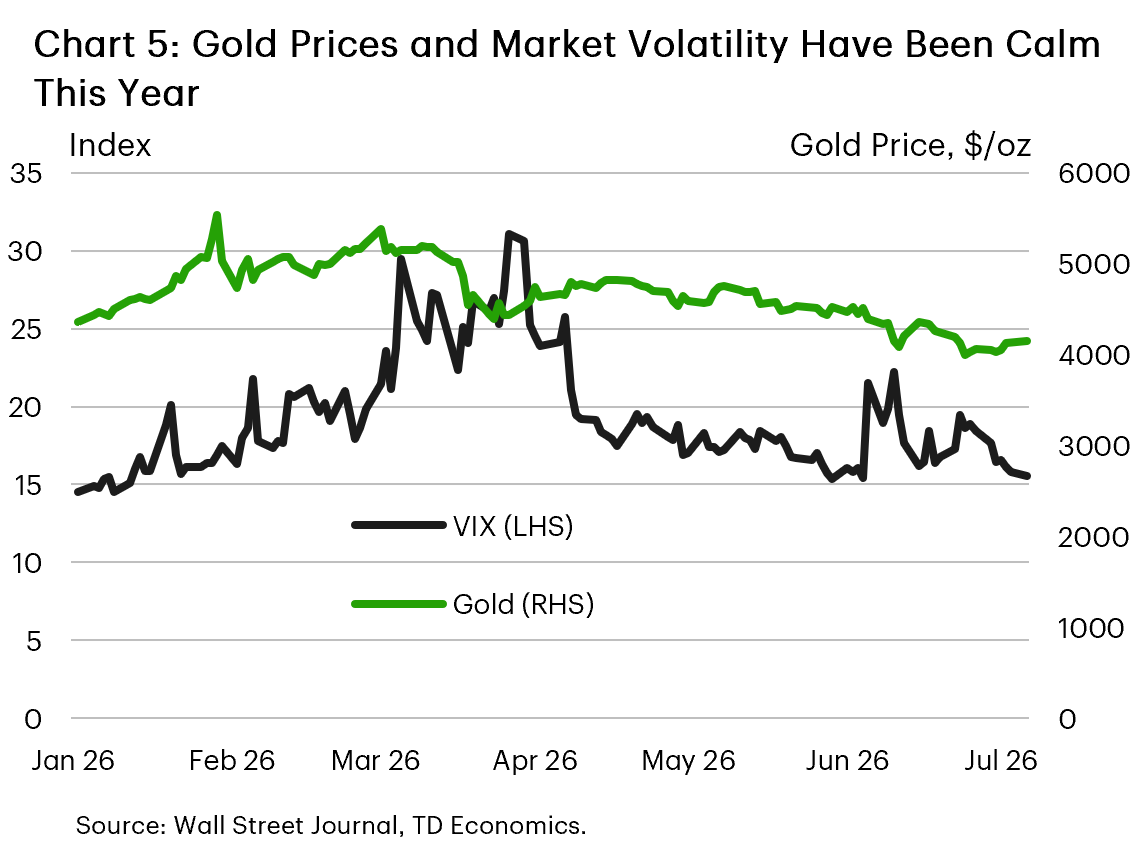
Limited Evidence of a Flight to Safety
That distinction is important because the evidence for a classic flight-to-safety move is not especially convincing. If investors were simply rushing into safe havens, we would expect to see more persistent stress signals across markets. Instead, as shown in Chart 5, the VIX has retraced its earlier spike and gold prices have fallen over this period, weakening the case that CAD weakness is mainly being driven by generalized risk aversion. Other usual safe-haven currencies such as the euro, Swiss franc, and yen have also depreciated against the U.S. dollar this year. The cleaner interpretation is that investors have not abandoned risk altogether; they have become more selective, with U.S. assets and the dollar standing out as the preferred destination.
That leads naturally to the next driver: interest-rate differentials. The preference for USD assets and widening rate differentials are mutually reinforcing: stronger demand for U.S. exposure helps explain the direction of the move, while the growing U.S. rate advantage has made that preference more durable and intensified the pressure on currencies like the loonie.
Interest Rate Differentials
With the start of the war in the Middle East and the push higher on inflation, market expectations for Fed policy changed sharply, pricing in the possibility of Fed rate hikes. This was a sharp reversal from the prevailing sentiment prior to the conflict that the Fed was going to be the lone central bank reducing interest rates in 2026. This means the prior expectation for spreads on borrowing costs between the U.S. and other countries to narrow quickly reversed. The shift is most evident in short-term interest rate spreads between the U.S. and Canada and Germany (Chart 6).
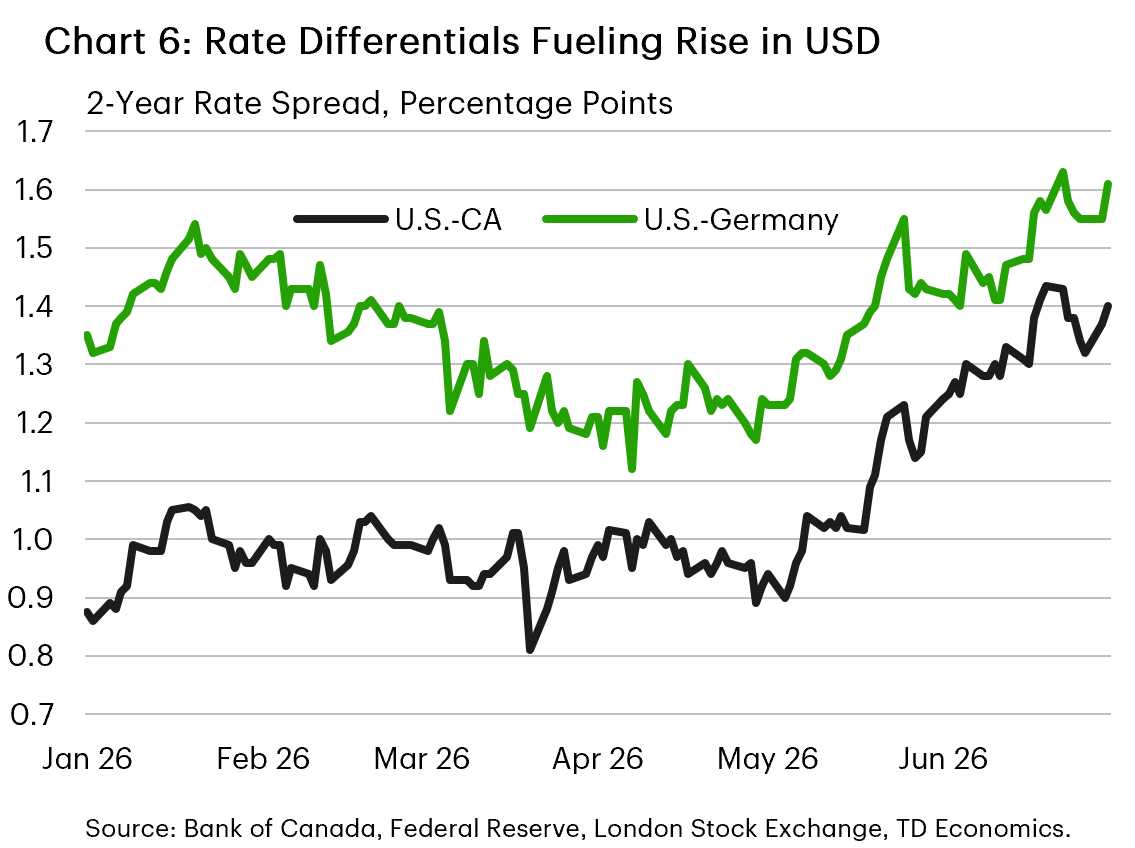
The result of the policy divergence is that spreads vis-à-vis the U.S. on two-year government debt have widened by 25 basis points (bps) and 40 bps for Germany and Canada in the first half of 2026, respectively. The relatively smaller change in Germany is courtesy of a recent hike from the European Central Bank, whereas a dovish Bank of Canada has opted to stay on the sidelines. The widening premium to hold U.S. assets over other countries has helped to lift demand for the dollar, at the expense of other advanced economy currencies like the loonie and euro.
The Path Forward, the Productivity Wildcard and the Loonie
The outlook for the loonie now turns on whether those interest-rate gaps begin to narrow. Our baseline remains that U.S. inflation and growth will moderate in the coming months, allowing the Fed to gradually reduce the fed funds rate to 3.25% in 2027. That would take some pressure off the CAD by lowering the relative return on U.S. dollar assets.
The main risk is that the U.S. economy proves strong enough to keep those rate differentials wider for longer. There are two ways this could happen. The first is a more cyclical scenario, where the energy shock fades but U.S. demand remains firm enough to leave the economy in excess demand. In that case, the Fed would have less room to cut rates without risking renewed inflation pressure.
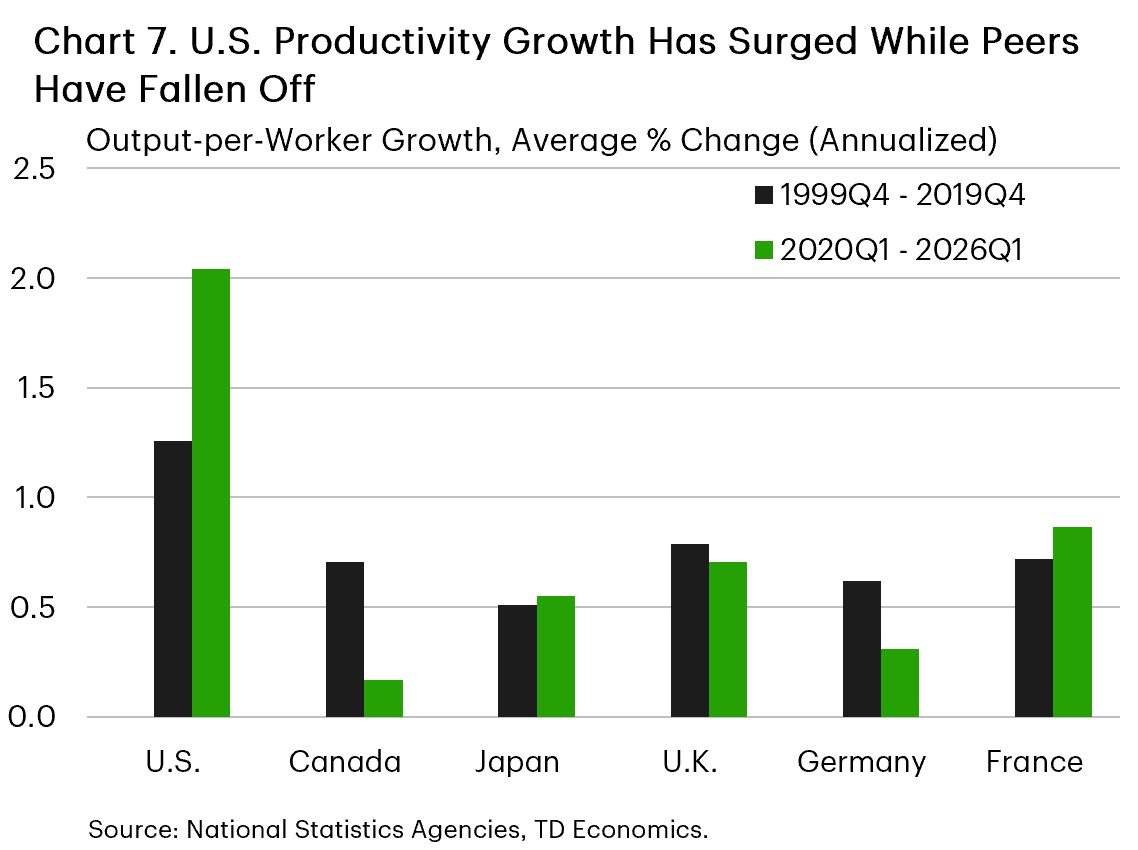
The second, more structural risk is that the productivity gap between the U.S. and its peers does not narrow back toward historical norms. This matters because stronger productivity growth can allow the U.S. economy to sustain faster growth and higher real rates without generating the same inflation pressure. If that advantage persists, the neutral rate in the U.S. could settle higher than in Canada and other advanced economies.
The recent data point in that direction. Since 2020Q1, U.S. output per worker has grown by 2.0% annualized, compared with 1.3% in the 20 years before the pandemic. Canada and other G7 economies have fallen further behind, held back by a mix of weaker capital deepening, softer business investment, and other structural headwinds (Chart 7). Stronger U.S. productivity growth helps explain how the economy has continued to outperform despite materially higher interest rates.
The implication for CAD is straightforward. If stronger U.S. productivity keeps the neutral rate higher, the Fed may not need to deliver as much rate relief as markets currently expect. U.S. short-term rates would remain elevated relative to Canada, preserving the yield advantage that has already helped pull capital toward U.S. assets.
That would leave the loonie vulnerable even if domestic conditions unfold broadly as expected. The baseline still points to some CAD recovery as U.S. rates eventually move lower, but a sustained U.S. productivity advantage would delay that adjustment by keeping rate and growth differentials tilted in favour of the dollar.
Under that scenario, the appreciation expected through the rest of 2026 and into 2027 would likely fail to materialize. Instead, CAD could remain stuck in the 71-72 U.S. cent range into mid-2027, as wider rate and growth differentials continue to make U.S. assets relatively more attractive.