

Sample Category Title
EUR/AUD Daily Outlook
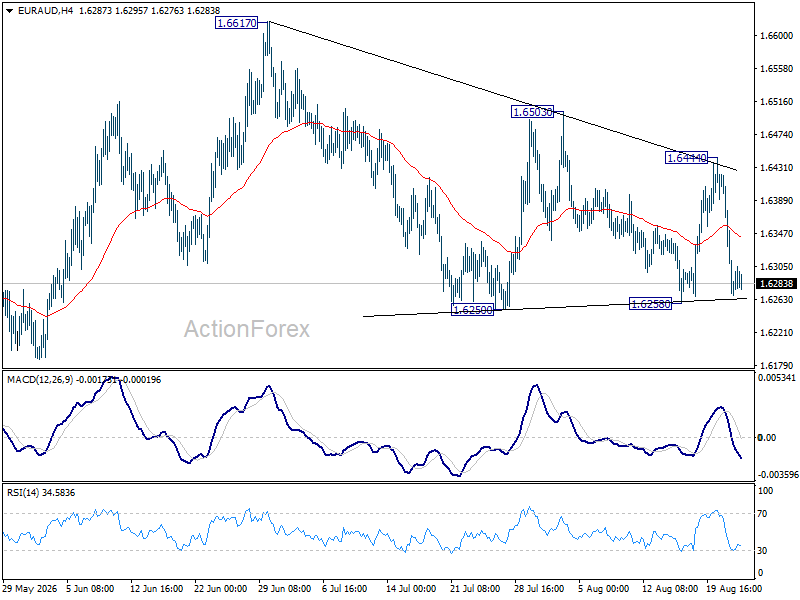
Intraday bias in EUR/AUD stays neutral at this point. On the downside, firm break of 1.6250 will extend the fall from 1.6617 to retest 1.6108 low. On the upside, above 1.6444 will bring another rebound to 1.6503. Overall, corrective pattern from 1.6108 (or 1.6125) could still extend for a while before larger decline resumption.
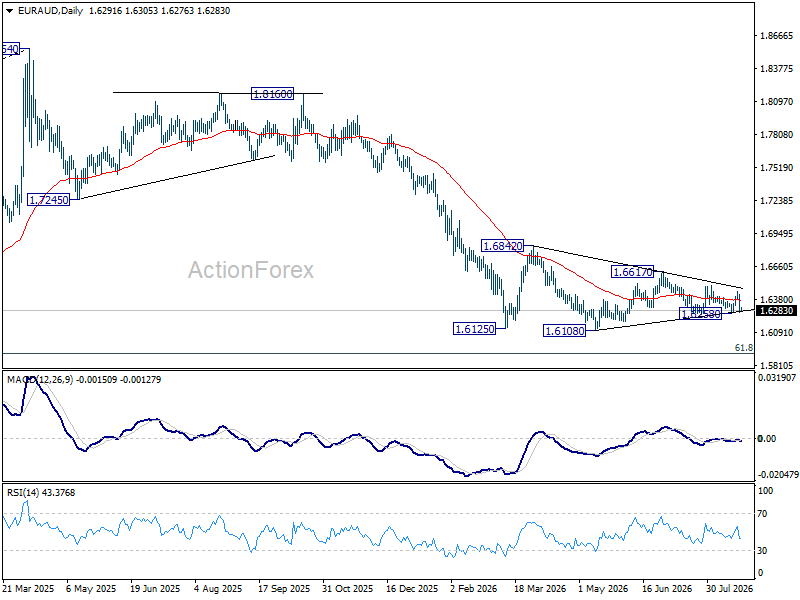
In the bigger picture, outlook will stay bearish as long as 1.6842 resistance holds. Fall from 1.8554 (2025 high) is expected to continue to 61.8% retracement of 1.4281 to 1.8554 at 1.5913. Decisive break there will pave the way back to 1.4281 (2022 low). However, firm break of 1.6842 should confirm medium term bottoming, and bring stronger rally.
EUR/CHF Daily Outlook
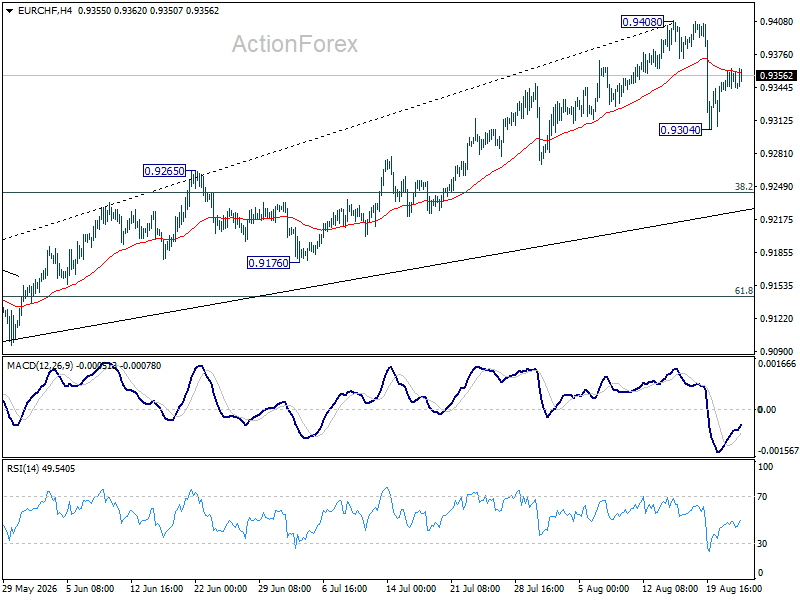
Intraday bias in EUR/CHF stays neutral for more consolidations first. On the downside, below 0.9304 will extend the pullback from 0.9408 short term top. But downside should be contained by 38.2% retracement of 0.8979 to 0.9408 at 0.9244 to bring rebound. Firm break of 0.9408 will resume larger rise from 0.8979.
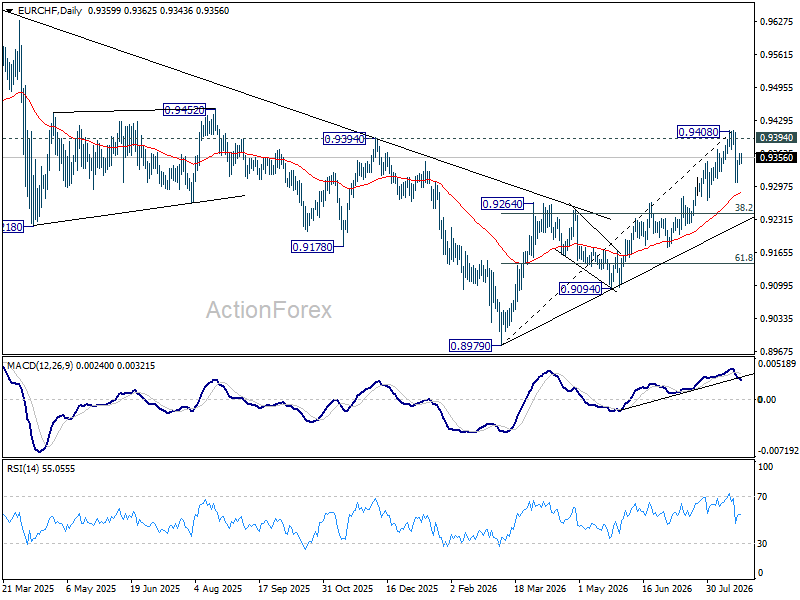
In the bigger picture, the failure to sustain above 0.9394 dampen the bullish case. Outlook is turned neutral first. On the upside, firm break of 0.9394 should confirm that rise from 0.8979 medium term is at least reversing the fall from 0.9928 (2024 high), with prospect of developing into a medium term up trend. Further rally should be seen to 0.9660 resistance next. However, sustained break of 0.9264 resistance turned support will revive medium term bearishness, and bring retest of 0.8979 low instead.
EUR/USD Analysis: Is the Dollar Rally Really Over?
EUR/USD has regained ground in recent sessions, with the pair trading near 1.17 as broad-based weakness in the US dollar continues to dominate the foreign-exchange market. The main driver remains the changing monetary-policy outlook, with investors focused on whether the Federal Reserve can maintain a restrictive stance while the US economy shows signs of slowing.
The dollar faces a key test this week as Fed Chair Kevin Warsh prepares to deliver his first speech at Jackson Hole on Friday. Persistent inflation and rising long-term Treasury yields could encourage a hawkish tone, particularly if Warsh signals that rate cuts in September are far from guaranteed. Conversely, weaker US growth or softer inflation data would reinforce expectations of easier monetary policy and could extend the dollar's decline.
In Europe, euro-area inflation rose to 2.9% in July, keeping price pressures above the ECB's 2% target. The ECB has kept interest rates unchanged since June, but higher energy prices and renewed inflation risks could limit the scope for further easing.
With EUR/USD trading near multi-month highs, the Jackson Hole symposium and upcoming US PCE inflation data could determine whether the euro can extend its advance or whether a hawkish Fed response triggers a renewed recovery in the dollar.
Technical Analysis of EUR/USD
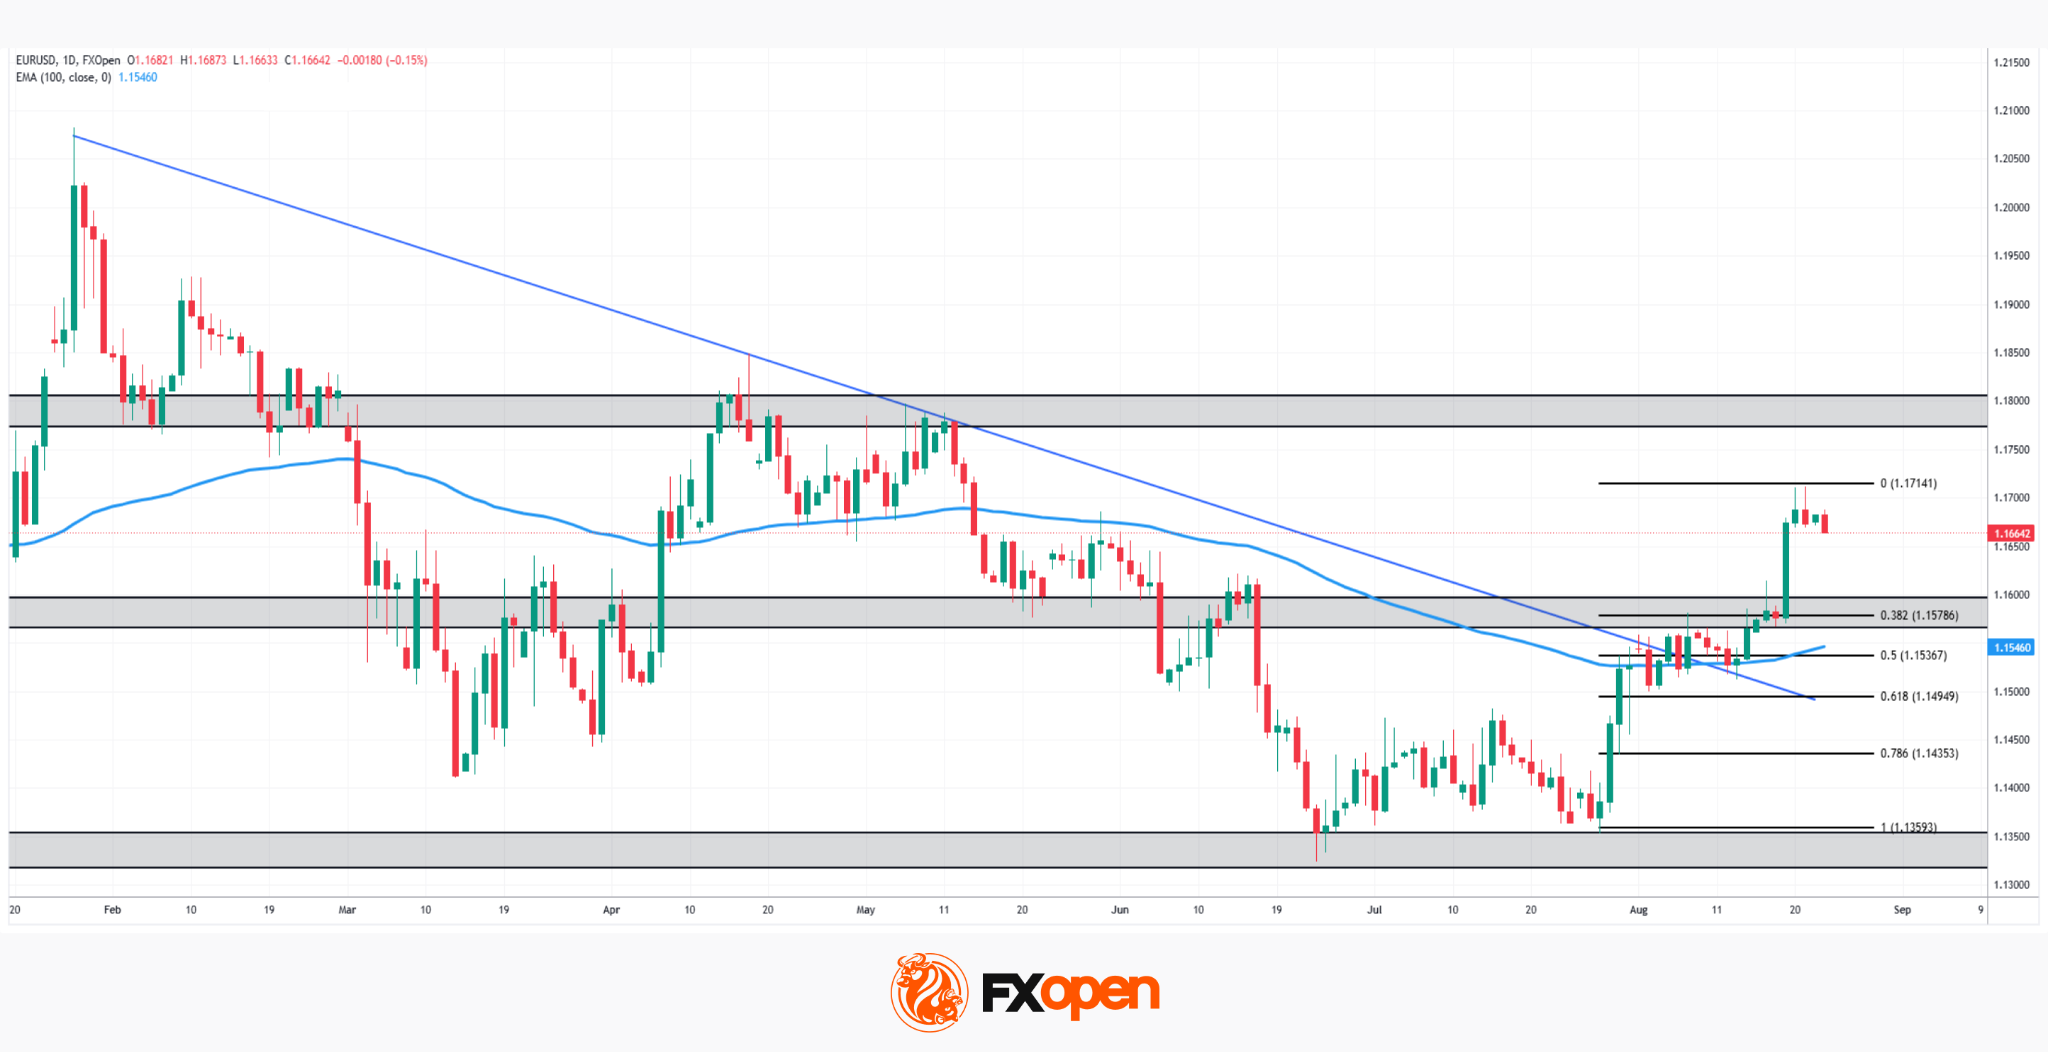
As the daily EUR/USD chart shows, the pair has broken decisively above the descending trendline that had capped price action since the February highs, marking a significant shift in the medium-term structure.
The pair is now trading around 1.1665, comfortably above both the 100-period EMA at 1.1546 and the 0.382 Fibonacci retracement at 1.1579. The breakout has also lifted EUR/USD away from the 1.1537–1.1495 support area, leaving the 1.1714 Fibonacci resistance level as the next major test.
Bullish Scenario
If buyers can maintain control above the 1.1579 Fibonacci level and the 100-period EMA, the bullish structure remains intact.
A break above 1.1714 would open the way towards the 1.1775–1.1800 resistance zone, where previous price action has repeatedly stalled. A sustained move above this area would strengthen the case for a broader recovery and suggest that the longer-term downtrend may have been decisively reversed.
Bearish Scenario
Conversely, a rejection at 1.1714 followed by a break below 1.1579 would weaken the current setup and expose the 100-period EMA around 1.1546, which is closely aligned with the 0.5 Fibonacci level at 1.1537.
A deeper decline through this confluence would bring the 0.618 retracement at 1.1495 into focus, followed by 1.1435 and the 0.786 Fibonacci level as the next downside references.
With EUR/USD testing major Fibonacci resistance after breaking above its descending trendline, the key question is whether buyers can turn the breakout into a sustained advance towards 1.1800, or whether resistance will once again send the pair back towards its key support zone.
Trade over 50 forex markets 24 hours a day with FXOpen. Take advantage of low commissions, deep liquidity, and spreads from 0.0 pips (additional fees may apply). Open your FXOpen account now or learn more about trading forex with FXOpen.
This article represents the opinion of the Companies operating under the FXOpen brand only. It is not to be construed as an offer, solicitation, or recommendation with respect to products and services provided by the Companies operating under the FXOpen brand, nor is it to be considered financial advice.
EUR/USD at Highest Level Since May: What Comes Next?
EUR/USD begins the week at 1.1700 – its highest level since May.
The euro is being supported by improving European economic data and dollar weakness following the US Treasury’s decision to expand its bond buyback program.
Business activity in the eurozone continued to expand in August, with Germany’s industrial sector showing the most notable improvement. Meanwhile, consumer inflation expectations edged slightly lower, with the one-year outlook easing to 2.9% from 3.0%. However, inflation remains above the ECB’s target, keeping expectations of further policy tightening intact.
This week, market attention will focus on economic data from both Europe and the US.
On Tuesday, Germany will release the Ifo business climate index, while Friday brings preliminary inflation figures from France. The main event will be Wednesday’s US data releases: core PCE, the second estimate of Q2 GDP, durable goods orders, and personal income and spending.
On Friday, markets will also assess the preliminary annual revision to nonfarm payrolls. Weak US data would increase pressure on the dollar and support EUR/USD, while strong inflation data and other robust readings could help the US currency recover some of its lost ground. The underlying fundamentals for EUR/USD remain moderately positive.
Technical Analysis
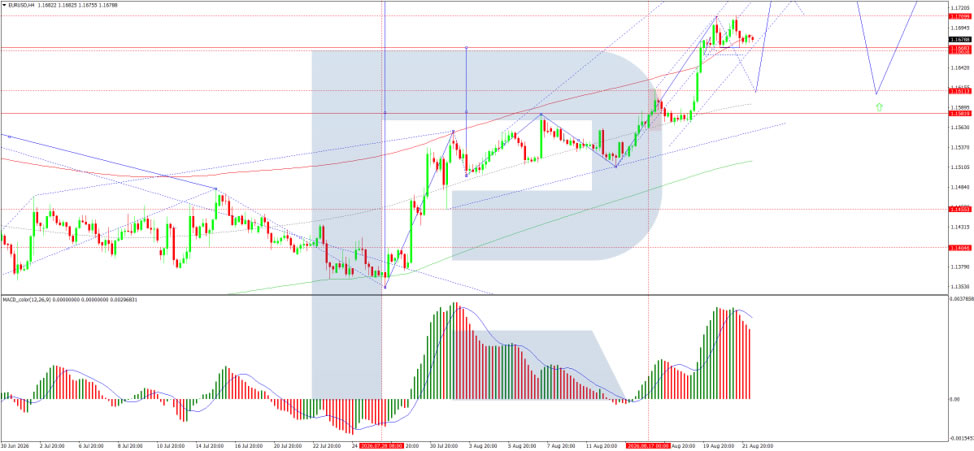
On the H4 chart of EUR/USD, the market continues to trade within a consolidation range around the 1.1668 level, which is nearing completion. An upside breakout would open the way for a corrective move towards 1.1811, followed by a decline to 1.1581. A direct downside breakout would open the way for a move towards 1.1455, with scope for the trend to extend to 1.1400. The MACD indicator supports this scenario, with its signal line above zero but trending downward, reflecting continued bearish momentum.
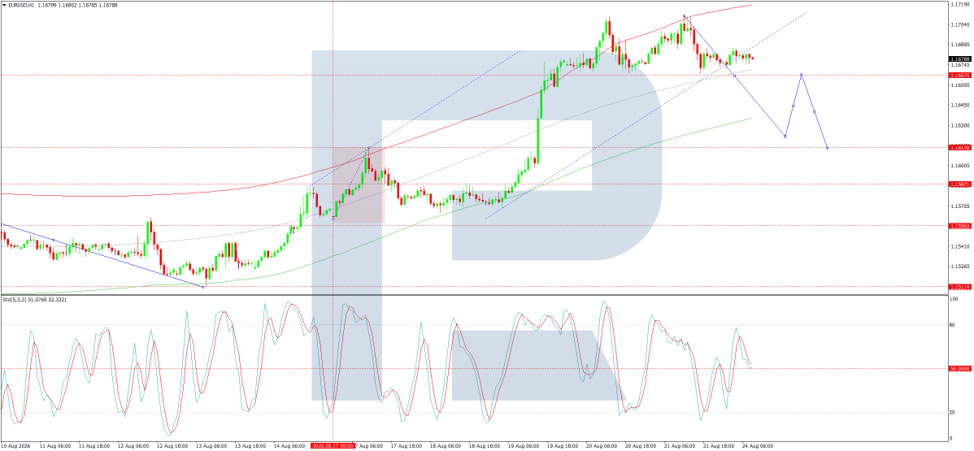
On the H1 chart, the market has moved higher to 1.1710. A consolidation range is currently forming below this level. A move lower towards 1.1622 is expected, with scope for a further decline to 1.1611. The Stochastic oscillator confirms this scenario, with its signal line above 80 and trending downward towards 20, indicating short-term downside pressure.
Conclusion
EUR/USD has climbed to its highest level since May, supported by improving European data and dollar weakness following the US Treasury’s bond buyback announcement. Eurozone business activity, particularly in Germany’s industrial sector, continues to expand, while consumer inflation expectations have moderated slightly, though they remain above the ECB’s target. Markets now face a busy week of economic data, including US PCE, GDP, durable goods orders, and the annual nonfarm payrolls revision, which will provide important signals on the relative strength of the two economies. Technically, an upside breakout could open the way towards 1.1811 before a potential pullback to 1.1581. However, a direct downside breakout would expose 1.1455 and potentially 1.1400. The near-term direction will depend on upcoming data releases and central bank signals.
The Three Ways Fed Chair Warsh Could Move Gold at Jackson Hole — and Why Only One Threatens the...
TL;DR: Gold's Jackson Hole test on Friday isn't really about rate signals — it's about whether Fed Chair Kevin Warsh draws a clear line between monetary policy and Treasury's efforts to influence long-end bond markets, with only one of three likely outcomes genuinely threatening the rally.
Gold’s Jackson Hole Test Is Bigger Than Rates
Gold is heading into Fed Chair Kevin Warsh’s Jackson Hole speech on Friday, Aug. 28, with investors focused on far more than whether he nudges expectations for another rate hike. September tightening odds are already relatively low, leaving limited room for a conventional rates signal alone to redefine the rally. Bigger question is institutional: how firmly Warsh separates monetary policy from Treasury’s increasingly active efforts to influence conditions at long end of bond market.
That matters because Gold’s latest advance looked like a fiscal-credibility trade first and a rate-cycle trade second. Rally accelerated around Treasury’s Aug. 19–20 decision to double minimum long-duration buybacks from $2bn to at least $4bn per operation. But skepticism quickly centered on what buybacks cannot do: they can improve liquidity and redistribute duration pressure, but they do not reduce underlying borrowing requirement or repair fiscal arithmetic. Real yields and Dollar can reinforce that trade, but concern over longer-run fiscal credibility has become an important driver in its own right. A fuller discussion of that mechanism is available in Dollar Index Faces Structural Breakdown Toward 90, EUR/USD Eyes 1.20 Breakout.
Why Warsh Matters More Than September Hike Odds
Jackson Hole therefore becomes a test of how Warsh defines boundary between Fed and Treasury. Greater reliance on short-term bill issuance leaves government interest costs more sensitive to changes in Fed policy. That does not mean fiscal costs will determine Warsh’s reaction function. Rather, it makes his answer more consequential: markets need to know whether Treasury financing pressure is something Fed should explicitly ignore when setting policy, or whether closer Treasury-Fed coordination becomes part of framework.
Warsh’s own history prevents an easy assumption that a Trump-appointed Fed Chair will automatically lean toward accommodation. He has long criticized an oversized Fed balance sheet and large-scale asset purchases, and his recent remarks at ECB’s Sintra forum emphasized price stability and defense of 2% inflation target. That tension is precisely why Friday matters. Warsh could validate concern about fiscal dominance, reject it directly, or leave markets with much the same ambiguity they have today.
Three Ways Friday Could Go
1. Treasury-Fed Accommodation (most bullish for Gold)
Most bullish outcome for Gold would be a speech that leans into Warsh’s “New Treasury-Fed Accord” in a way investors interpret as Fed becoming more sensitive to government financing or bond-market pressures.
That would reinforce concern that line between monetary policy and fiscal financing is becoming less distinct. Gold would not need a dovish rate signal for that interpretation to matter. A perceived willingness by Fed to accommodate fiscal stress would directly strengthen the fiscal-credibility, or “debasement,” thesis behind part of current rally.
2. Monetary Independence and Market Discipline (most bearish for Gold)
Most bearish outcome would be Warsh drawing a clear line in opposite direction. He could reassert his anti-QE instincts, emphasize that Treasury financing considerations should not determine monetary policy, and frame balance-sheet restraint as a way of forcing government debt back onto private markets rather than allowing Fed to absorb fiscal pressure.
Crucially, Warsh would not need to promise a September hike to hurt Gold. A forceful defense of monetary independence could weaken one of rally’s central assumptions: that persistent fiscal pressure will eventually constrain Fed or encourage renewed balance-sheet accommodation.
3. Strategic Ambiguity (the simplest outcome)
Third possibility is also simplest: Warsh discusses Treasury-Fed coordination in broad terms but avoids defining what it means operationally. He could emphasize price stability, institutional cooperation and financial-market functioning without resolving where monetary policy ends and Treasury debt management begins.
That would leave Gold’s underlying thesis largely untouched. Fiscal deficits, rising debt-service costs and Treasury’s maturity-management challenge would still exist after speech. In that sense, ambiguity is not neutral for an established trend: it allows incumbent fiscal-credibility trade to continue without fresh contradiction.
Why Only One Scenario Really Threatens the Thesis
That creates an important asymmetry. Gold does not need Warsh to endorse fiscal-credibility trade for it to survive. Treasury-Fed accommodation would reinforce it, while an ambiguous speech would leave its foundations in place. Only a clear market-discipline message directly challenges expectation that Fed may eventually be drawn into accommodating fiscal pressure.
Even that would not erase broader fiscal problem. A strong independence speech could weaken monetary-accommodation leg of Gold thesis, but it would not reduce deficits, lower debt stock or change Treasury’s financing requirement. That makes a bearish Warsh outcome potentially powerful for price without necessarily destroying longer-term argument.
Short-term price reaction is another matter. Gold is already technically stretched, which means thesis asymmetry and price asymmetry are not the same thing. Even a fundamentally bullish speech could trigger profit-taking if investors use Jackson Hole to lock in gains. Conversely, a bearish interpretation could produce a sharp correction that proves larger than underlying change in fiscal thesis.
ActionForex's Technical View on Gold
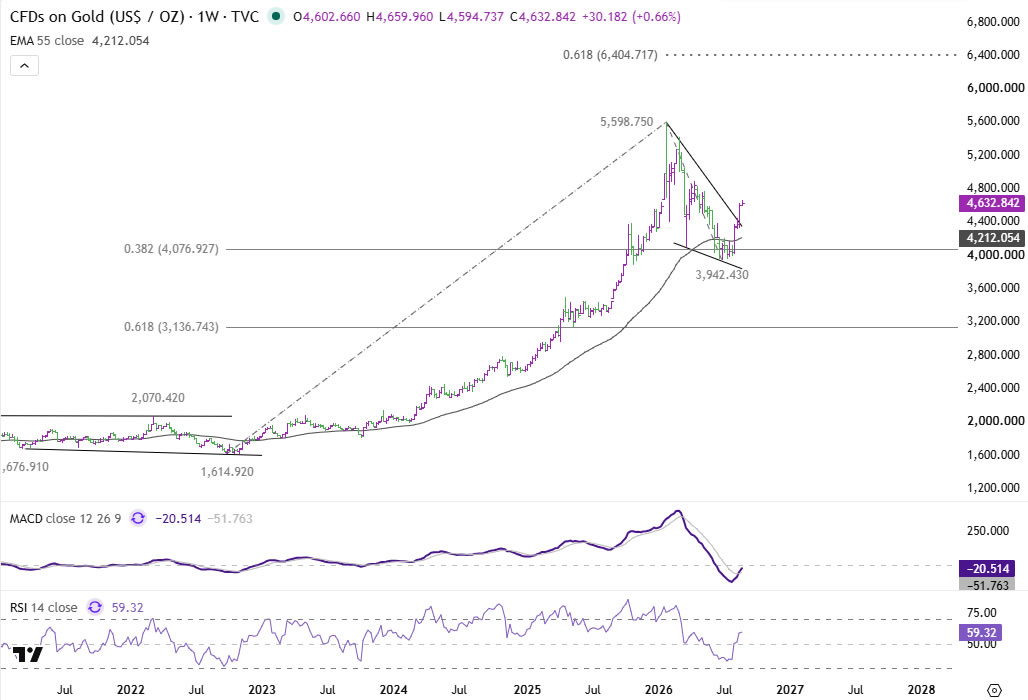
Technical development remains consistent with correction from 5,598.75 having completed at 3,942.43. Further rise is favored, but overbought conditions on daily RSI could cap first attempt through 4,770.73–4,966.14, representing 50% and 61.8% retracements of decline from 5,598.75 to 3,942.43.
Near-term outlook stays bullish while 55-day EMA, now at 4,296.69, holds on any retreat. Firm break of 4,966.14 would strengthen case for retest of 5,598.75 high.
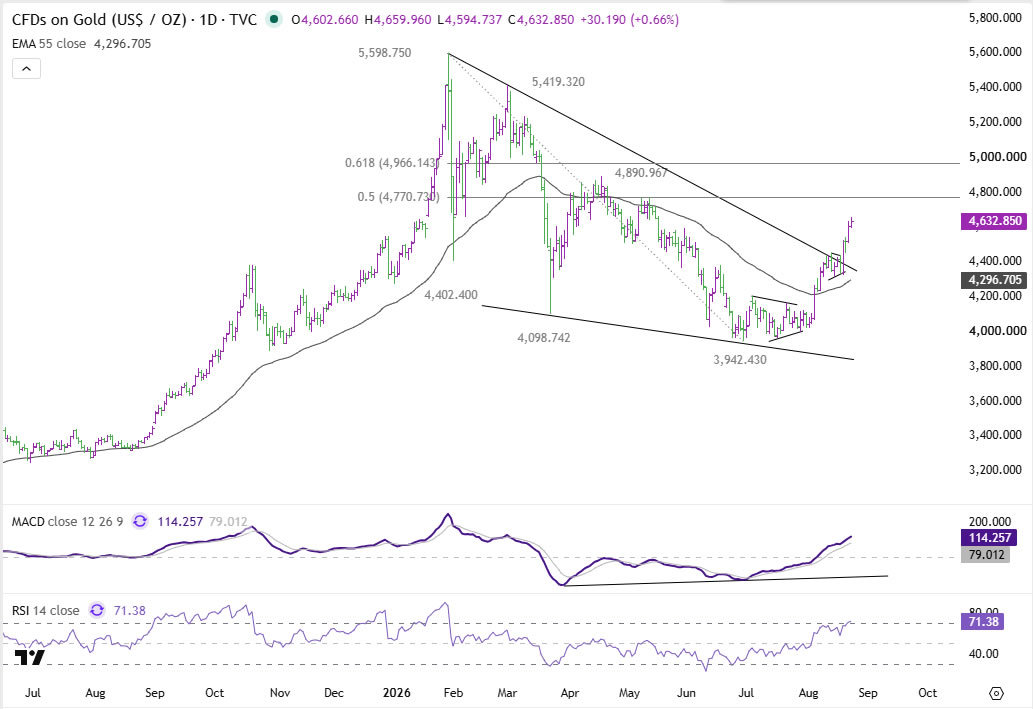
In bigger picture, long-term uptrend also remains intact after Gold defended 4,076.92, the 38.2% retracement of 1,614.92 to 5,598.75, and quickly recovered above 55-week EMA. It is still too early to conclude that long-term uptrend is ready to resume. But if that is eventually confirmed, tentative medium-term objective would be 6,404.71, the 61.8% projection of 1,614.92 to 5,598.75 from 3,942.43.
Friday’s real tell is therefore not simply whether Warsh sounds hawkish or dovish. Gold traders should listen for whether Fed Chair explicitly defends monetary independence from Treasury financing pressures. Two of three broad outcomes leave current fiscal-credibility thesis intact. Only one directly challenges it—and with Gold already overbought, even that distinction may matter more for durability of rally than for size of Friday’s first move.
Key Takeaways
- Gold's rally is a fiscal-credibility trade first and a rate-cycle trade second, meaning September hike odds alone won't determine Friday's reaction.
- Two of three likely Jackson Hole outcomes — accommodation and strategic ambiguity — would leave the fiscal-credibility thesis behind Gold's rally intact.
- Only a forceful defense of monetary independence from Treasury financing pressure would genuinely threaten the rally's foundation, without erasing the underlying fiscal problem.
- Gold is already technically overbought, so even a fundamentally bullish speech could trigger profit-taking regardless of what Warsh actually says.
- Gold faces resistance at 4,770.73-4,966.14; a break would strengthen the case for a retest of the 5,598.75 high, with 6,404.71 as a tentative longer-term objective.
Stock Market: Will Money Flow into EURope?
- The Treasury’s plan to lower bond yields risks triggering a ‘Sell America’ trade.
- European shares are currently underperforming their US counterparts, but the gap is narrowing.
The stock market rose slightly towards the close but ended the week in the red. Positive news from the US economy and expectations surrounding NVIDIA’s corporate results prompted profit-taking on short positions. S&P Global’s Composite Output Index rose to its highest level in more than four years, while Bloomberg analysts raised their forecast for US GDP in the third quarter to 2.5%, giving a boost to the S&P 500.
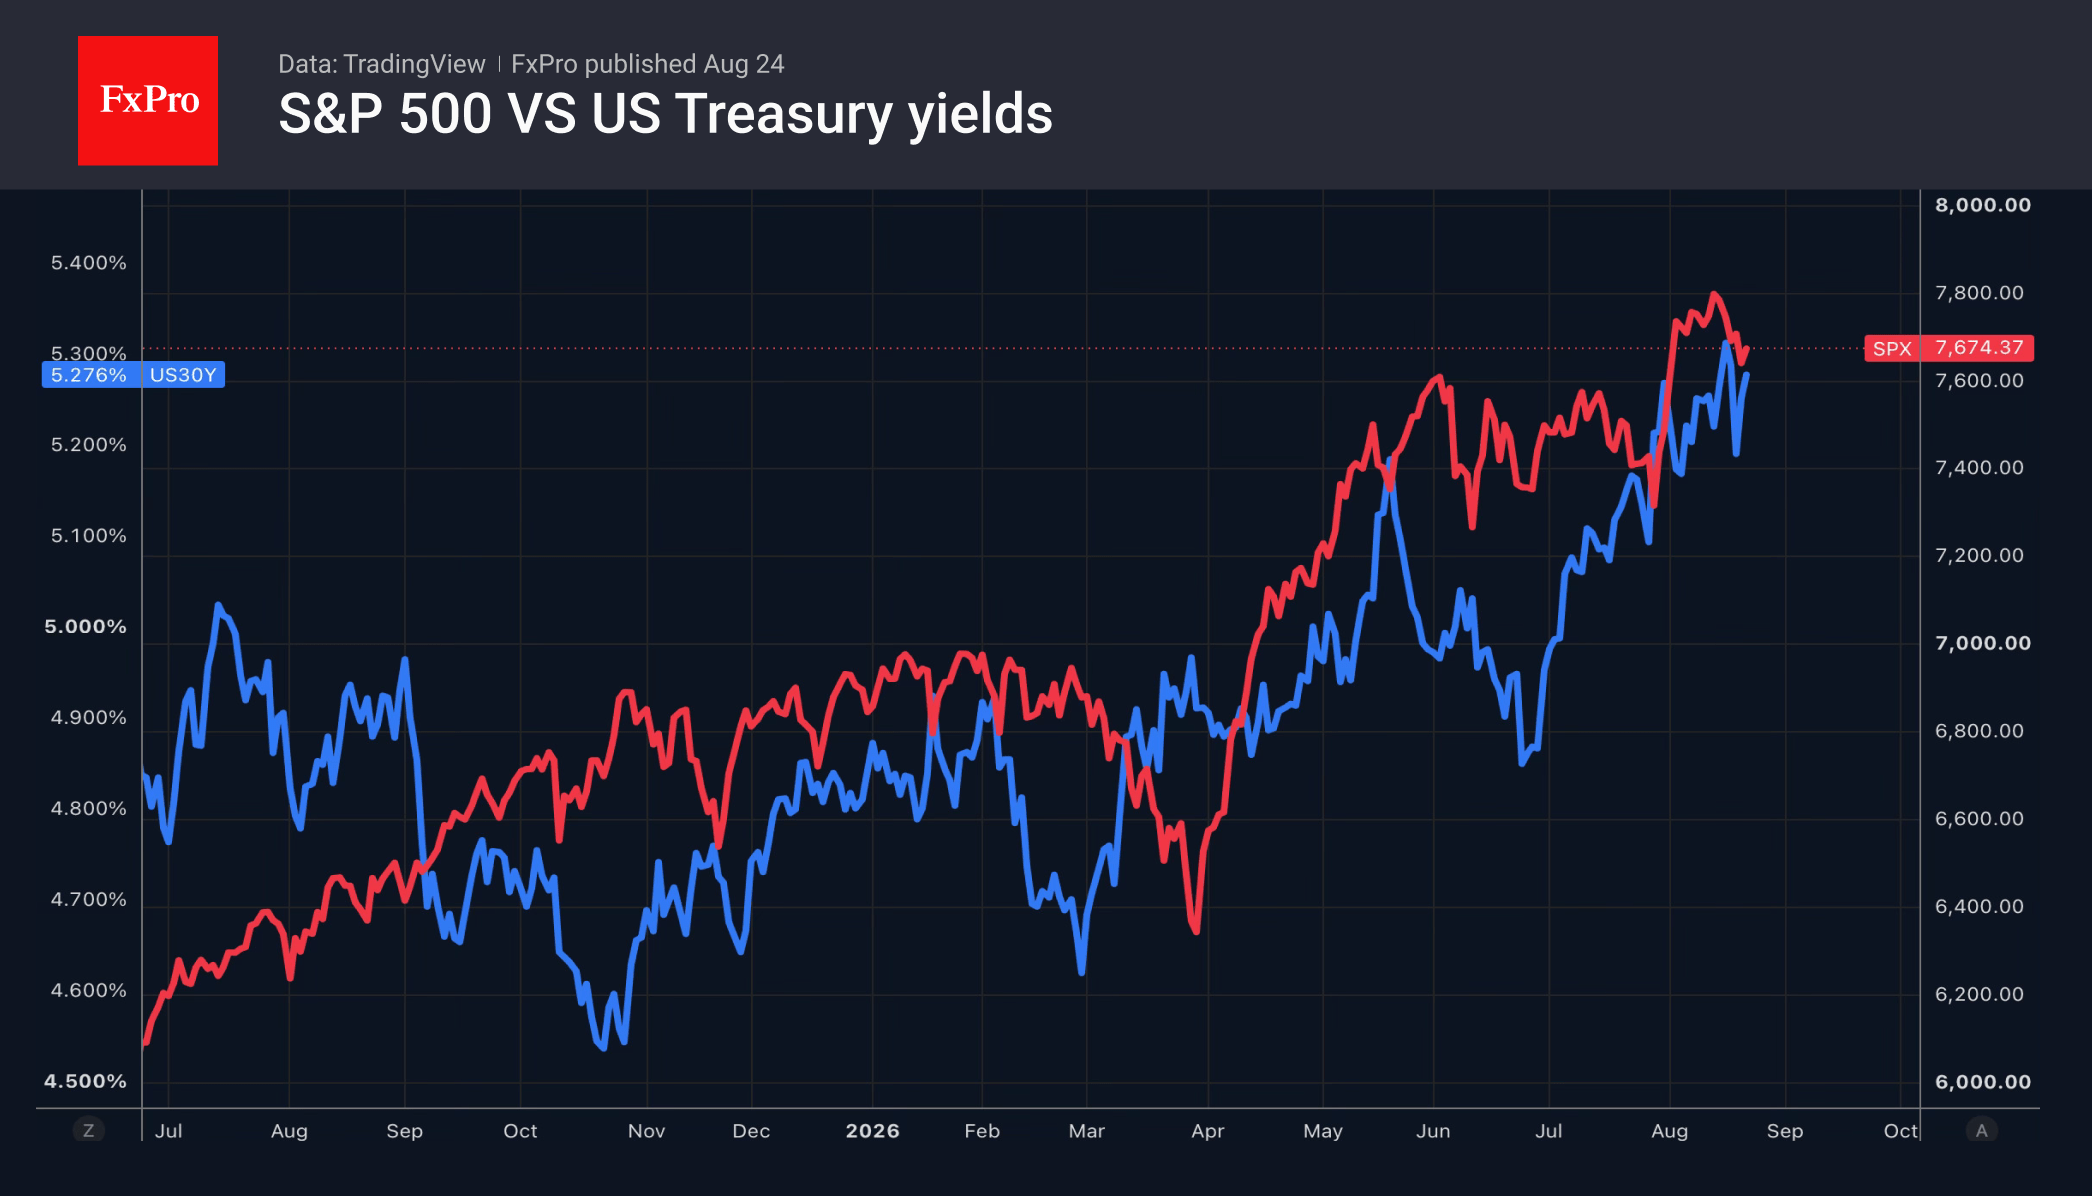
At the same time, concerns about the impact of the Treasury’s scheme to suppress Treasury yields on stock indices have not gone away. Bank of America refers to the Treasury’s plan to rescue the bond market as the ‘Bessent put’, drawing a parallel with the ‘Trump put’, which rescued the stock market. The bank notes that if attempts to rein in borrowing costs fail, hyperscalers will suffer. Their borrowing costs for financing investments in artificial intelligence will rise significantly, negatively impacting their financial results and leading to a fall in share prices.
The entire information technology sector will be affected. According to Goldman Sachs, hedge funds are actively diversifying their portfolios, withdrawing funds and investing them in other S&P 500 issuers.
Investors will be looking for the first signs of trouble in NVIDIA’s second-quarter financial results. The company tops the list of firms raising capital to develop artificial intelligence systems, including projects such as Anthropic and OpenAI. The markets will be closely monitoring trends in chip demand and NVIDIA’s financial plans.
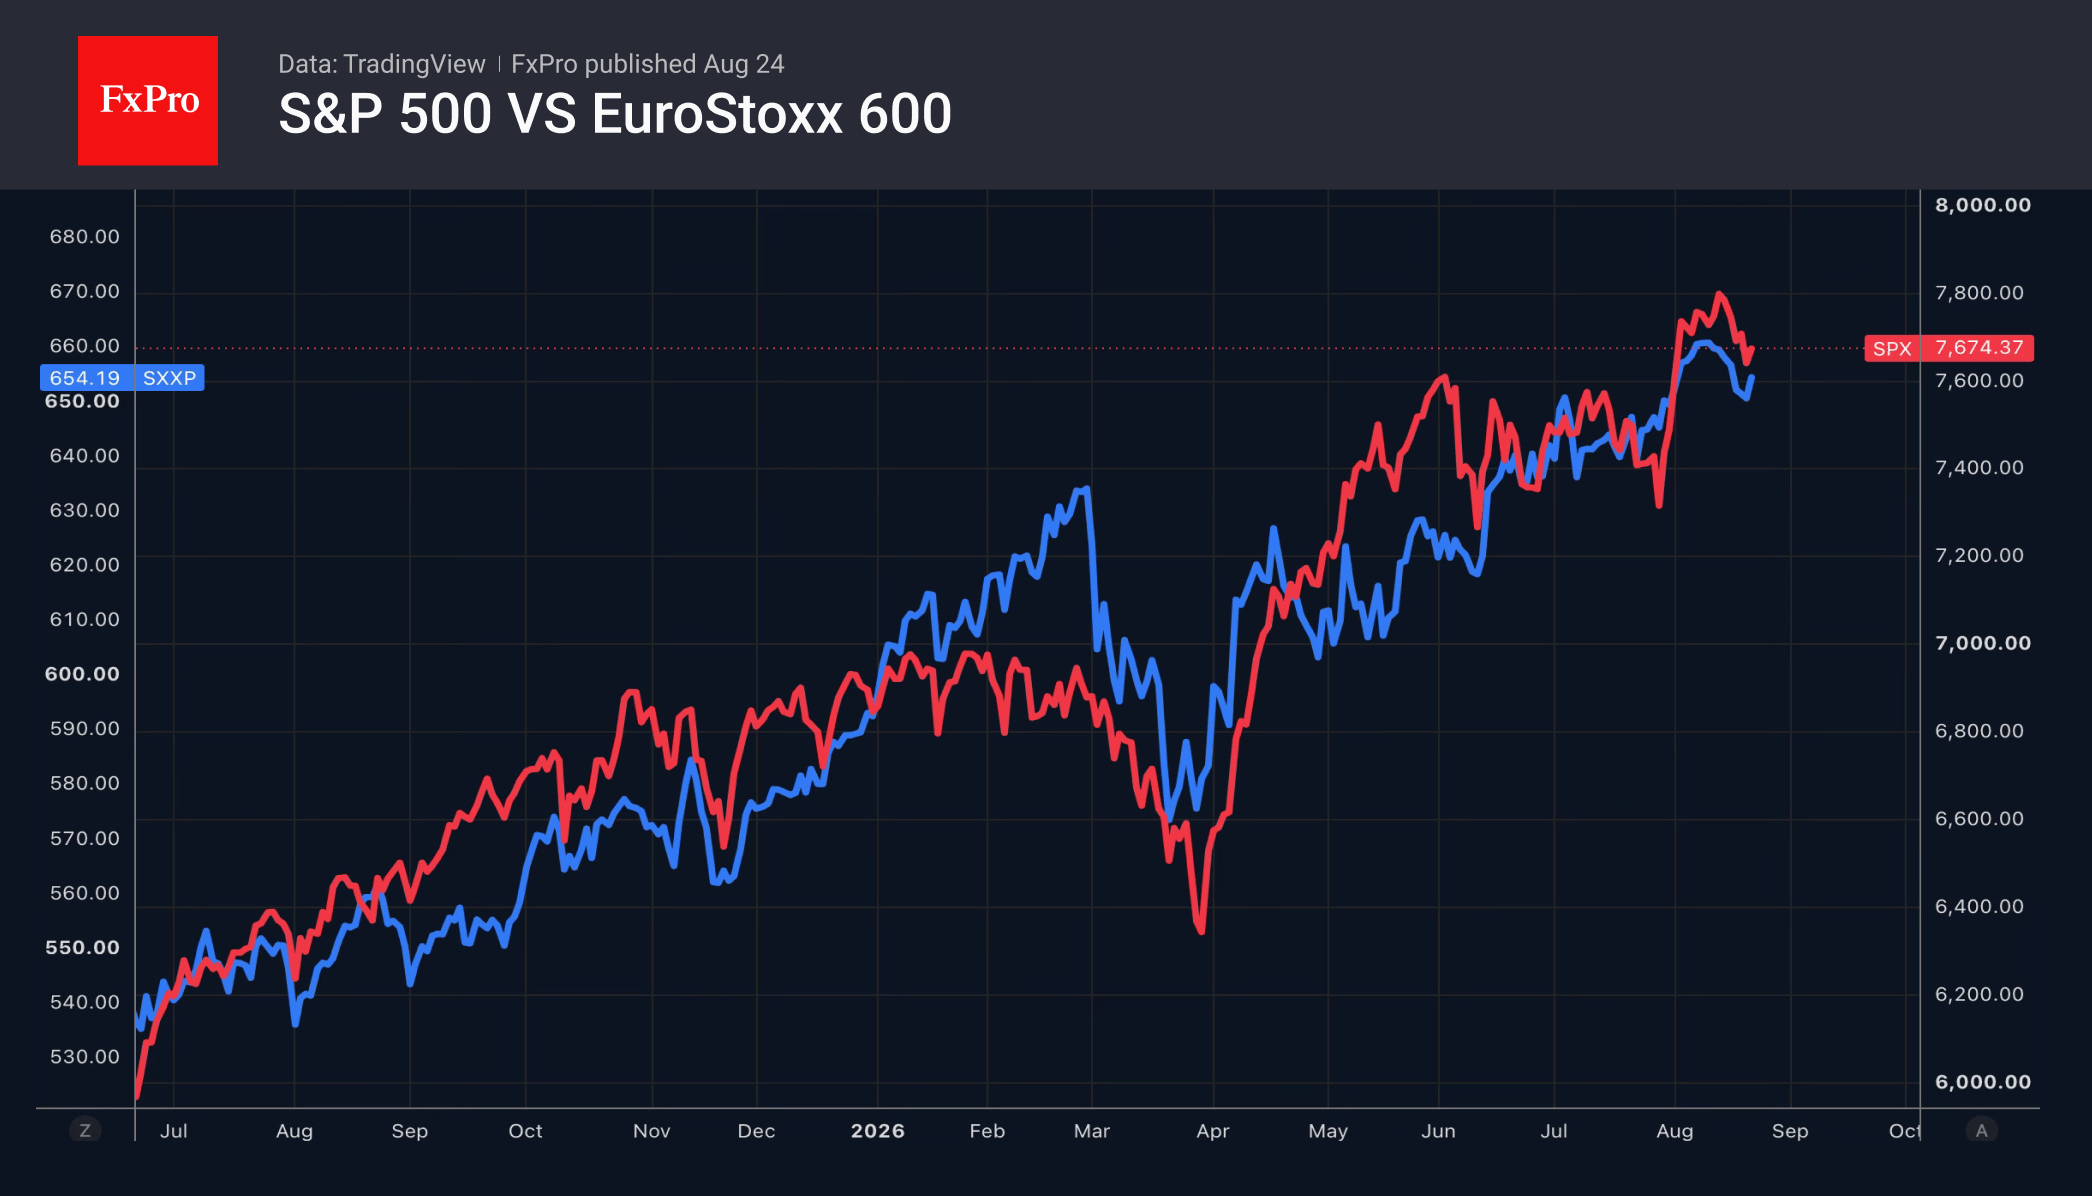
The Treasury’s plan to rein in bond yields risks triggering a ‘sell America’ trend and increasing investor interest in equity markets in other regions. Although the STOXX Europe 600 has gone up 10% so far this year, it lags the S&P 500’s 12% rally. Nevertheless, the gap is narrowing, and European companies posted an 18% rise in earnings per share in the second quarter. This is a very strong result after flat growth in 2024–2025.
Goldman Sachs and JPMorgan are the main bulls on the STOXX Europe 600, expecting the index to rally to 670–680, or about 3% above current levels.
The FxPro Analyst Team
AUD/CAD Analysis: Gap Pushes Price Beyond the Broadening Triangle
On 19 August, Reserve Bank of Australia Deputy Governor Andrew Hauser adopted a more hawkish tone, warning that another rate increase could become necessary if the inflation risks highlighted by the central bank — including the conflict in the Middle East, a surge in demand from the AI sector and weak productivity — begin to materialise.
His comments came one week after the RBA decided on 11 August to leave its policy rate unchanged at 4.35% for a second consecutive meeting.
For the Canadian dollar, oil prices remain a more important driver. Crude has continued to rise this week amid heightened geopolitical tensions and concerns over potential supply disruptions. Higher oil prices can traditionally support the Canadian dollar given the country's significant commodity exports.
Technical Analysis of AUD/CAD
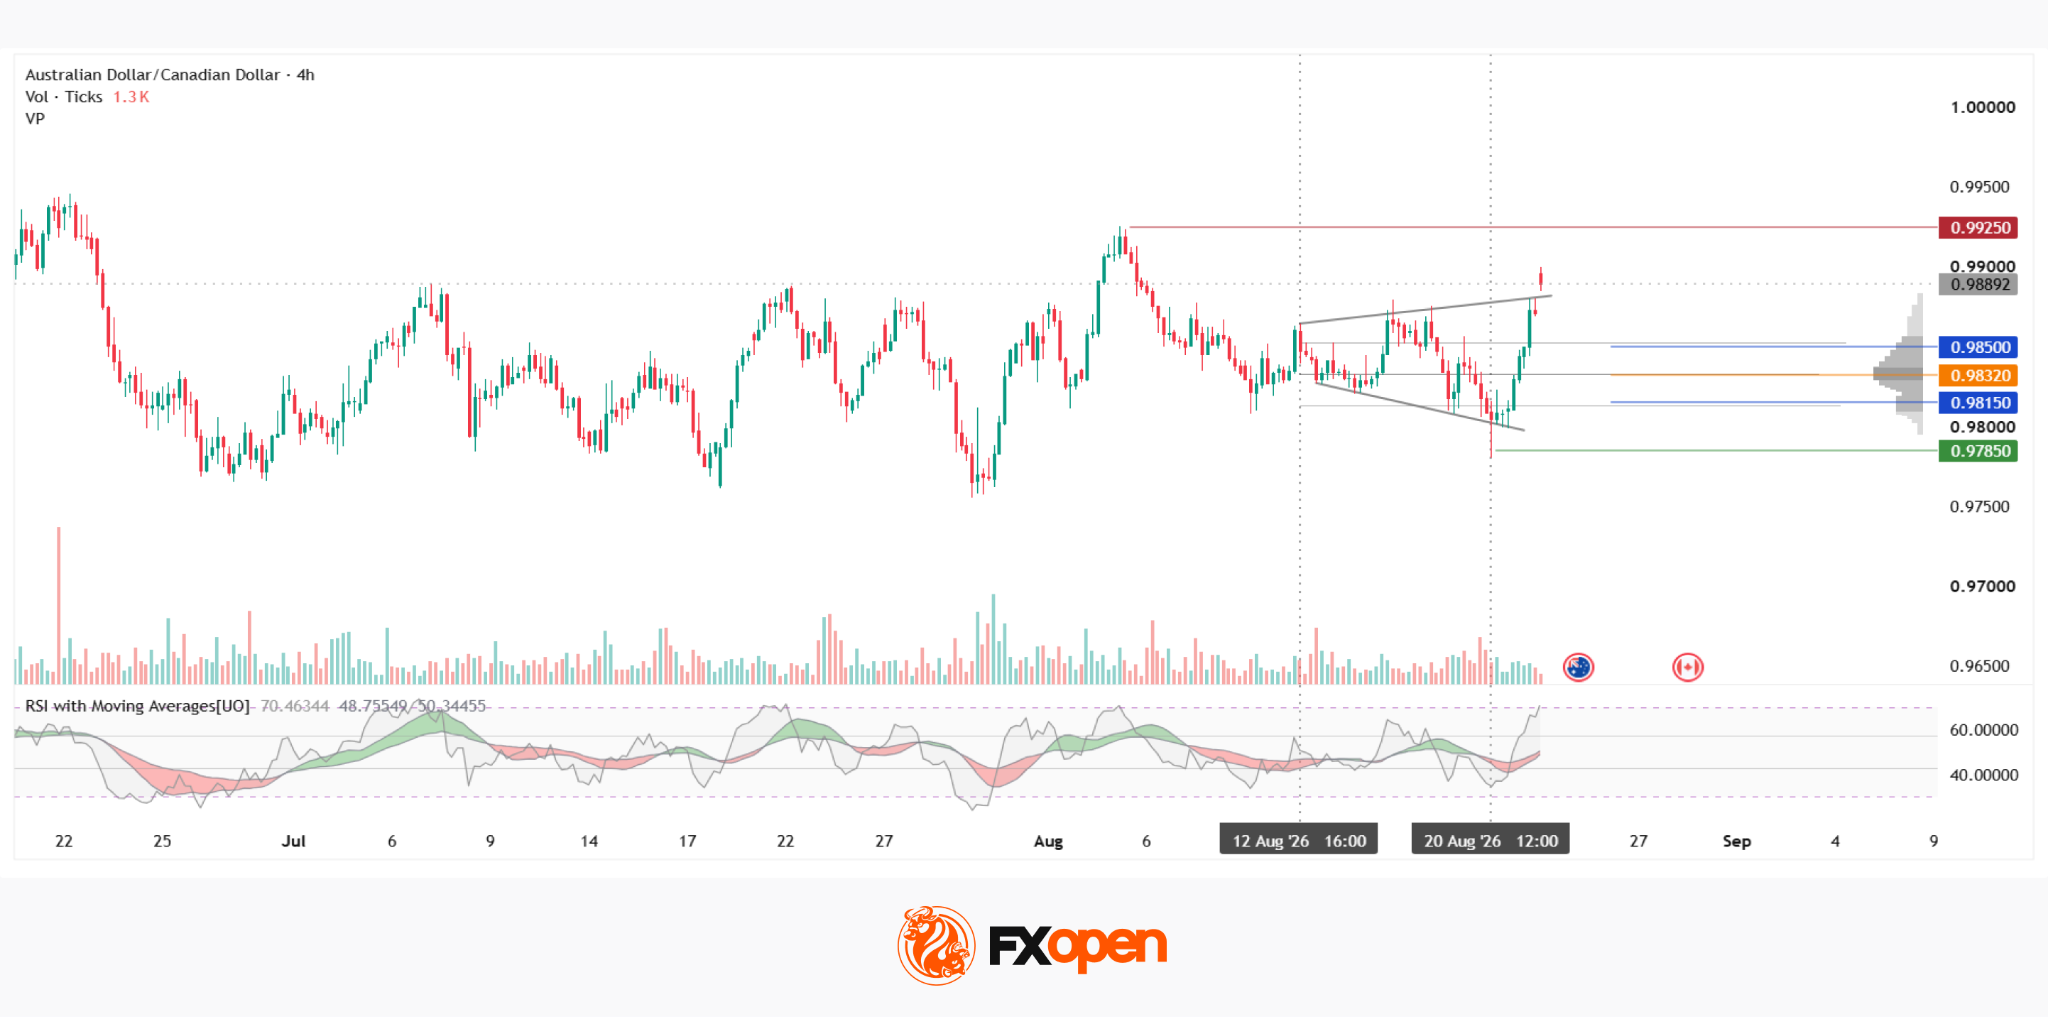
On the four-hour AUD/CAD chart, a medium-term sideways range has been developing since April. Within this range, the price has formed a broadening triangle, characterised by trendlines that diverge rather than converge and reflecting progressively wider price swings.
On Monday, 24 August, trading opened with a gap above the upper boundary of the formation. If the bullish impulse continues to develop, the next significant obstacle could be the red resistance level at 0.9925.
A failed breakout and subsequent reversal lower would bring several key levels within the current market profile into focus. These include the upper profile boundary at 0.9850, the Point of Control (POC) at 0.9832 and the lower profile boundary at 0.9815.
Below the profile's main area of concentration, near the base of the triangle, lies the green support zone around 0.9785.
The RSI + MAs indicator currently shows readings of 71, 48 and 50. The oscillator is approaching overbought territory, while both moving averages remain around the middle of the neutral zone, providing little confirmation of the strength of the current move.
Key Takeaways
The elevated RSI reading and neutral moving averages are yet to produce a coordinated signal, leaving the sustainability of the gap and the attempted breakout uncertain.
The fundamental backdrop is also sending mixed signals. The RBA's increasingly hawkish rhetoric provides support for the Australian dollar, while higher oil prices could strengthen the Canadian dollar. The balance between these two forces may prove decisive for the next move in AUD/CAD.
Trade over 50 forex markets 24 hours a day with FXOpen. Take advantage of low commissions, deep liquidity, and spreads from 0.0 pips (additional fees may apply). Open your FXOpen account now or learn more about trading forex with FXOpen.
This article represents the opinion of the Companies operating under the FXOpen brand only. It is not to be construed as an offer, solicitation, or recommendation with respect to products and services provided by the Companies operating under the FXOpen brand, nor is it to be considered financial advice.
The Forex Market Is Switching to a ‘Debasement Trade’
- A loss of confidence in currencies and bonds is leading to capital outflows
- CHF and JPY benefited as a result of the Treasury’s actions
The US dollar has stabilised near three-month lows thanks to a rapid recovery in Treasury bond yields. Yields on 30-year bonds are returning to the levels seen following the Treasury’s announcement that it was increasing the minimum purchase volume to $4 billion. The greenback got support from falling stock indices, the continued rally in Brent crude, and positive signals from the US economy.
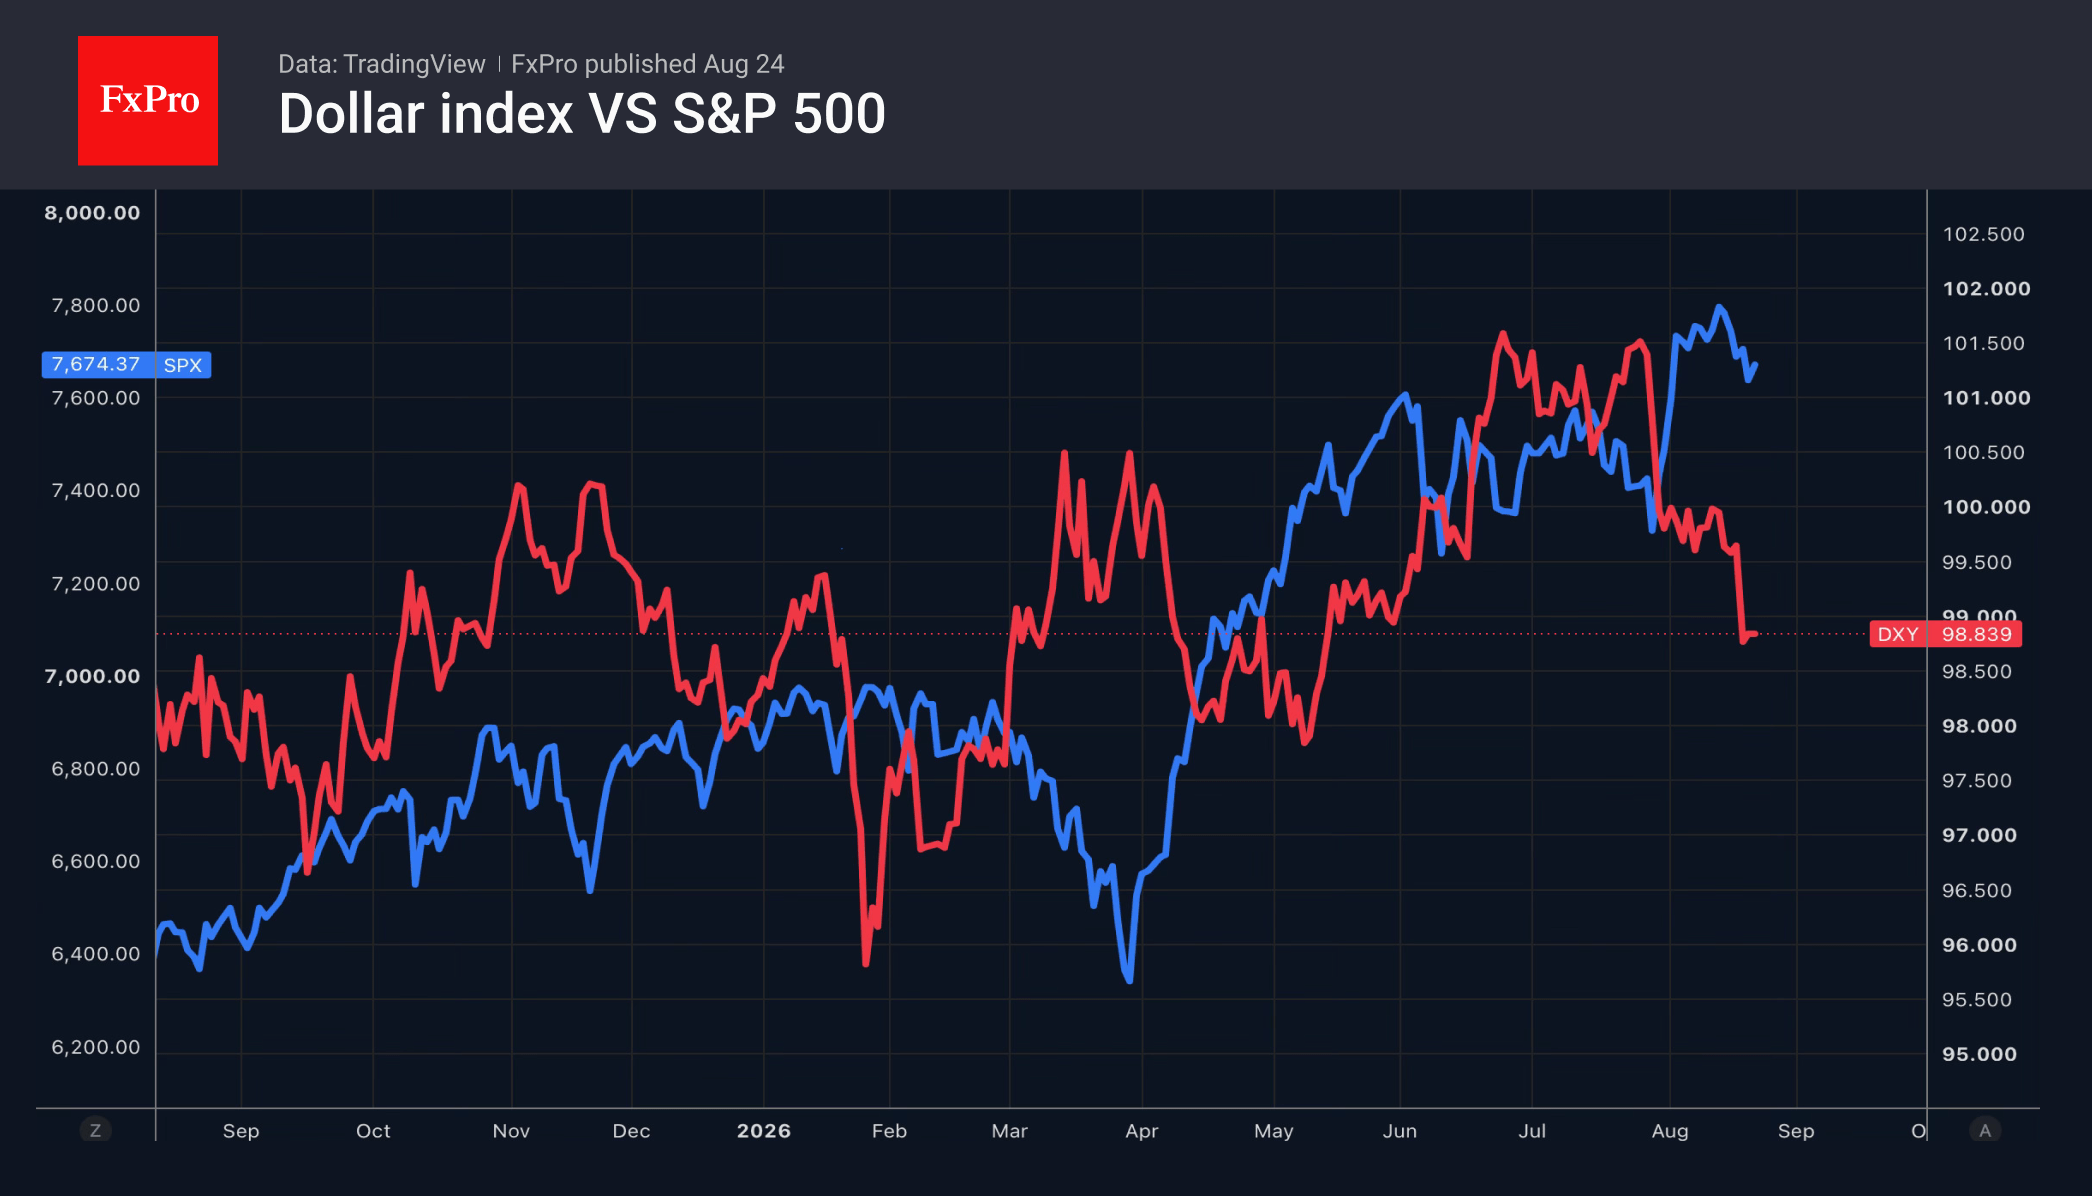
S&P Global’s Purchasing Managers’ Index (PMI) jumped to 56 in August, its highest level since April 2022. Bloomberg analysts have raised their forecast for US GDP in the third quarter from 2% to 2.5%. Yields on Treasury bonds may be rising not only due to geopolitics, the budget deficit, or competition from hyperscalers’ corporate bonds. The strength of the US economy may additionally underpin inflation.
According to Goldman Sachs, the only way to lower yields on US Treasury bonds is to slow down inflation. This will only happen if Kevin Warsh stops relying on the market and begins to tighten monetary policy. And the best way to give such signals is the upcoming Jackson Hole Economic Policy Symposium.
The Treasury’s intention to bring Treasury yields under control has revived the ‘debasement trade’. Eroding confidence in bonds and currencies driven by the policies of their issuing authorities is leading to capital flight from debt and currency markets to other markets. Assets associated with decentralised finance, namely gold and Bitcoin, are proving particularly popular.
As in a typical carry-trade pattern, when the world is worried about the dollar, capital in forex flows to low-yield currencies such as the Swiss franc and the Japanese yen. These are used as funding currencies in carry trade operations, and fears of falling Treasury bond yields have led to the unwinding of these trades.
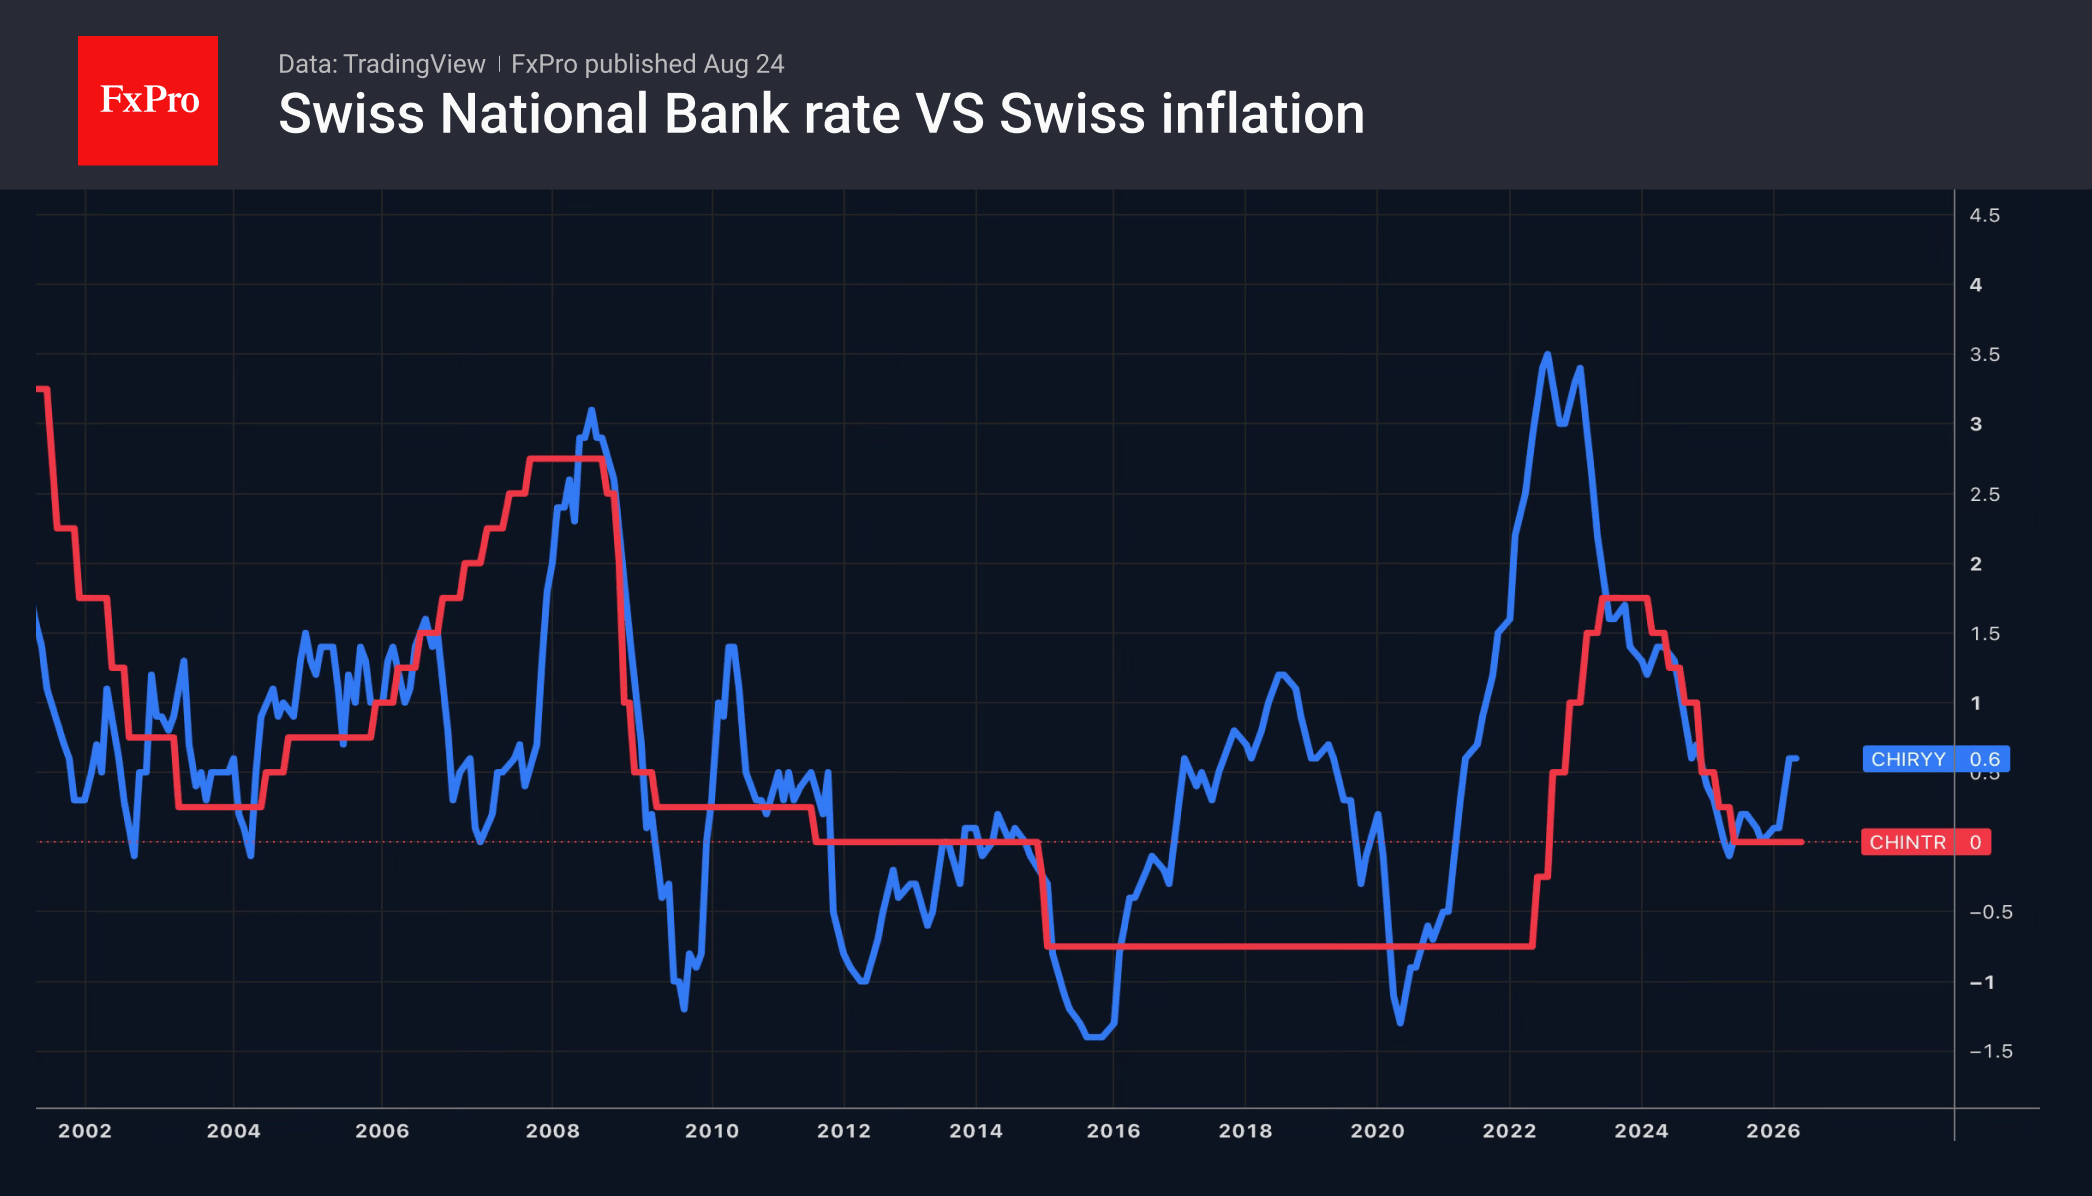
The franc’s appreciation proved so strong that it forced the Swiss National Bank to resort to currency interventions. According to SNB Governing Board member Petra Tschudin, the regulator may introduce negative interest rates to keep inflation within the target range of 0–2%.
The FxPro Analyst Team
The Australian Dollar Rally Shifts Into a Higher Gear
The Australian dollar's steady climb became a sprint late last week, jumping 0.85% on Friday to fresh current leg highs near 0.7180. What had been a measured grind higher accelerated more emphatically, with the Australian dollar moving into the high 0.71s in just a few sessions. Unlike Jan/Feb's rallies, this move is not being driven by a hawkish RBA story or stretched positioning. Instead, support is coming from a weaker USD backdrop, rising gold prices, strength across Asian currencies and Australia's mining dividend season.
Treasury Secretary Scott Bessent's announcement to expand Treasury bond buybacks, combined with escalating sanctions rhetoric towards Iran, reinforced concerns around the long-term outlook for the US dollar and helped propel AUD/USD to fresh cycle highs.
A busy week lies ahead, with Australia's July CPI, RBA August meeting minutes and key GDP partials due, although they are likely to play second fiddle to Fed Chair Warsh's keynote speech at the annual Jackson Hole Symposium.
Markets question the US dollar
US bond yields have climbed sharply since March, with the 30-year bond yield reaching highs not seen since 2007, despite softer payrolls data and moderating inflation, which would normally support lower yields.
US Treasury Secretary Bessent announced plans to double bond buybacks last week. This alleviated the immediate pressure for higher long-dated yields. But it proved to be very short-lived. The intervention raises all sorts of thorny questions around being drawn into an escalation cycle, the sustainability of the efforts and potential success. Of course, many commentators would note that this action and potentially more down the road does not get down to the root cause of what ails long-term US sovereign bonds - large fiscal deficits and still high inflation.
Despite Bessent stating that the Treasury holds an extensive "toolkit" to keep yields contained, investors are clearly demanding a higher risk premium to hold US assets amid ongoing geopolitical tensions, uncertainty around the future direction and independence of the Fed and rising government debt (US public debt reached more than $40 trillion for the first time, increasing by a third in less than five years).
Gold and Bitcoin both rallied as investors sought alternatives to US assets and the USD traded to a multi-month low of 98.55. While off last week's lows, DXY remains under the 99-handle on Monday afternoon.
The Australian dollar starts the week holding onto last Friday's gains, sitting above 0.7160. The AUD-crosses were mixed; AUD/NZD is down -0.36% over the week trading near 1.1990, AUD/JPY was up +0.8% for the week around 113.90 and AUD/EUR remained flat at 0.6130.
US to Announce New Sanctions Against Iran
The US Administration has pivoted to economic sanctions around isolating Iran and forcing concessions. Treasury Secretary Bessent will be announcing the details of the strengthened sanctions regime on Monday and reportedly includes penalties on countries that help Iran evade these sanctions. Oil prices declined earlier today by more than 1%, with investors seemingly taking profits ahead of the announcement.
Australian Labour Market Continues to Cool
Australia's labour market showed further signs of cooling in July. Employment declined, unemployment edged up to 4.5% and hours worked softened, suggesting businesses are reducing hours rather than headcount.
While conditions remain resilient overall, labour supply continues to outpace employment growth, pointing to a gradual increase in spare capacity. Wage growth also remained contained in Q2, with annual growth slowing to 3.2% as private sector wage pressures eased.
China's economy lost momentum in July, with industrial production, retail sales and investment all slowing. Ongoing weakness in the property sector continues to weigh on growth, adding to expectations that policymakers may need to deliver further stimulus in the months ahead.
A Busy Week Ahead for Markets
Fed Chair Warsh will be giving his first speech at the Kansas City Fed's annual Jackson Hole Symposium. This event has a history of being very influential. The topic this year is "Financial Innovation: Implications for Payments and Policy", which obviously doesn't lend itself to monetary policy commentary. We'll see.
Bessent will be unveiling "a new fiscal initiative" this week too, but this likely does little to reassure investors; US deficits are structural and there's no legislative path or will to address this. This could be counterproductive.
Locally, attention will centre on July inflation data. Markets expect annual inflation to continue easing, with lower electricity prices helping offset higher travel and fuel costs. Consensus expects July trimmed mean CPI to print at 3.5% y/y.
Governor Bullock told us at their August press conference that the Board discussed the case for a hike. We will be looking to the RBA minutes for insight on this front.
Q2 GDP building blocks (private CAPEX & construction work done) are due this week and can shift the dial for Q2 GDP (due 2 Sep). After punchy Q1 increases in CAPEX and construction work done (data centre driven), forecasters anticipate more moderate profiles for Q2.
NVIDIA Q2 earnings and a range of central bank speakers also feature this week.
Tuesday
- RBA Aug Policy Meeting Minutes
- RBA Head of Domestic Markets David Jacobs speaks
- US Aug Conf. Board Consumer Confidence
- Fedspeak; Barkin
Wednesday
- Australia Jul CPI, Westpac Leading Index, Q2 Construction Work Done
- US Jul Personal Income/Spending, PCE
- NVIDIA Q2 Earnings
- Fedspeak; Barkin
Thursday
- China Jul Industrial Profits
- Australia Q2 Private CAPEX, Jul Household Spending
- BOJ Deputy Gov. Himino speaks
Friday
- Fed Chair Warsh speaks at Jackson Hole Symposium (27-29th Aug)
- Japan Aug Tokyo CPI
- Canada Jun GDP
- US Benchmark Payrolls Revision (Prelim.)
Sunrise Market Commentary
Markets
- US Treasuries went from bear steepening on Thursday into flattening going into the weekend. Yields added between 2.3 (30-yr) and 4.7 bps (2-yr). The (very) long end of the curve thereby almost fully erased the kneejerk drop following the US Treasury buyback announcement. The limited size (>$4bn per operation) was never going to have a material impact but the fact that markets are completely ignoring the signal (rather than substance) of the move, should worry Treasury. Front-end bonds meanwhile underperformed, pressured by a blow-out August PMI which is indicative of annualized growth approaching 3% in Q3. The composite figure rose to a 52-month high (56), driven by the services sector (56.8). The better-than-expected euro area PMIs barely left a dent. Money markets have fully discounted an ECB September rate hike and it would have required a substantial surprise for market to change any of the short-term views. German bund yields went into the weekend little changed (<1 bp across the curve). In currency markets, EUR/USD copy pasted Thursday's script. Another attempt during European hours to take out the 1.17 failed with the pair eventually ending the week around 1.168. The trade-weighted index inched slightly lower, though off the intraday lows, to close at 98.8. USD/JPY posted similar negligible losses (158.95). A jampacked UK eco calendar, containing a labour market report, inflation numbers, retail sales and PMI business confidence failed to inspire GBP trading. EUR/GBP ended the week around 0.856 compared to 0.854 in last week's opening. Brent crude rose to its highest level since mid-July ($94.4). US Treasury's Bessent said he would unveil the details of a new economic pressuring plan on Iran today, keeping (oil) markets on edge. A press conference is scheduled for tonight. In an op-ed published by the Financial Times yesterday, Bessent is particularly lashing out at Iran's trading partners: "And any nation that serves as a financial artery of a withering regime should expect to share in its isolation. To become a sanctuary for terror is to become, in the eyes of the United States, a global pariah." In the presser, Bessent is also expected to announce some form of fiscal consolidation. While that would address the root cause in (long-term) bond yields, it will have to be credible and sizeable enough to convince the bond vigilantes. Treasuries inch a little higher this morning but we would err to the side of caution. The US dollar begins the new week little changed. Focus after today turns to Wednesday's Nvidia earnings and of course the Jackson Hole Symposium. The apex is chair Warsh's speech on Friday. Is he willing and able to help stem pressure on the bond market by, for example, putting a rate hike more prominently in the market (and suppressing the inflation risk premium in long term bond yields)?
News & Views
- Canada walked away from US trade talks on Friday, allowing Trump's 50% tariff treat (based on a never-before-used provision in the Tariff Act of 1930) on $20bn of Canadian goods to come into effect. A few days ago, a framework deal included a reduction of auto tariffs to 15% and steel/aluminum tariffs to 25% subject to quotas. Canadian PM Carney stuck with his mantra that no deal is better than a bad one and has broad backing amongst Canadian people and politics with his tough stance. He vowed to retaliate with dollar-for-dollar tariffs on US goods, effective from September 8. People close to the matter indicate little chance of new talks between the two nations before US midterm elections. The Canadian dollar is slightly weaker this morning at USD/CAD 1.38, but damage remains small especially taking into account the Summer move from USD/CAD 1.42 to 1.3750 backed by higher energy prices and a weaker overall USD.
- Poland avoided a rating downgrade this weekend after rating agency Fitch decided to keep both its A- rating and its negative outlook in place. The negative outlook reflects the absence of a credible fiscal consolidation plan, domestic political challenges and risks of pre-election fiscal easing, which have reduced Fitch's confidence in the authorities' ability to deliver additional fiscal measures and contain high fiscal deficits. Fitch expects the general government deficit will remain elevated at 6.9% of GDP in 2026 and narrow only marginally to 6.7% of GDP in 2027 (vs 6.2% forecast in February) and 6.1% of GDP in 2028. Persistent primary deficits and borrowing to cover off-budget spending are expected to push the Polish debt ratio from 59.7% of GDP in 2025 to 72.7% in 2028. Real GDP growth is seen slowing from 3.3% this year to 2.9% next year. Private consumption will moderate on slower real wage growth, while completion of projects under the Recovery and Resilience Facility and high defense spending will support investment.