Sample Category Title
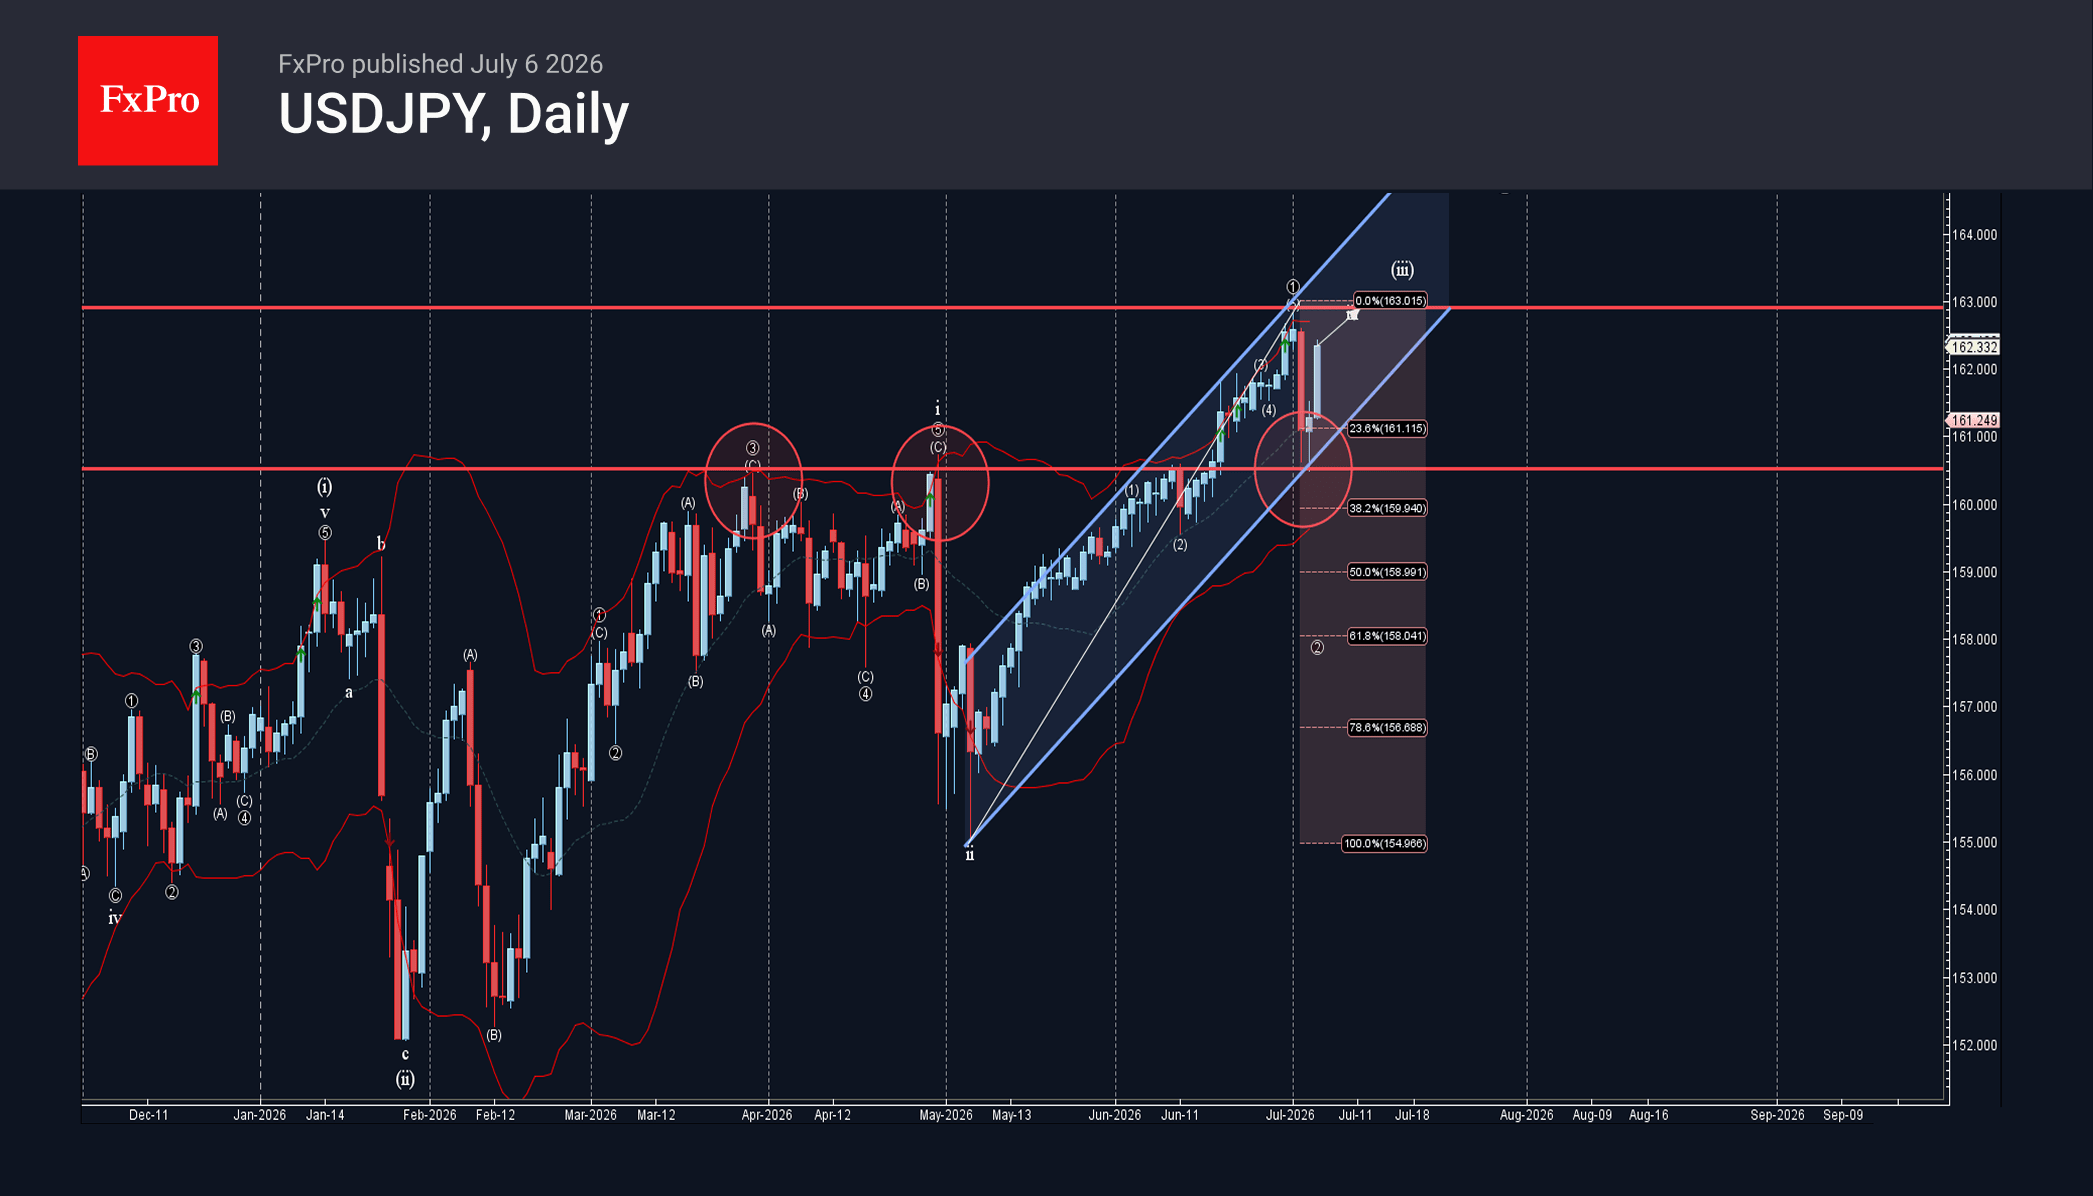
USDJPY Wave Analysis
USDJPY: ⬆️ Buy
– USDJPY reversed from pivotal support level 160.50
– Likely to rise to resistance level 163.00
USDJPY currency pair recently reversed from the support area zone between the pivotal support level 160.50 (former monthly high from March and April), 38.2% Fibonacci correction of the upward impulse from March and the support trendline of the daily up channel from May.
The upward reversal from this support area will most likely form the daily Japanese candlesticks reversal pattern Morning Star.
Given the strong daily uptrend and strong US dollar inflows, USDJPY currency pair can be expected to rise to the next resistance level 163.00.
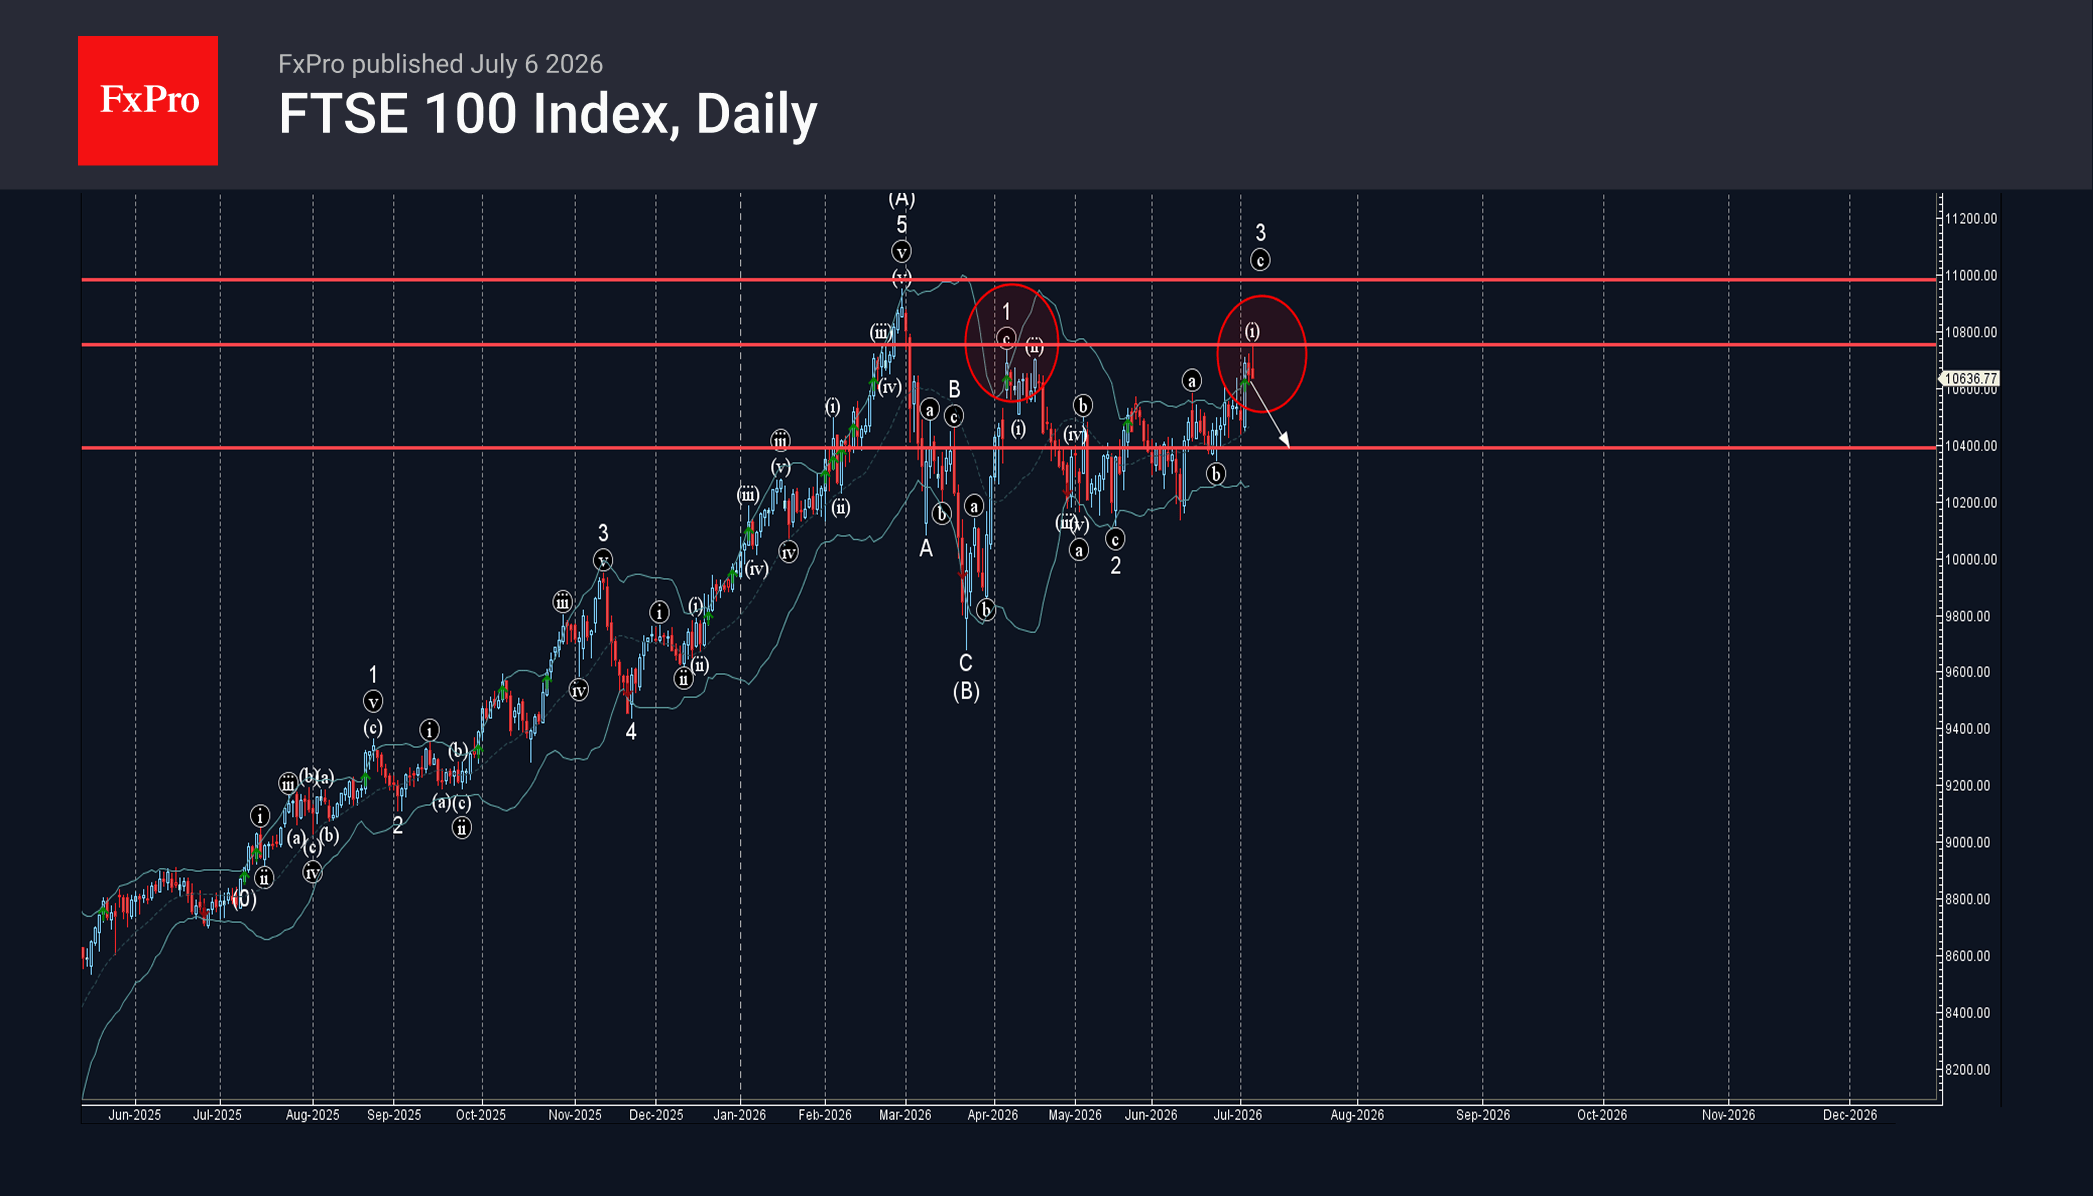
FTSE 100 Index Wave Analysis
FTSE 100: ⬇️ Sell
– FTSE 100 reversed from key resistance level 10750.00
– Likely to fall to support level 10400.00
FTSE 100 recently reversed from the resistance area zone between the key resistance level 10750.00 (which stopped wave 1at the start of April) and the upper daily Bollinger Band.
The downward reversal from this resistance area stopped the previous sharp upward impulse wave 3 from the middle of May.
Given the strength of the resistance level 10750.00, FTSE 100 can be expected to fall to the next support level 10400.00.
Eco Data 7/7/26
| GMT | Ccy | Events | Act | Cons | Prev | Rev |
|---|---|---|---|---|---|---|
| 23:30 | JPY | Labor Cash Earnings Y/Y May | 3.20% | 3.40% | 3.50% | 3.60% |
| 23:30 | JPY | Overall Household Spending Y/Y May | -0.40% | -2.20% | -0.50% | |
| 05:00 | JPY | Leading Economic Index May P | 116.8 | 116.9 | 116.1 | |
| 06:00 | EUR | Germany Industrial Production M/M May | 0.90% | 0.40% | 0.40% | 0.20% |
| 07:00 | CHF | Foreign Currency Reserves (CHF) Jun | 759B | 711B | ||
| 12:30 | CAD | Trade Balance (CAD) May | 4.2B | 2.8B | 2.7B | 3.4B |
| 12:30 | USD | Trade Balance (USD) May | -77.6B | -78.8B | -55.9B | -54.6B |
| 14:00 | CAD | Ivey PMI Jun | 56.2 | 59.1 | 58.2 |
| 23:30 | JPY |
| Labor Cash Earnings Y/Y May | |
| Actual | 3.20% |
| Consensus | 3.40% |
| Previous | 3.50% |
| Revised | 3.60% |
| 23:30 | JPY |
| Overall Household Spending Y/Y May | |
| Actual | -0.40% |
| Consensus | -2.20% |
| Previous | -0.50% |
| 05:00 | JPY |
| Leading Economic Index May P | |
| Actual | 116.8 |
| Consensus | 116.9 |
| Previous | 116.1 |
| 06:00 | EUR |
| Germany Industrial Production M/M May | |
| Actual | 0.90% |
| Consensus | 0.40% |
| Previous | 0.40% |
| Revised | 0.20% |
| 07:00 | CHF |
| Foreign Currency Reserves (CHF) Jun | |
| Actual | 759B |
| Consensus | |
| Previous | 711B |
| 12:30 | CAD |
| Trade Balance (CAD) May | |
| Actual | 4.2B |
| Consensus | 2.8B |
| Previous | 2.7B |
| Revised | 3.4B |
| 12:30 | USD |
| Trade Balance (USD) May | |
| Actual | -77.6B |
| Consensus | -78.8B |
| Previous | -55.9B |
| Revised | -54.6B |
| 14:00 | CAD |
| Ivey PMI Jun | |
| Actual | 56.2 |
| Consensus | 59.1 |
| Previous | 58.2 |
NZD/CHF Analysis: Which Currency Breaks the Consolidation First?
NZD/CHF remains locked in a tight range as traders await the next monetary policy catalyst.
The Reserve Bank of New Zealand heads into Wednesday's meeting on shaky ground. After May's 3-3 split was resolved by a casting vote, the committee still lifted its rate path sharply, eyeing a 3.28% terminal rate by 2029. But the oil slide following the US-Iran truce has cut hike odds from over 80% to around 66-70%, splitting major banks between a hold and a further move.
Meanwhile, the Swiss National Bank holds firm at 0% for a fourth straight meeting. Switzerland's challenge mirrors New Zealand's in reverse: subdued inflation rather than overheating, leaving little room—or need—for tightening. The franc's strength stems more from so-called safe-haven flows than rate differentials.
The result: NZDCHF caught between short-term RBNZ uncertainty and near-static Swiss policy, with direction hinging on Wednesday's decision.
Technical Analysis of NZD/CHF
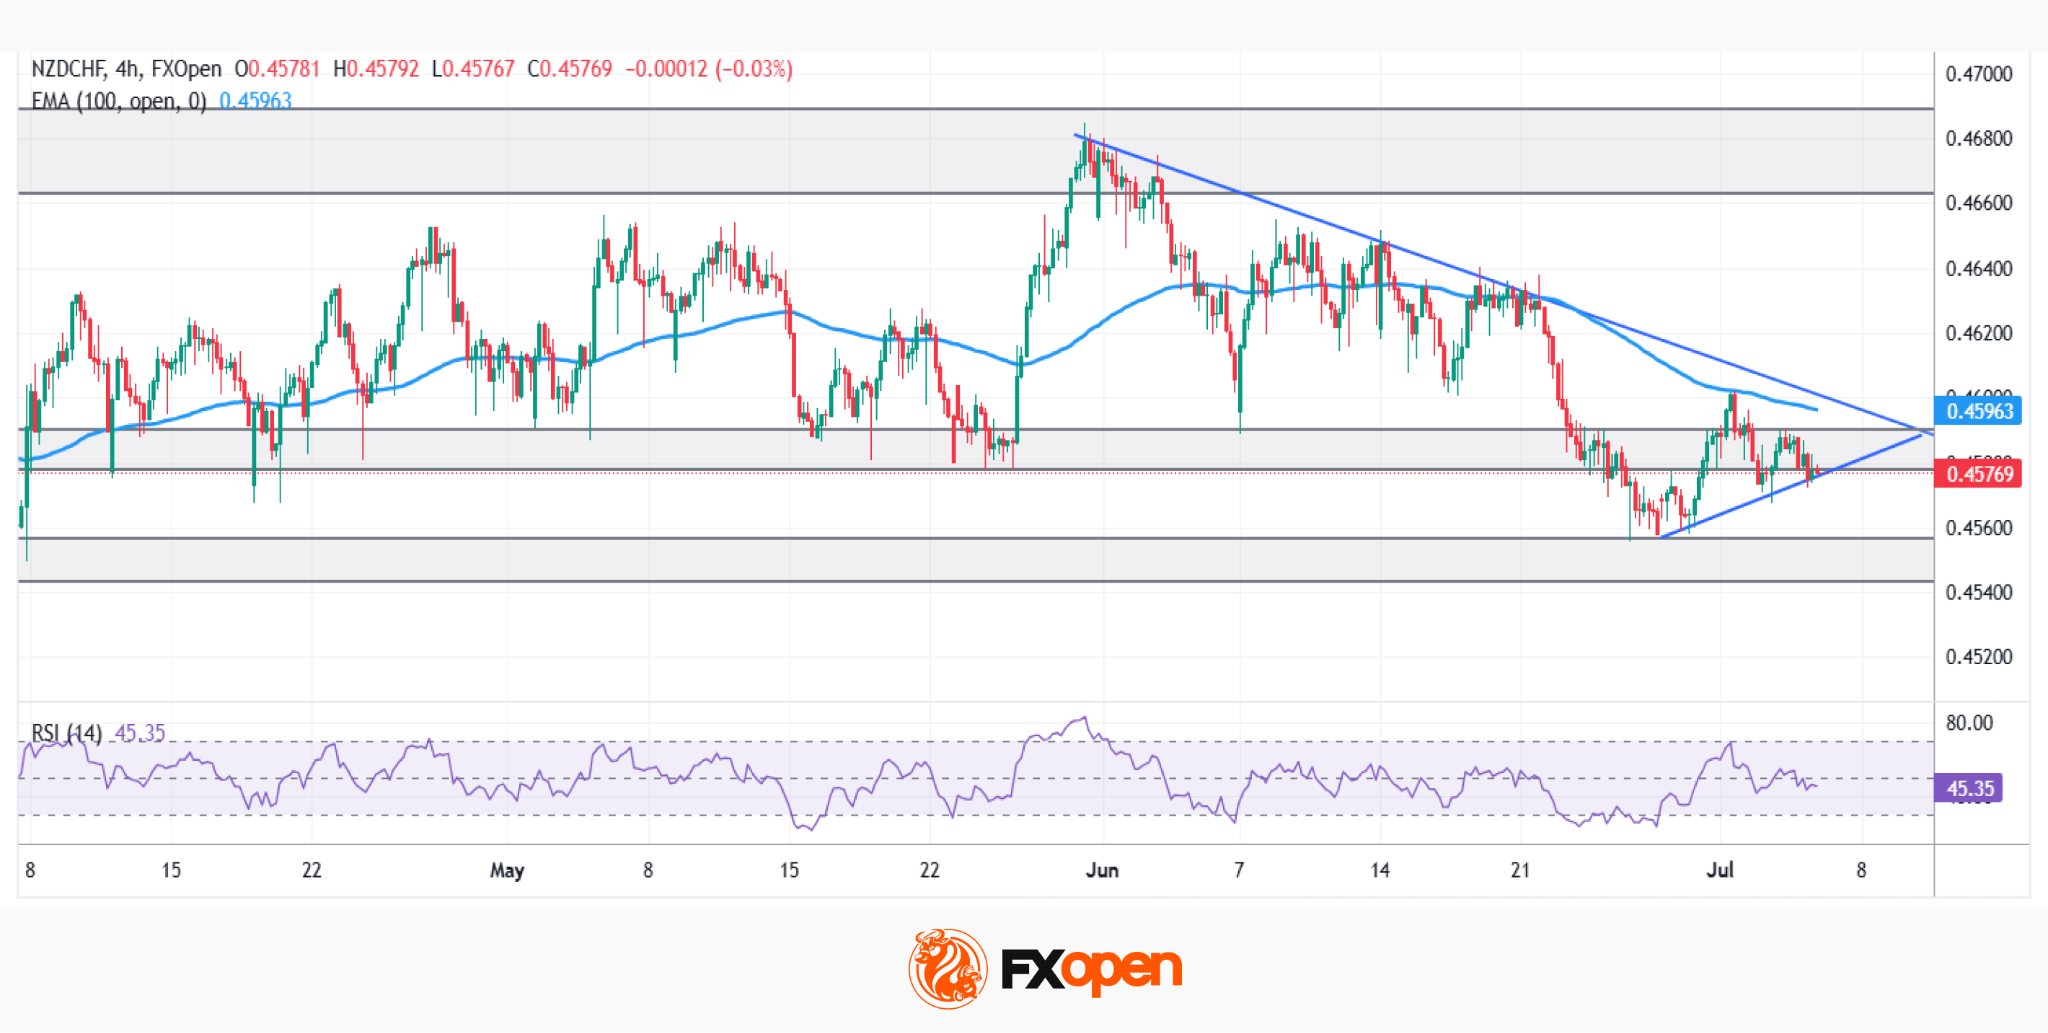
NZD/CHF remains locked in a broader consolidation on higher timeframes, trapped between resistance at 0.4660-0.4690 and support at 0.4540-0.4560. Price is now compressing into a tighter triangle just below the 100-period EMA, which continues to cap upside as dynamic resistance.
Bullish Scenario
Fundamentally, a hawkish RBNZ surprise on Wednesday—hiking despite the oil-driven pullback in tightening expectations—would give the kiwi a strong tailwind. Technically, buyers first need to break the descending trendline capping price since late May, already rejected on several attempts. Once cleared, the decisive test becomes the 0.4660-0.4690 resistance zone. A genuine breakout would likely require both a strong NZD fundamental catalyst and confirming technical momentum.
Bearish Scenario
Conversely, a dovish hold—as several major banks now expect—could reignite downside pressure. Technically, sellers first need to break the ascending trendline price has leaned on in recent sessions, then push through the more significant 0.4540-0.4560 support. Notably, the 100-period EMA continues to act as reliable dynamic resistance, keeping price capped beneath it and reinforcing the bearish structure until proven otherwise.
Two central banks, two opposite stories: RBNZ still weighing when to tighten, SNB content to sit still. Wednesday's decision could finally break this narrowing range — will the kiwi's rate case win out, or does the franc's quiet resilience hold firm?
Trade over 50 forex markets 24 hours a day with FXOpen. Take advantage of low commissions, deep liquidity, and spreads from 0.0 pips (additional fees may apply). Open your FXOpen account now or learn more about trading forex with FXOpen.
This article represents the opinion of the Companies operating under the FXOpen brand only. It is not to be construed as an offer, solicitation, or recommendation with respect to products and services provided by the Companies operating under the FXOpen brand, nor is it to be considered financial advice.
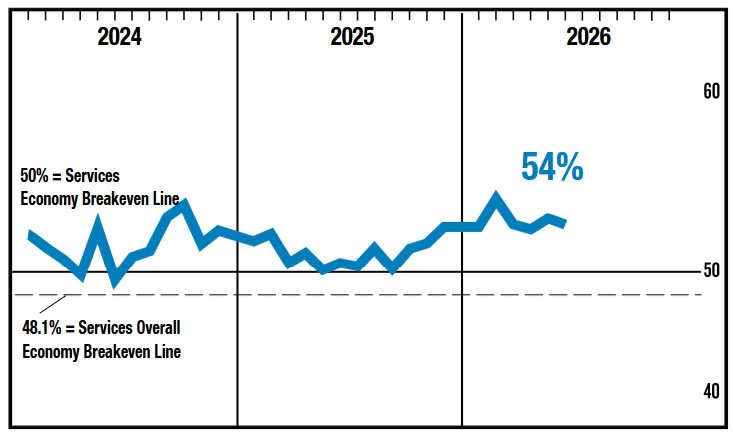
ISM Services in June Shows Softer Demand, but Improved Hiring and Still-Elevated Price Pressures
- The ISM Services index slipped 0.5 points from 54.5 in May to 54.0 in June, remaining in expansionary territory for a 24th consecutive month.
- Demand moderated but stayed healthy, with the new orders index falling 2.2 points to 55.1 after May’s sharp rebound.
- Current output cooled from a firm pace, as business activity declined 2.3 points to 55.4 while remaining solidly above the 50 threshold.
- Labor market conditions improved, with employment rising 3.3 points to 51.2 and returning to expansion for the first time in four months.
- Price pressures eased but remained elevated, with the prices paid index falling 3.6 points to 67.7—its first reading below 70 since February, but still above 60 for a 19th straight month.
- The largest move came from inventories, which fell 11.3 points to 51.2 after May’s record-high reading, while supplier deliveries eased slightly to 54.4 and backlogs rose 3.6 points to 54.9.
Key Implications
- The June report points to a modest cooling in services momentum. The headline index, business activity and new orders all eased from May’s stronger readings but remained comfortably in expansionary territory. The sharp pullback in inventories was the standout move, suggesting May’s stock building surge was not sustained, but the rise in backlogs indicates that demand is still firm enough to keep pressure on capacity. Importantly, employment moved back into expansion, reducing some of the prior concern that firms were relying on productivity gains rather than hiring to meet demand.
- Price conditions improved at the margin but remain a key concern. The prices index fell below 70 for the first time since February, helped by mixed reports on fuel-related costs, but it remains well above the 50 threshold and has been above 60 for 19 consecutive months. Taken together, the report shows services demand still expanding, hiring improving and cost pressures easing gradually - a mix the Fed is likely to view as consistent with patience rather than a clear green light to move.
US ISM Services Slips in June as Price Pressures Ease and Employment Rebounds
US ISM Services PMI edged down from 54.5 to 54.0 in June, missing expectations of 54.2 but remaining comfortably above the 50 threshold that separates expansion from contraction. The report pointed to continued growth in the services sector, although activity and demand moderated slightly from the previous month.
Business Activity/Production eased from 57.7 to 55.4, while New Orders slipped from 57.3 to 55.1, suggesting growth remained solid but lost some momentum. A notable bright spot came from the labor market, with the Employment Index rising sharply from 47.9 to 51.2, returning to expansion for the first time in four months. ISM noted that a Services PMI reading of 54.0 is historically consistent with annualized real GDP growth of about 1.9%.
Inflation pressures also showed signs of easing. The Prices Index fell from 71.3 to 67.7, dropping below 70 for the first time since February, although it has remained above 60 for 19 consecutive months. ISM said some respondents reported lower gasoline and diesel costs, but petroleum-related products continued to face price increases as earlier oil shocks worked through supply chains. Those pressures are expected to ease later this year if recent progress in restoring oil flows through the Strait of Hormuz continues.
| Indicator | Previous | Latest | Expectation |
|---|---|---|---|
| ISM Services PMI | 54.5 | 54.0 | 54.2 |
Key Components
| Component | Previous | Latest | Comments |
|---|---|---|---|
| Business Activity / Production | 57.7 | 55.4 | Growth moderated but remained above its 12-month average of 55.1 |
| New Orders | 57.3 | 55.1 | Demand eased but continued to expand |
| Employment | 47.9 | 51.2 | Returned to expansion for the first time in four months |
| Prices | 71.3 | 67.7 | Lowest since February; still above 60 for the 19th consecutive month |
Sunset Market Commentary
Markets
US investors returned after enjoying a long weekend in observance of Independence Day. However, it hardly brought new impetus to the trading dynamics. With very little in the way of important EMU data, EU (and UK) yields held very tight ranges, changing less than 1.5 bp across the curve. US bonds still see minor follow-through gains after Thursday's softer than expected US payrolls. With Brent oil currently holding in the $71–72 p/b area, quite some inflation improvement may be discounted. The theme of fiscal sustainability continues to linger. Long-term Japanese government bond yields again touched multi-year peak levels for the 10-y and 20-y (4.1 bps and 3.8 bps respectively). After an unconvincing 10-y auction last week, a next reality check comes as soon as tomorrow, with a 30-y JGB auction. Moves in intra-EMU government bond spreads (vs swap) still develop orderly. Still, spreads vs swaps (10-y) of the likes of Italy (72 bps), France (73 bps), Belgium (51 bps) or Spain (43 bps) are off the levels before the start of the conflict between the US and Iran. On other markets, several tech/AI-related indices again traded volatile this morning (Kospi, e.g.), but some calm returned. The EuroStoxx 50 touched an all-time record, but currently cedes 0.4%. US equities also again try to overcome doubts on tech/AI. The Nasdaq gains 0.85% at the open, but price action last week shows that intraday trends can change quickly.
On FX markets, the dollar gains modestly despite a limited loss in interest rate support. DXY regains the 101 mark. EUR/USD eases from 1.144 to 1.142. For now it's not clear yet whether (and to what extent) sustainability of public finances might affect the likes of the euro, the dollar and/or sterling. Fiscal intentions of the Burnham government still have to be concretized, but sterling continues to perform quite well. After last week's break below EUR/GBP 0.86, sterling today again gains a few ticks against the euro, nearing the 0.855 area. Japanese authorities didn't use Friday's 'USD correction' post-payrolls or lower market liquidity to force out some JPY shorts. Today at least it looks that this window of opportunity is closing with USD/JPY rebounding near 162.3 compared to a 160.49 low on Friday and a multi-year top of 162.84 earlier last week. The combination of a 30-y auction, the yen testing multi-year lows and Japanese authorities playing some kind of poker with markets on the intervention strategy, might cause quite a hefty mix tomorrow morning. After finishing this report, the US services ISM still will be released, but probably a big surprise is needed to trigger a sustained market reaction.
News & Views
The European Stability Mechanism, lender of last resort for euro area countries, released its inaugural annual Euro Area Stability Watch report today. It warns the bloc won't be immune to the shocks that lie ahead. The ESM sees three important pockets of vulnerability. The first one is eroding fiscal space, in part driven by increased defence spending needs. The second is a structural exposure to energy supply disruptions stemming from geopolitical tensions. Lastly, the ESM says European investors are exposed to a potential repricing of US Treasuries and equities. It added that EA sovereign markets meanwhile are becoming increasingly reliant on price-sensitive investors (e.g. hedge funds). The ESM came up with an adverse scenario (relative to the European Commission's baseline), defined as two shocks materializing simultaneously: prolonged geopolitical tensions which raise energy prices and keep uncertainty high, and a sharp repricing of US assets. That would push the euro area economy into a recession with negative y/y growth through 2027 Q4, raise inflation to almost 5% by end 2026 and put public debt on a further upward path. The ESM urges countries to quickly rebuild fiscal buffers, spend efficiently and advance structural reforms so they come prepared when the next shock hits.
Belgium's budget monitoring committee in a preliminary estimate offered to the government said an additional €7.9bn fiscal effort is needed by end-2029 to be compliant with the European deficit rules (expenditure-based), several Belgian news outlets reported. The Middle East conflict, which resulted in higher inflation and lower economic growth, and a higher interest rate burden has thrown government finances further off track. The €7.9bn is significantly more than the €4.9bn the committee expected in its March report and topped the approximately €7bn the government had been bracing for internally. An unchanged policy would lift the budget deficit by the end of De Wever I in 2029 to 5.8% and further to 6.3% in a five-year horizon. The debt ratio would climb from 108% this year to 117% in 2029 and 122.8% in 2031.
S&P 500: Rotation Has Put the Brakes on the Market
- A rotation is taking place in the US stocks.
- Seasonal factors and impressive earnings are supporting the S&P 500.
With geopolitical concerns receding and the likelihood of a Fed rate rise diminishing, the US equity market has returned to a familiar theme: rotation. Interest in artificial intelligence has not waned, but technology shares appear overbought. Furthermore, there are concerns about their ability to generate high returns commensurate with the capital invested. As a result, capital is being reallocated across sectors, leading to consolidation in the S&P 500.
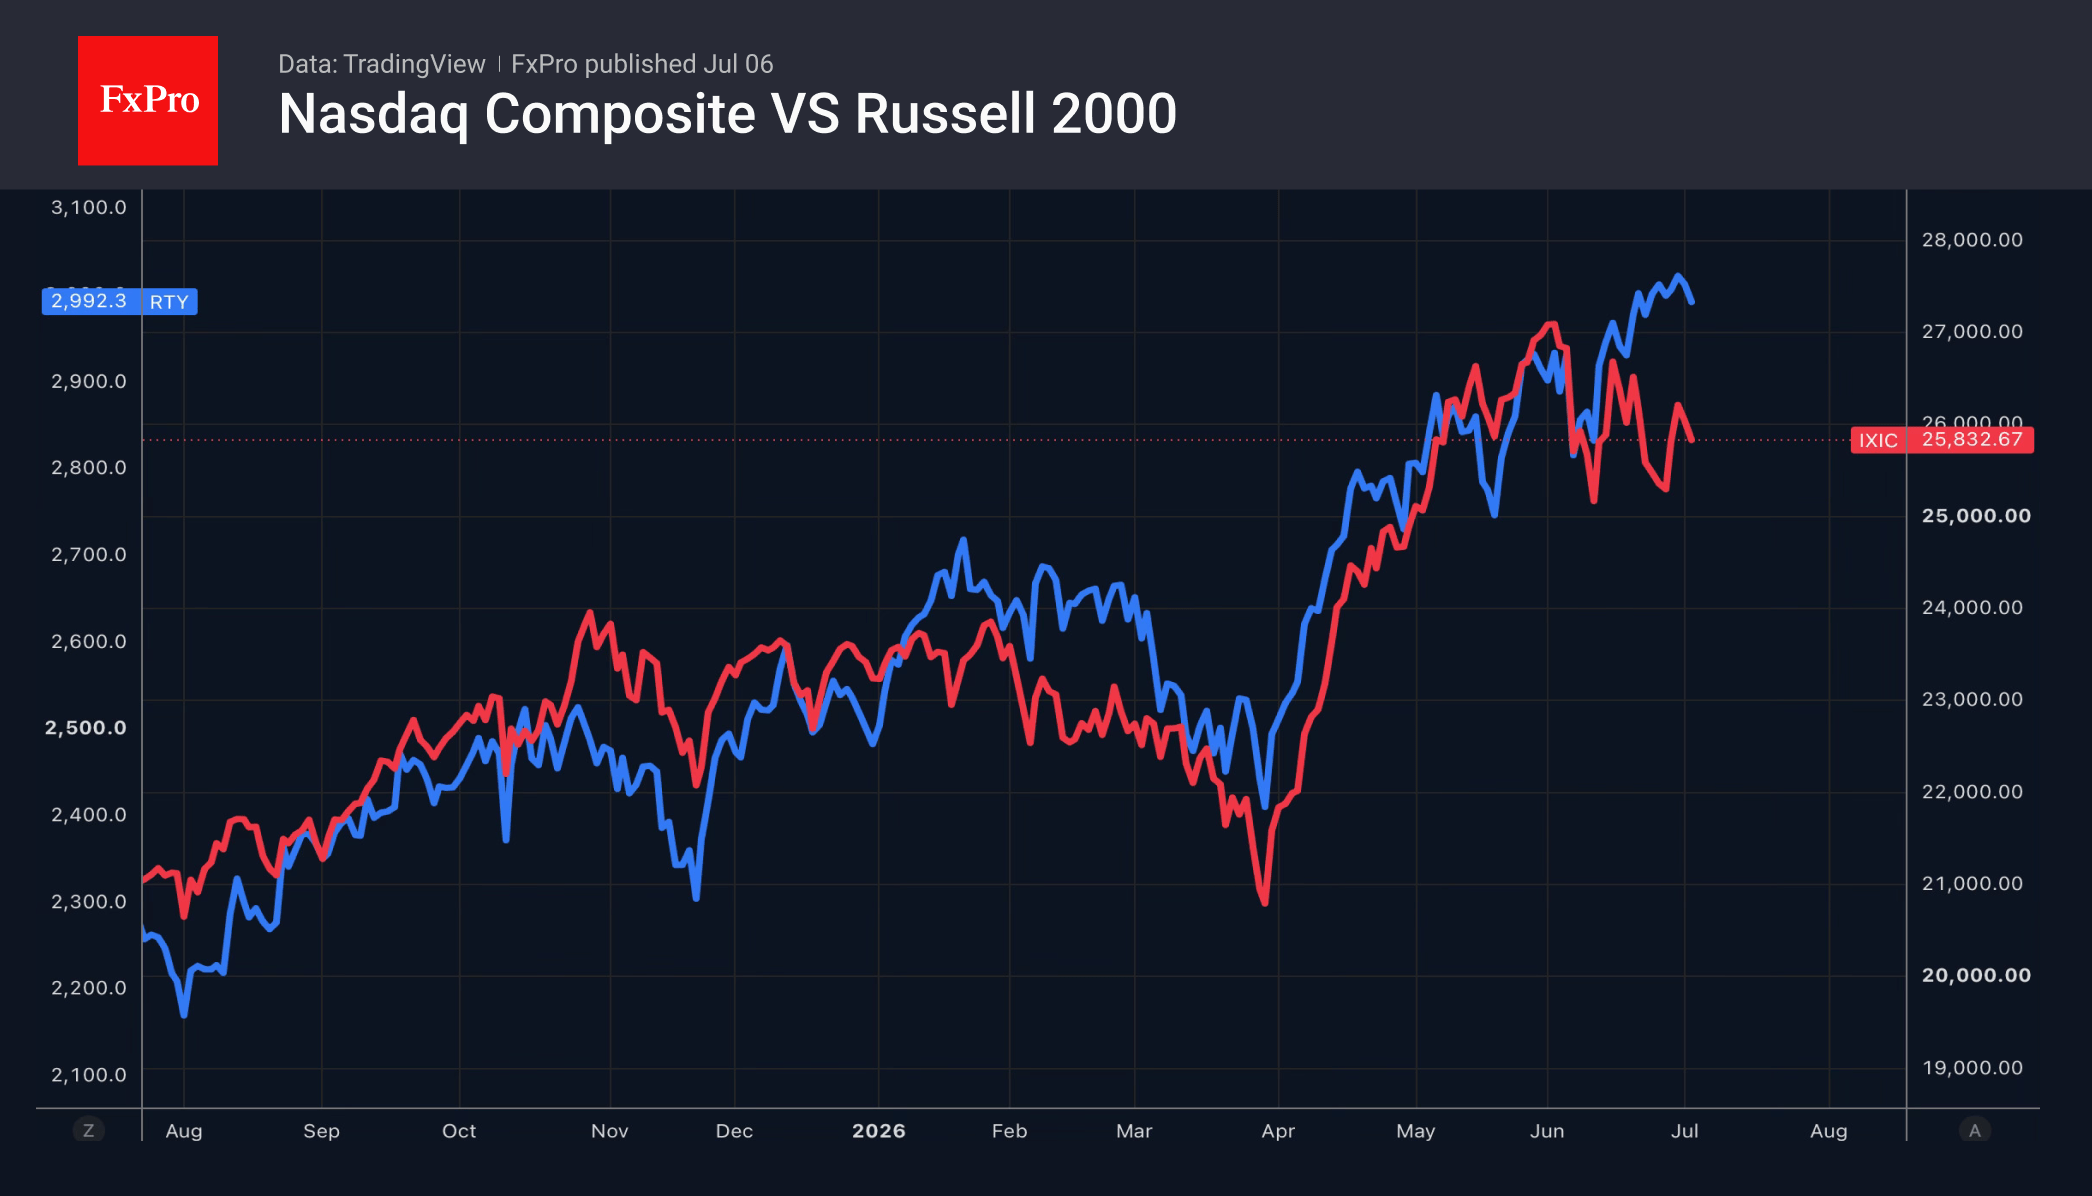
Investor interest in sectors sensitive to the US economy has lifted the Russell 2000 by 22% in the first half of the year. This marks the best performance by the small-cap index since 1991. Between January and June, it outperformed the Nasdaq Composite by 9 percentage points, for the first time since 2006. While the ‘Magnificent Seven’ dominated the market in 2023–2025 and chipmakers’ shares at the beginning of 2026, investors are now seeking new leaders.
The inability to identify them is driving capital outflows. According to Bank of America, citing EPFR Global, US-focused equity funds recorded outflows of $17.2 billion, the worst performance since March. By contrast, their Japanese counterparts recorded their largest inflow in seven weeks, totalling $1.9 billion.
Europe is not left behind. The STOXX Europe 600 has closed in positive territory for four consecutive weeks and has set a new record. Technology, industrial, and utility companies are particularly popular. Falling oil prices are providing a tailwind, as are reduced prospects of monetary policy tightening by the ECB and the Fed, and the associated decline in global bond yields.
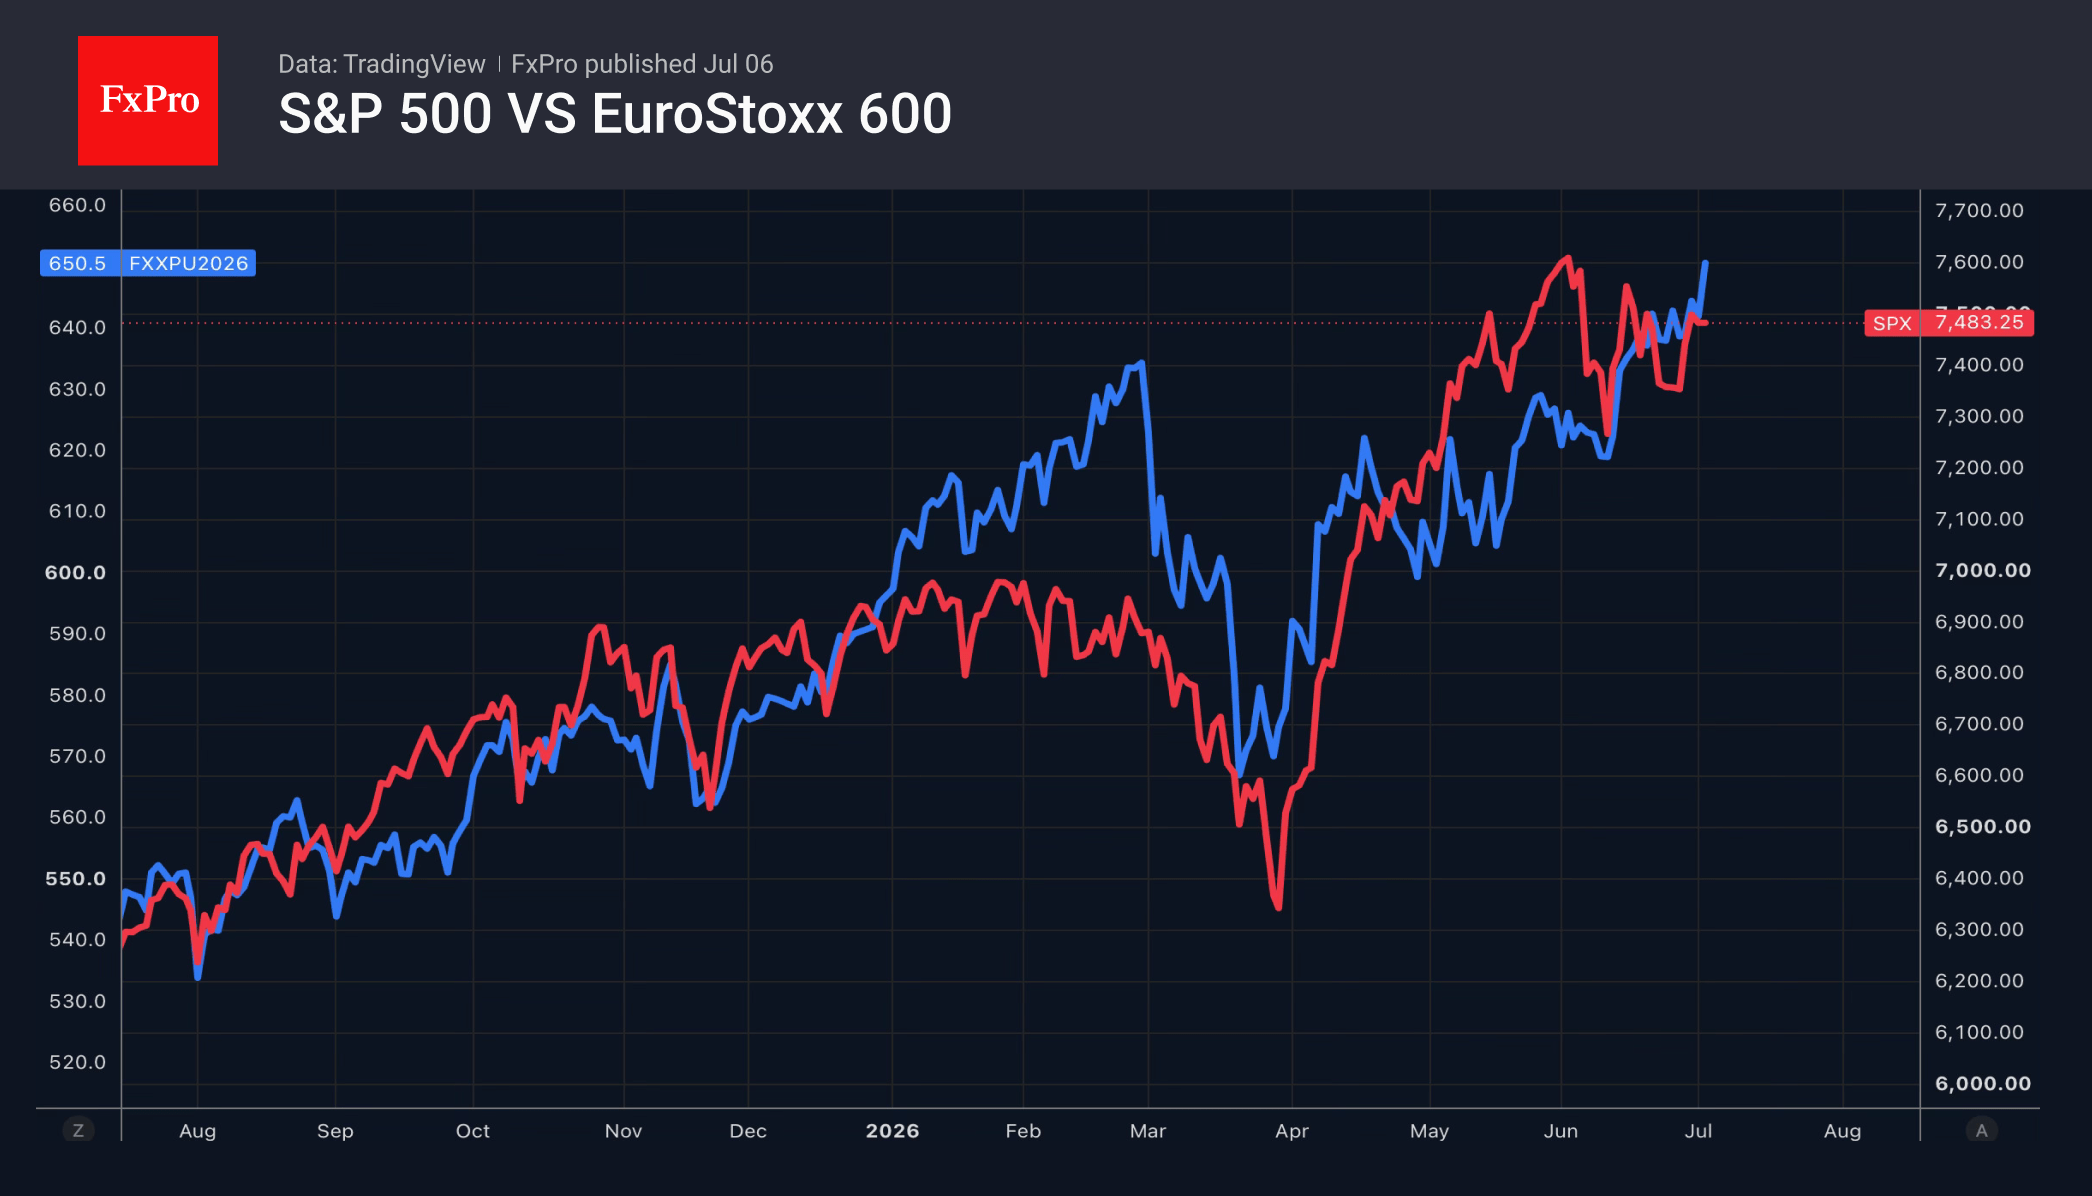
The S&P 500 is underperforming the STOXX Europe 600, but the US stock index has a seasonal advantage. Since 2014, it has never closed July in the red. The average gain at the end of the second month of summer has been 2.5%.
Investors remain encouraged by corporate results. In the first quarter, the net profit margin of S&P 500 companies rose by 14.8%. This marks the strongest performance since records began in 2009. The figure is expected to fall to 14.2% in April–June. However, compared with the same period in 2025, it will be up 3.4%. This is atypical for Wall Street. Over the last 40 quarters, it has lowered its forecasts by an average of 2.7 percentage points.
The FxPro Analyst Team
USD/JPY Bulls Return as Japan’s Intervention Window Closes
USD/JPY bulls are back. After last week's intervention scare briefly knocked the pair lower, Yen selling returned today as the most obvious window for Japanese action passed without official intervention. Dollar's rebound also helped, with markets now appearing to have fully absorbed the dovish surprise from June non-farm payrolls. But the sharper story is in Yen itself: the intervention premium that supported it late last week has quickly evaporated.
Last week's Yen rebound was driven by a shift in market psychology. Reports suggested Japan could abandon the usual cycle of warnings before intervention and instead move without notice, leaving traders exposed to a sudden strike. That threat mattered because it coincided with a window of thin liquidity: Friday's US holiday, followed by the typically quiet Monday Asian open. In such conditions, any official Yen buying would likely have had a larger market impact.
That was the reason traders blinked. The rally in Yen was not based on a narrowing Fed-BoJ rate gap or a material change in Japan's policy outlook. It was a positioning squeeze built around the fear that Tokyo might use holiday liquidity to punish Yen shorts. Once that window closed without intervention, the near-term risk premium dropped sharply, allowing USD/JPY to climb back above 162.
The pattern is familiar. Japan's earlier interventions around April-May took place during holiday or thin-liquidity periods, precisely when official buying could move prices more forcefully. That precedent made the Friday-to-Monday window particularly important. When nothing happened, traders effectively treated the immediate intervention scenario as expired rather than merely reduced.
The underlying trend therefore reasserted itself. US payrolls softened enough to cool expectations for aggressive Fed tightening, but not enough to shift the market toward rate cuts. Investors still expect one Fed hike this year, while BoJ policy remains far below US rates. That leaves carry trades intact and keeps pressure on Yen whenever intervention fears fade.
The nuance is that Tokyo's threat has not lost all credibility. USD/JPY near 162 and potentially toward 165 still carries intervention risk, especially if the move becomes disorderly. But intervention is now best viewed as lumpy and event-driven. It can interrupt the trend, especially around holidays, thin liquidity or psychologically sensitive levels, but it has not yet changed the structural direction.
In currency markets, Dollar is leading the day, followed by Sterling and Aussie. Yen is the clear laggard, followed by Kiwi and Swiss Franc, with Euro and Loonie trading in the middle. The price action suggests traders are no longer trading last week's intervention rumor. They are back to trading the wide policy gap, and that leaves USD/JPY's broader uptrend firmly in play.
Gold Finds Support at $4,000, but Only Softer Inflation Can Fuel the Next Rally
Gold's rebound from the $4,000 area has already begun to lose momentum as markets look beyond soft payrolls and refocus on the Fed's inflation concerns. With investors still pricing another rate hike this year, the July CPI report—not the recent jobs data—may determine whether Gold breaks higher or resumes its broader decline. We examine the macro backdrop, Fed expectations, and the technical levels that matter most. Read More.
NZD/USD Bears Await RBNZ Verdict After Relief Rally
NZD/USD enters one of its most important weeks of the year as the RBNZ faces a finely balanced decision between tackling inflation and supporting growth. With economists and major banks divided over whether the OCR will be raised, the policy statement could prove even more important than the rate decision itself. We examine the competing arguments, what they mean for the Kiwi, and why key technical levels suggest the recent rebound may only be temporary. Read More.
Eurozone Sentix Investor Confidence Surges to -3.1 as Germany's Recovery Gains Traction
Eurozone investor confidence strengthened for a third consecutive month in July as Germany's outlook improved and inflation concerns eased. The latest Sentix survey suggests the region's recovery is becoming more broad-based while reducing pressure on the ECB to tighten policy further. Read More.
Eurozone Producer Inflation Holds Firm as Core Factory Prices Continue to Rise
Eurozone producer inflation accelerated more than expected in May as strong gains in intermediate goods and a solid increase in prices excluding energy offset lower energy costs. The latest PPI report suggests underlying pipeline inflation remained firm even as headline monthly growth slowed. Read More.
Eurozone Retail Sales Rise 0.2% mom in May as Food Spending Leads Growth
Eurozone retail sales met expectations in May as stronger spending on food and non-food goods outweighed weaker fuel sales. While consumer demand remained resilient overall, performance varied widely across member states, highlighting an uneven recovery across the region. Read More.
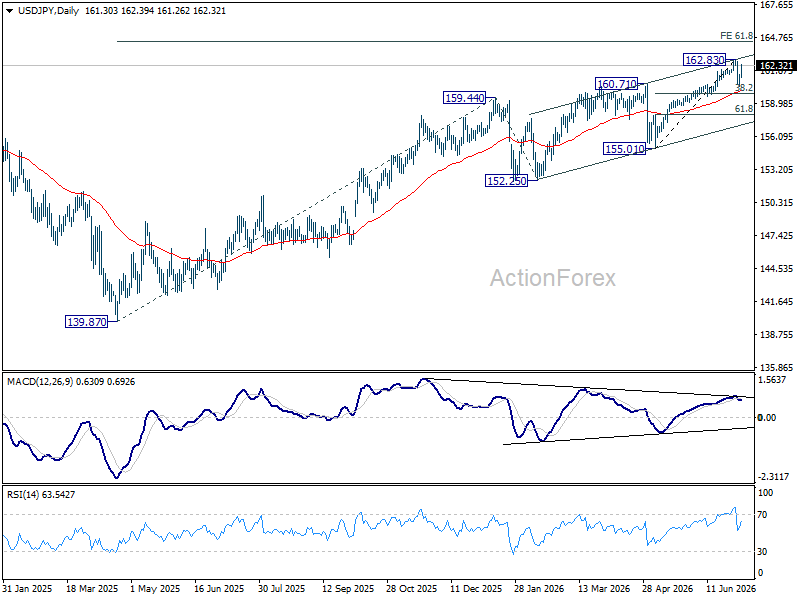
USD/JPY Daily Outlook
Intraday bias in USD/JPY is turned neutral first with current strong rebound. Consolidations could extend below 162.83. But in case of another fall, downside should be contained by 38.2% retracement of 155.01 to 162.83 at 159.84. On the upside, firm break of 162.83 will resume larger up trend.
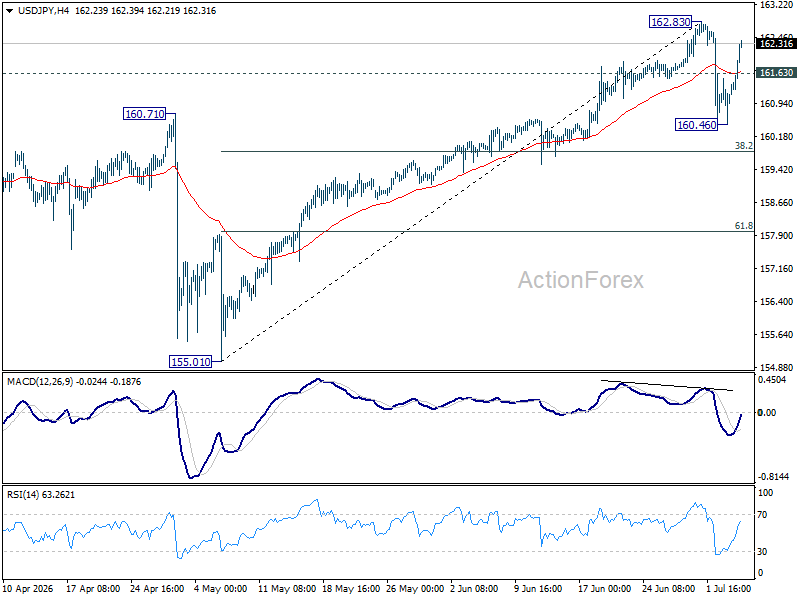
In the bigger picture, rise from 139.87 (2025 low) is seen as another rising leg of the long term up trend. Next target is 61.8% projection of 139.87 to 159.44 from 152.25 at 164.34. For now, outlook will remain bullish as long as 155.01 support holds, even in case of deep pullback.
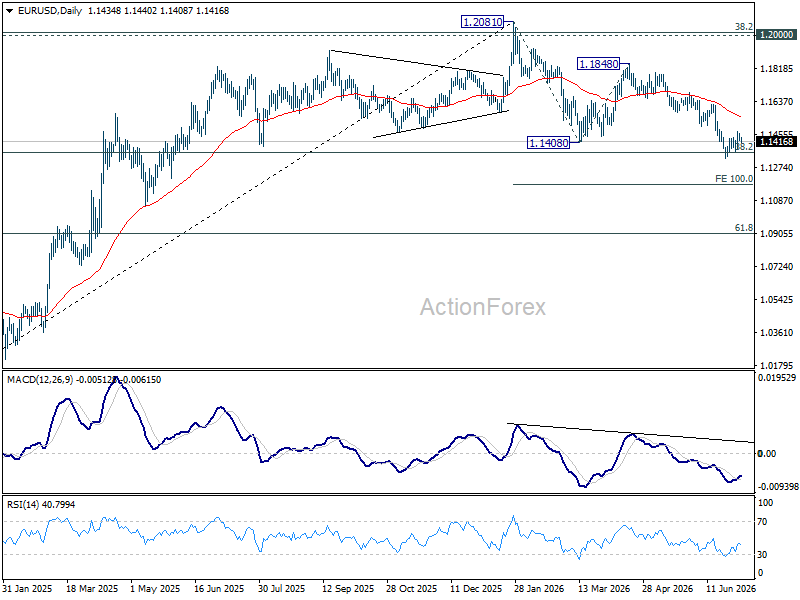
EUR/USD Daily Outlook
Intraday bias in EUR/USD remains neutral and more consolidations could be seen above 1.1323. With 1.1499 support turned resistance intact, further decline is expected. On the downside, break of 1.1323 will resume the fall from 1.2081 to 100% projection of 1.2081 to 1.1408 from 1.1848 at 1.1175. However, decisive break of 1.1499 will turn bias back to the upside for 55 D EMA (now at 1.1559) and above.
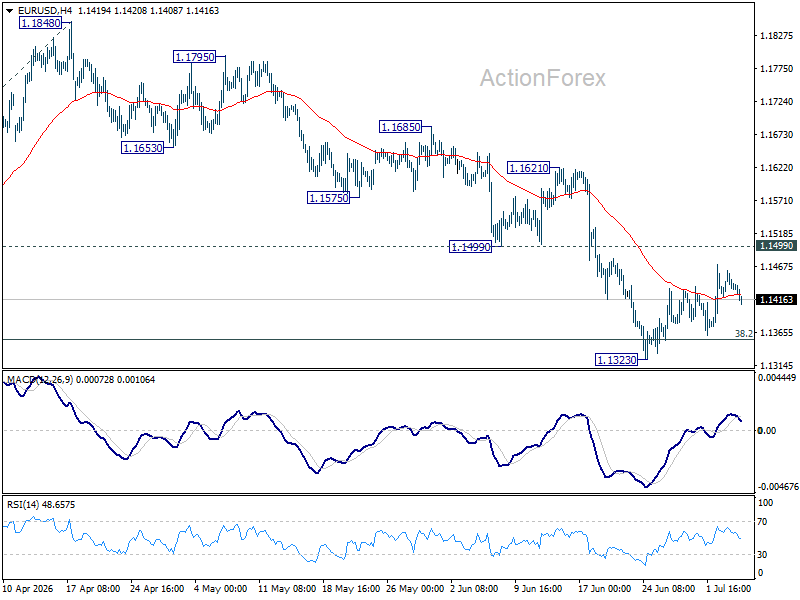
In the bigger picture, focus is back on 38.2% retracement of 1.0176 to 1.2081 at 1.1353. Decisive break there will revive the case of medium term bearish trend reversal after rejection by 1.2 key cluster resistance level. Further fall should be seen to 61.8% retracement at 1.0904. Nevertheless, strong rebound from 1.1353, followed by break of 1.1621 resistance, will retain medium term bullishness.