Sample Category Title
USD/JPY: Japan’s Flash Nikkei Manufacturing PMI Declined To A 3-Month Low Level In March
For the 24 hours to 23:00 GMT, the USD declined 0.24% against the JPY and closed at 111.02.
In the Asian session, at GMT0400, the pair is trading at 111.28, with the USD trading 0.23% higher against the USD from yesterday's close.
The Japanese Yen lost ground, after data indicated that Japan's preliminary Nikkei manufacturing PMI dropped to a level of 52.6 in March, expanding at its slowest pace in three months as growth in new orders and output slowed. The PMI had recorded a level of 53.3 in the previous month.
Early morning data showed that the nation's final leading economic index came in at 104.9 in January, while the preliminary figures had indicated a revised level of 104.8. Meanwhile, the nation's final coincident index dropped less than initially estimated to a level of 115.1 in January, after registering a revised reading of 115.5 in the prior month and compared to a fall to a level of 114.9 in the flash print.
The pair is expected to find support at 110.77, and a fall through could take it to the next support level of 110.26. The pair is expected to find its first resistance at 111.62, and a rise through could take it to the next resistance level of 111.96.
Looking ahead, investors would await Bank of Japan's summary of opinions report coupled with Japan's jobless rate, national consumer price index, flash industrial production, retail trade and large retailers' sales data, all slated to release next week.
The currency pair is trading above its 20 Hr moving average and showing convergence with its 50 Hr moving average.

Trade Idea : USD/CHF – Sell at 1.0000
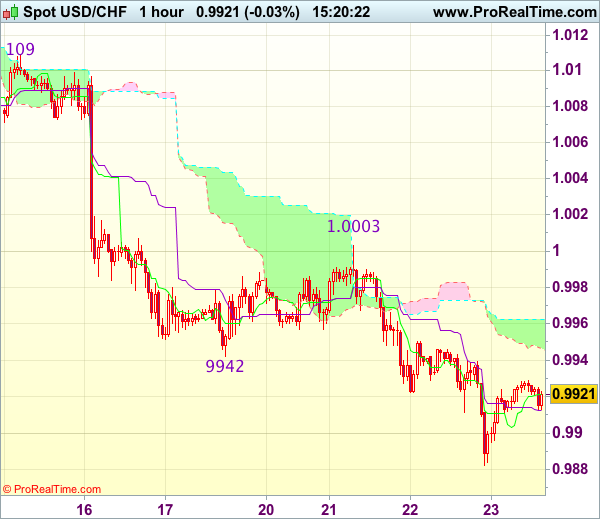
USD/CHF - 0.9954
Most recent candlesticks pattern : N/A
Trend : Near term down
Tenkan-Sen level : 0.9944
Kijun-Sen level : 0.9936
Ichimoku cloud top : 0.9936
Ichimoku cloud bottom : 0.9917
Original strategy :
Sell at 1.0000, Target: 0.9900, Stop: 1.0035
Position : -
Target : -
Stop : -
New strategy :
Sell at 1.0000, Target: 0.9900, Stop: 1.0035
Position : -
Target : -
Stop : -
As the greenback has continued edging higher after rebounding from 0.9882, retaining our view that further consolidation above this week’s low at 0.9882 would be seen and recovery to 0.9980 cannot be ruled out, however, reckon upside would be limited to 0.9992 (38.2% Fibonacci retracement of 1.0171-0.9882) and resistance at 1.0003 should hold, bring retreat later. Below support at 0.9912 would suggest the rebound from 0.9882 has ended, bring another test of this level, break there would extend recent decline to 0.9850 but loss of downward momentum should prevent sharp fall below 0.9825-30.
In view of this, we are looking to sell dollar on further subsequent rebound as resistance at 1.0003 should limit upside and bring another decline. Only above previous support at 1.0060 (now resistance) would abort and signal low is formed instead, risk rebound to 1.0090-95 first.
USD/CHF: Swiss Franc Trading Lower In The Asian Session
For the 24 hours to 23:00 GMT, the USD rose 0.15% against the CHF and closed at 0.9932.
In the Asian session, at GMT0400, the pair is trading at 0.9954, with the USD trading 0.22% higher against the CHF from yesterday’s close.
The pair is expected to find support at 0.9922, and a fall through could take it to the next support level of 0.9891. The pair is expected to find its first resistance at 0.9972, and a rise through could take it to the next resistance level of 0.9991.
Amid a lack of economic releases in Switzerland today, investors would direct their attention to Switzerland’s ZEW expectations survey, UBS consumption indicator, KOF spring economic forecast report, all set to release next week.
The currency pair is trading above its 20 Hr and 50 Hr moving averages.

Trade Idea : GBP/USD – Stand aside
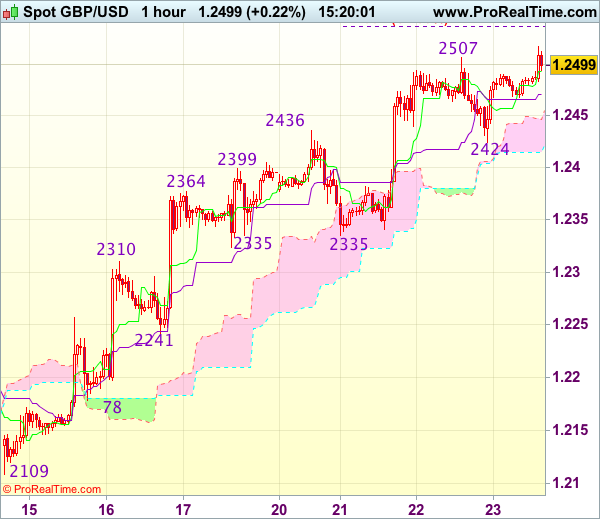
GBP/USD - 1.2477
Most recent candlesticks pattern : N/A
Trend : Near term up
Tenkan-Sen level : 1.2499
Kijun-Sen level : 1.2497
Ichimoku cloud top : 1.2472
Ichimoku cloud bottom : 1.2424
Original strategy :
Buy at 1.2425, Target: 1.2540, Stop: 1.2390
Position : -
Target : -
Stop : -
New strategy :
Stand aside
Position : -
Target : -
Stop : -
As cable has retreated after marginal rise to 1.2531 yesterday, suggesting consolidation below this level would be seen and pullback to 1.2450, then towards support at 1.2424 cannot be ruled out, however, a break below latter level is needed to signal top is formed, bring retracement of recent upmove to 1.2400 and then towards 1.2370 but price should stay well above indicated strong support at 1.2335.
In view of this, would not chase this rise here and would be prudent to stand aside in the meantime. Above said resistance at 1.2531 would signal recent upmove from 1.2109 is still in progress and may extend further gain to 1.2550 but loss of upward momentum would limit upside to previous chart resistance at 1.2570 and price should falter below 1.2600-10, risk from there has increased for a retreat to take place later.
USD/CAD: Loonie Trading On A Weaker Footing, Ahead Of Canada’s Inflation Data
For the 24 hours to 23:00 GMT, the USD rose 0.17% against the CAD and closed at 1.3354.
In the Asian session, at GMT0400, the pair is trading at 1.3366, with the USD trading 0.09% higher against the CAD from yesterday's close.
The pair is expected to find support at 1.3327, and a fall through could take it to the next support level of 1.3289. The pair is expected to find its first resistance at 1.3390, and a rise through could take it to the next resistance level of 1.3415.
This afternoon will bring a crucial Canadian release, namely the consumer price index for February.
The currency pair is trading above its 20 Hr and 50 Hr moving averages.

Trade Idea : EUR/USD – Buy at 1.0720
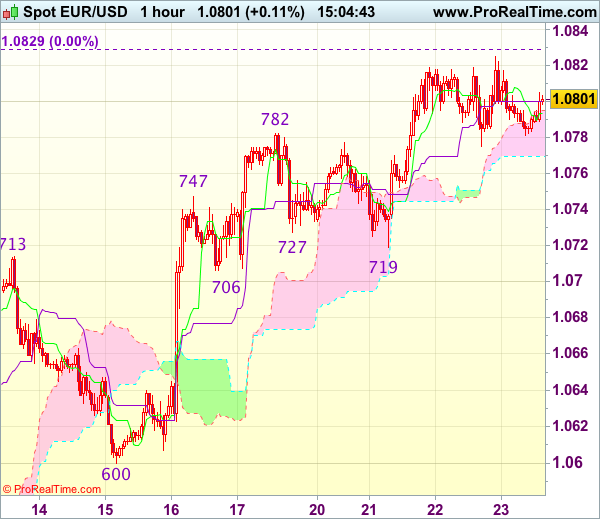
EUR/USD - 1.0765
Most recent candlesticks pattern : N/A
Trend : Near term up
Tenkan-Sen level : 1.0773
Kijun-Sen level : 1.0783
Ichimoku cloud top : 1.0796
Ichimoku cloud bottom : 1.0789
Original strategy :
Buy at 1.0725, Target: 1.0840, Stop: 1.0690
Position : -
Target : -
Stop : -
New strategy :
Buy at 1.0720, Target: 1.0820, Stop: 1.0685
Position : -
Target : -
Stop : -
Although euro’s retreat after rising to 1.0825 suggesting minor consolidation below this level would be seen and pullback to 1.0745-50 cannot be ruled out, reckon support at 1.0719 would limit downside and bring another rise later, above indicated resistance at 1.0825-29 would extend further rise to 1.0850-60 but loss of near term upward momentum should prevent sharp move beyond 1.0880 and price should falter below 1.0900, risk from there has increased for a retreat to take place later.
In view of this, would not chase this rise here and we are looking to buy euro on subsequent pullback as 1.0719 support should limit downside and bring another rise later. Below 1.0690-00 would defer and suggest top is possibly formed, risk weakness to 1.0640 (previous resistance now support) but still reckon indicated support at 1.0600 would remain intact.
Trade Idea : USD/JPY – Sell at 112.20
USD/JPY - 111.48
Most recent candlesticks pattern : N/A
Trend : Near term down
Tenkan-Sen level : 111.17
Kijun-Sen level : 111.06
Ichimoku cloud top : 111.80
Ichimoku cloud bottom : 111.29
Original strategy :
Sell at 112.00, Target: 110.80, Stop: 112.35
Position : -
Target : -
Stop : -
New strategy :
Sell at 112.20, Target: 110.80, Stop: 112.55
Position : -
Target : -
Stop : -
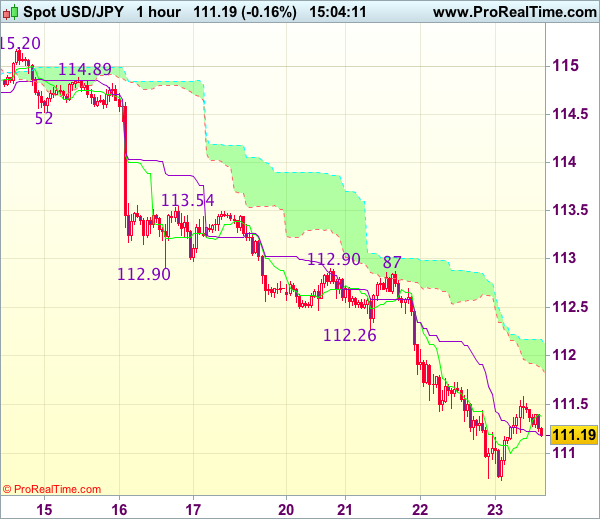
Dollar’s rebound after marginal fall to 110.63 yesterday suggests consolidation above this level would be seen and corrective bounce to 111.80 cannot be ruled out, however, reckon upside would be limited to previous support at 112.26 (now resistance) and bring another decline later. Below 110.75-80 would bring retest of 110.63 but break there is needed to confirm recent decline has resumed for further fall to 110.50, then 110.25-30 but loss of momentum should limit downside to 110.00.
In view of this, would not chase this fall here and would be prudent to sell cable on recovery as previous support at 112.26 should limit upside. Above 112.50 would suggest low is possibly formed, risk a stronger rebound to 112.70 but only break of resistance at 112.87-90 would provide confirmation.
Daily Technical Outlook And Review
A note on lower timeframe confirming price action...
Waiting for lower timeframe confirmation is our main tool to confirm strength within higher timeframe zones, and has really been the key to our trading success. It takes a little time to understand the subtle nuances, however, as each trade is never the same, but once you master the rhythm so to speak, you will be saved from countless unnecessary losing trades. The following is a list of what we look for:
- A break/retest of supply or demand dependent on which way you're trading.
- A trendline break/retest.
- Buying/selling tails ... essentially we look for a cluster of very obvious spikes off of lower timeframe support and resistance levels within the higher timeframe zone.
- Candlestick patterns. We tend to only stick with pin bars and engulfing bars as these have proven to be the most effective.
EUR/USD
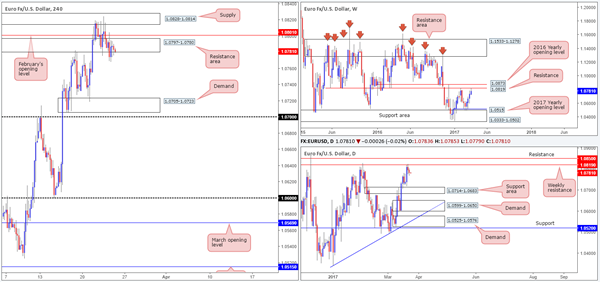
For those who read Thursday's report you may recall our desk suggesting that the bears may have the upper hand in this market. As you can see, H4 price closed below the H4 support area at 1.0797-1.0780, and quickly retested it as a resistance. In view of the higher timeframes also challenging a weekly resistance level at 1.0819, we have entered short on the close of the previous H4 bear candle at 1.0783 and placed our stop above February's opening level (1.0801) at 1.0807.
Our suggestions: With the closest the higher-timeframe support structure not coming into view until we reach the daily support area formed at 1.0714-1.0683, we feel our trade will reach the H4 demand at 1.0705-1.0723 which happens to be positioned around the top edge of the aforementioned daily support area.
Data points to consider: Eurozone PMI data at 8-9am. FOMC member Evans speaks at 12pm and US core durable goods orders comes in just after at 12.30pm GMT.
Levels to watch/live orders:
- Buys: Flat (stop loss: N/A).
- Sells: 1.0783 ([live] stop loss: 1.0807).
GBP/USD:
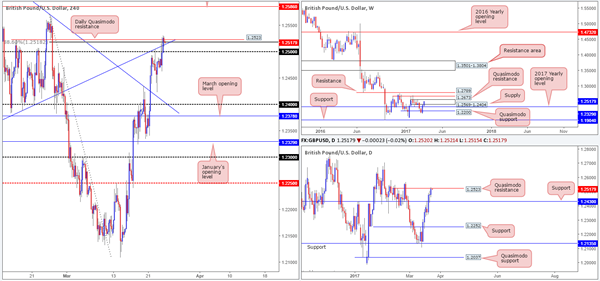
Daily bulls printed their third consecutive bullish candle yesterday, consequently lifting the pair up to a daily Quasimodo resistance line seen at 1.2523. This daily resistance, coupled with weekly price displaying supply at 1.2569-1.2404, places this market in overbought territory from a structural perspective.
However, given that the H4 candles recently closed above both the trendline resistance taken from the low 1.2346 and the 88.6% retracement seen at 1.2518, we'd need to see the bears not only close back below these structures, but also the nearby 1.25 handle, before our team considers shorting this pair.
Our suggestions: Ultimately, we're recommending holding fire and waiting for the bears to prove themselves before committing. A decisive close beyond 1.25 would, in our view, be an important bearish cue to begin hunting for shorts on any retest seen to the underside of this region. Targets from this point can be seen at the H4 mid-way support logged at 1.2450, followed by the 1.24 handle.
Data points to consider: FOMC member Evans speaks at 12pm and US core durable goods orders comes in just after at 12.30pm GMT.
Levels to watch/live orders:
- Buys: Flat (stop loss: N/A).
- Sells: Watch for price to engulf 1.25 and then look to trade any retest seen thereafter (stop loss: dependent on the rejection candle, as we'd look to place the stop beyond the rejection candle's wick).
AUD/USD
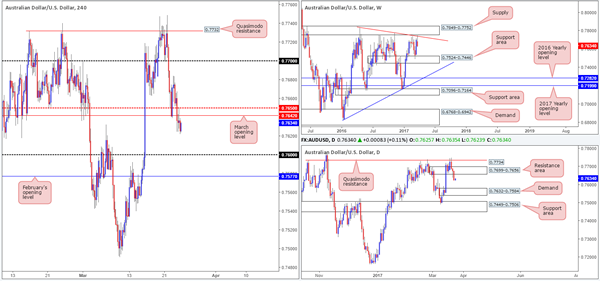
Working our way from the top this morning, weekly bears appear to be in fine form as they continue selling this market after clipping the underside of a trendline resistance taken from the high 0.7835. On the condition that this pair remains in the red, the next port of call can be seen at 0.7524-0.7446: a weekly support zone. In conjunction with weekly price, we can see that yesterday's daily candle ran through the support area at 0.7699-0.7656, and has potentially opened up the runway south down to demand coming in at 0.7632-0.7584 (located a few pips above the aforementioned weekly support area).
Swinging across to the H4 chart, March's opening level at 0.7642 is currently doing a superb job in holding the unit lower. The next area of focus from this angle is seen relatively close by at the 0.76 handle, followed by February's opening level at 0.7577 (positioned within the above noted daily demand).
Our suggestions: Initially our team showed interest in shorting the underside of March's opening base line. Unfortunately, we missed the first retest. Therefore, should we be lucky enough to witness price retest this level for a second time today, our desk would drill down to the lower-timeframe structure and hunt for a sell setup (see the top of this report), which would likely enable us to enter with a tighter stop, and thus increase risk/reward.
Data points to consider: FOMC member Evans speaks at 12pm and US core durable goods orders comes in just after at 12.30pm GMT.
Levels to watch/live orders:
- Buys: Flat (stop loss: N/A).
- Sells: 0.7642 region ([waiting for a lower-timeframe signal to form is advised before pulling the trigger] stop loss: dependent on where one confirms this area).
USD/JPY
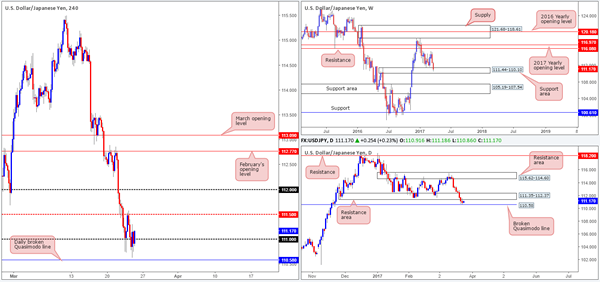
Despite the pair closing lower for its eighth consecutive day yesterday, weekly price remains trading within the walls of a support area at 111.44-110.10. In addition to this, daily action is also seen capped between a resistance area at 111.35-112.37 and a nearby broken Quasimodo line at 110.58.
Although the H4 candles are currently trading above the 111 handle, we do not see much to hang our hat at this level. For the time being, momentum looks stronger to the downside as very few bullish candles have printed over the past few days. Furthermore, a buy from here would place one in direct conflict with the underside of the above said daily resistance area. And a sell from this base would, of course, position one against potential weekly buyers from the support area (see above).
Our suggestions: While 111 could remain intact today, we would prefer to wait and see if price touches gloves with the daily broken Quasimodo line mentioned above at 110.58 before looking to go long. That way, traders have the option of placing their stops beyond the weekly support area and also have some room to play with up to the aforementioned daily resistance zone.
Data points to consider: FOMC member Evans speaks at 12pm and US core durable goods orders comes in just after at 12.30pm GMT.
Levels to watch/live orders:
- Buys: 110.58 region (stop loss: ideally beyond the current weekly support area at 110.08ish).
- Sells: Flat (stop loss: N/A).
USD/CAD:
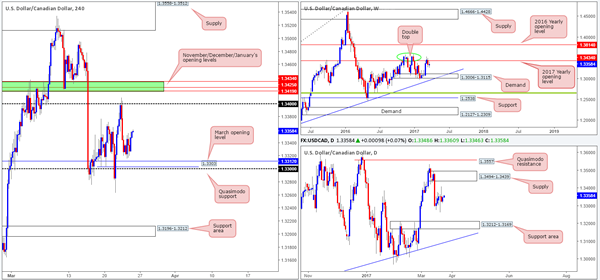
Price took on more of a subdued stance yesterday, ranging around 40 pips on the day. As of current (H4) price, the next area of focus to the upside can be seen at the 1.34 handle, followed closely by 1.3434/1.3419 (November, December and January's opening levels). Beneath current price, however, we still have an eyeball on the 1.33/1.3312 neighborhood (a H4 Quasimodo support at 1.3303, the 1.33 handle and March's opening base line at 1.3312).
Weekly action is currently seen trading below the 2017 yearly opening level at 1.3434, and shows room to drop lower from here. Daily flow on the other hand, offers very little in terms of direction at the moment, given that the unit is seen meandering mid-range between a supply coming in at 1.3494-1.3439 and a support area at 1.3212-1.3169.
Our suggestions: Essentially, we have our eye on two zones today:
1. The H4 1.33/1.3312 neighborhood. We would strongly advise waiting for a lower-timeframe confirming signal to take shape before pressing the buy button (see the top of this report), due to the lack of higher-timeframe confluence seen here.
2. The H4 1.3434/1.3419 region. When these monthly levels converge, we typically find that they hold firm the majority of the time offering at least a bounce. Also of note is the 1.34 handle. Psychological levels are prone to fakeouts, and with 1.3434/1.3419 lurking just above 1.34, we feel it'd be a fantastic barrier to help facilitate a fakeout.
Data points to consider: FOMC member Evans speaks at 12pm and US core durable goods orders comes in just after at 12.30pm. Canadian inflation report at 12.30pm GMT.
Levels to watch/live orders:
- Buys: 1.33/1.3312 ([waiting for a lower-timeframe buy signal to form is advised before pulling the trigger] stop loss: dependent on where one confirms this area).
- Sells: 1.3434/1.3419 ([waiting for a lower-timeframe sell signal to form is advised before pulling the trigger] stop loss: dependent on where one confirms this area).
USD/CHF
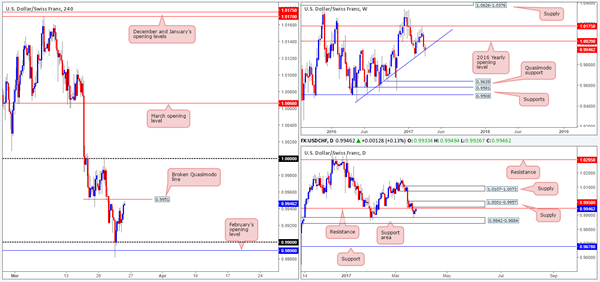
Wednesday's rebound from the 0.99 handle extended higher on Thursday, bringing the unit up to within touching distance of a H4 broken Quasimodo line at 0.9951. While this level also converges nicely with a daily resistance pegged at 0.9950 and a H4 61.8% Fib resistance planted at 0.9956, we have to take into account that weekly price is trading back above the weekly trendline support taken from the low 0.9443.
Before our desk considers buying this market, the daily supply zone at 1.0001-0.9957 would need to be engulfed. A sell from the 0.9950 region on the other hand, is something that interests us. Yes, by selling here, you're effectively shorting into potential weekly flow, but given the confluence surrounding this number, a bounce will likely be seen.
Our suggestions: To be on the safe side, a short from 0.9950 will only be considered valid should we manage to pin down a lower-timeframe sell signal (see the top of this report). From that point, the 0.99 barrier would the first take-profit zone.
Data points to consider: FOMC member Evans speaks at 12pm and US core durable goods orders comes in just after at 12.30pm GMT.
Levels to watch/live orders:
- Buys: Flat (stop loss: N/A).
- Sells: 0.9950 region ([waiting for a lower-timeframe sell signal to form is advised before pulling the trigger] stop loss: dependent on where one confirms this area).
DOW 30:
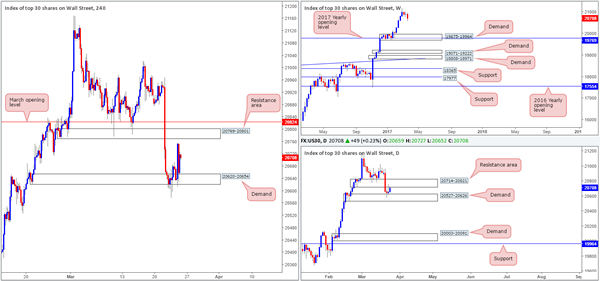
Thanks to the daily resistance area seen printed at 20714-20821, daily flow chalked in a relatively aggressive selling wick yesterday. Over on the H4 chart, demand at 20620-20654 remains intact despite suffering multiple whipsaws. The next area of concern on this scale can be seen at 20769-20801: a resistance area that's shadowed closely by March's opening base line at 20824. The weekly chart recently topped at a record high of 21170, and shows room to drop down as far as the demand area at 19675-19964, which happens to fuse with the 2017 yearly opening level at 19769.
Our suggestions: With the daily candles sandwiched between the aforementioned resistance area and demand zone at 20527-20626, trading this market is tricky, especially as H4 price is also trading mid-range between the above noted H4 demand and resistance area!
As such, we intend on remaining flat into the close and reassessing the situation on Monday.
Data points to consider: FOMC member Evans speaks at 12pm and US core durable goods orders comes in just after at 12.30pm GMT.
Levels to watch/live orders:
- Buys: Flat (stop loss: N/A).
- Sells: Flat (stop loss: N/A).
GOLD
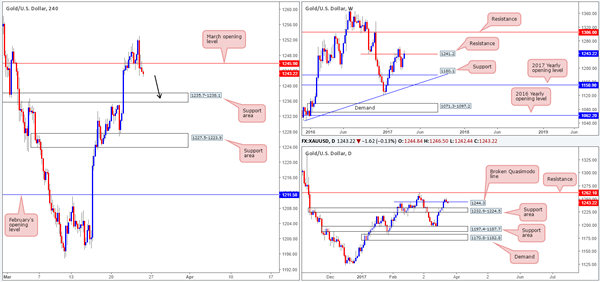
Going into the early hours of yesterday's US segment, the yellow metal traded to a high of 1253.0 and then aggressively plunged back below March's opening level at 1245.9. As of current price, H4 action looks to be on course to connect with the support area coming in at 1235.7-1238.1. By the same token, the weekly chart shows that the buyers and sellers continue to battle for position around the resistance line pegged at 1241.2, and daily flow is trading back below the Quasimodo resistance at 1244.3.
Our suggestions: With the recent developments, and the recently closed H4 bearish candle formed at the underside of 1245.9, we believe a short in this market is valid with stops above the H4 candle wick (1246.5) at 1247.0, and an initial take-profit objective set at the H4 support area drawn from 1235.7-1238.1. However, seeing as how the team is already short the EUR, we'll pass on this setup.
Levels to watch/live orders:
- Buys: Flat (stop loss: N/A).
- Sells: Shorting at current price is valid, in our opinion, with stops placed at 1247.0
EUR/JPY Candlesticks and Ichimoku Analysis
Weekly
• Last Candlesticks pattern: Hammer
• Time of formation: 19 Sep 2016
• Trend bias: Down
Daily
• Last Candlesticks pattern: Hammer
• Time of formation: 9 Nov 2016
• Trend bias: Near term up
EUR/JPY – 122.09
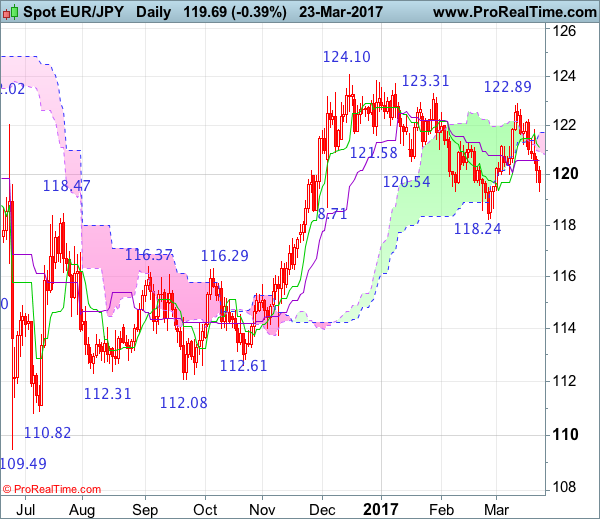
Although the single currency staged a brief bounce to 121.84 earlier this week, renewed selling interest quickly emerged there and the pair has dropped quite sharply again, dampening our bullishness and suggesting the rebound from 118.24 has ended at 122.89 last week, bring further fall to 119.00 but still reckon 118.80 would limit downside and price should stay well above said support at 118.24, bring another rebound later. Only a drop below said support at 118.24 would signal the erratic decline from 124.10 top has resumed and bring subsequent fall to 117.90-00, then 117.40-50.
On the upside, whilst initial recovery to 120.00-10 cannot be ruled out, reckon upside would be limited to the Kijun-Sen (now at 120.57) and bring another decline later. A daily close above the Tenkan-Sen (now at 121.20) would defer and risk rebound to the upper Kumo (now at 121.72) but only break of said resistance at 121.84 would revive bullishness and signal the fall from 122.89 has ended instead, bring further gain to 122.50, then retest of said resistance at 122.89. Looking ahead, a break there is needed to signal the rise from 118.24 low has resumed and extend further gain to resistance at 123.31, a daily close above this level would suggest the entire fall from 124.10 top has ended at 118.24 back in Feb and bring further subsequent headway towards this level.
Recommendation: Stand aside in the meantime.
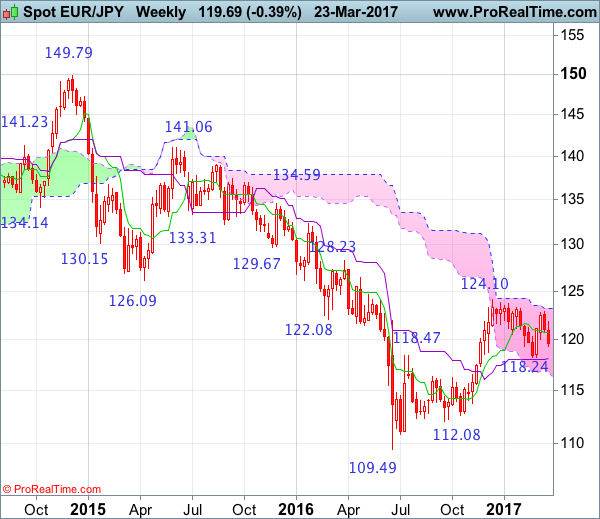
On the weekly chart, despite rising to 122.89 earlier this month, the subsequent retreat formed two consecutive black candlesticks, suggesting the rebound from 118.24 has ended there and downside risk remains for weakness to 119.00 but said support at 118.24 should remain intact, bring further choppy trading. In the event euro drops below 118.24 level, this would signal the retreat from 124.10 top is still in progress and near term downside bias remains for this move to bring retracement of recent upmove, hence weakness to the Kijun-Sen (now at 118.09) is likely but a weekly close below there is needed to signal the rise from 109.49 has ended, bring further decline to 117.30-35, however, previous resistance at 116.29 should contain downside due to near term oversold condition, bring rebound later.
On the upside, expect recovery to be limited to 120.00-10 and the Tenkan-Sen (now at 120.78) should hold from here, bring another decline later. Only above said resistance at 121.84 would suggest the pullback from 122.89 has ended instead, bring another test of this level, break there would signal the rebound from 118.24 is still in progress and may extend gain to indicated key resistance at 123.31. Looking ahead, a break above this level is needed to retain bullishness and signal recent rise from 109.49 low has resumed for retracement of early decline to 125.25-30 (50% Fibonacci retracement of 141.06-109.49), having said that, reckon resistance at 126.47 would cap upside and price should falter below resistance at 128.23, bring retreat later.
USD/CAD Candlesticks and Ichimoku Analysis
Weekly
• Last Candlesticks pattern: Bullish engulfing
• Time of formation: 02 May 2016
• Trend bias: Up
Daily
• Last Candlesticks pattern: Hammer
• Time of formation: 19 Oct 2016
• Trend bias: Up
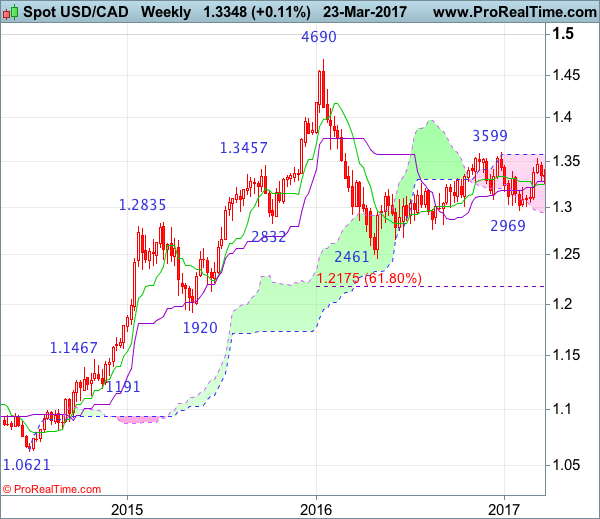
USD/CAD – 1.3350
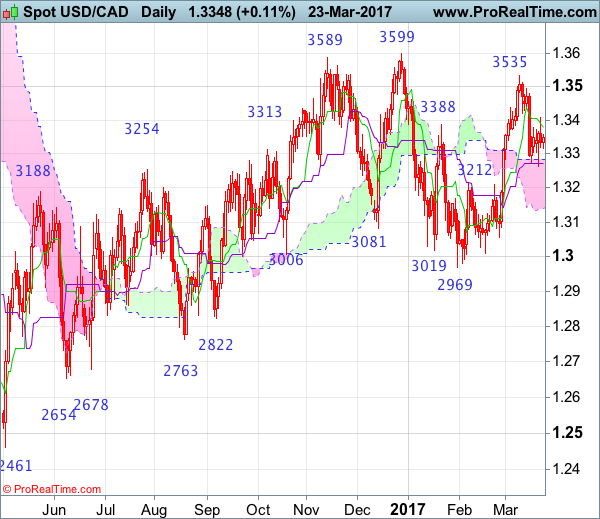
Although the greenback found support at 1.3264 and recovered, as renewed selling interest emerged at 1.2409 and price has retreated, suggesting near term downside risk remains for the retreat from 1.3535 top to bring retracement of recent upmove and below said support at 1.3264 would bring weakness to 1.3230, however, reckon downside would be limited to 1.3200 and bring another rise later. A daily close above 1.2409 resistance would suggest the pullback from 1.3535 top has ended and bring further gain to 1.2490-00 but said resistance at 1.3535 would hold on first testing. Looking ahead, only a break of this level would retain bullishness and extend early erratic upmove from 1.2461 low to 1.3599, then 1.3660-70 but still reckon upside would be limited to 1.3700 and risk from there is seen for a retreat later.
On the downside, whilst initial fall to 1.3250 cannot be ruled out, reckon 1.3200 would limit downside and bring another rebound later. Only below previous resistance at 1.3210 would abort and signal top has indeed been formed at 1.3535, bring further fall to 1.3160-65 and possibly towards 1.3100 but price should stay well above support at 1.3056, bring rebound later. Only a daily close below this level would revive bearishness and signal the rebound from 1.2969 has indeed ended, bring further fall to 1.3000 first, however, said support at 1.2969 should remain intact.
Recommendation: Buy at 1.3200 for 1.3400 with stop below 1.3100.
On the weekly chart, as the greenback retreated after meeting resistance at 1.3535, suggesting consolidation below this level would be seen and pullback to 1.3250-60 cannot be ruled out, however, reckon downside would be limited to 1.3200-10 and bring another rise later. Above 1.3405-10 would bring test of 1.3495 resistance but break of latter level is needed to signal the pullback from 1.3535 has ended, bring retest of this level first, break there would extend recent rise from 1.2969 to indicated resistance at 1.3599, however, a break of this resistance is needed to retain bullishness and signal upmove from 1.2461 (2016 low) has resumed for headway to 1.3700 and later towards 1.3835-40 (61.8% Fibonacci retracement of 1.4690-1.2461) which is likely to cap upside.
On the downside, although pullback to the Tenkan-Sen (now at 1.3252) cannot be ruled out, reckon downside would be limited to 1.3210 and bring another rise later. A drop below previous resistance at 1.3210 would suggest a temporary top is formed instead, risk weakness to 1.3150-60, break there would add credence to this view and signal the rebound from 1.2969 has ended, bring further fall to towards 1.3083, however, indicated support at 1.3056 support should hold.