Sample Category Title
US Healthcare Vote And CBR Rate Decision In Focus
News and Events:
USD in the doldrums ahead of key vote
The end of the week was particularly tense in the FX market after the much-awaited vote from the House of Representatives on the plan to repeal and replace parts of the Affordable Care Act. The US dollar has been trading in a volatile range against most of its counterparts as market participants grow impatient. It may seem surprising that the market is monitoring closely the development of this specific subject as it will not be a game changer for the US economy. In fact, it is widely seen as a test for Donald Trump and his ability to pass the promised reforms. In short, if Obamacare is not repealed, it will seriously damage the market’s confidence and would most likely trigger a sell-off in the equity market and increase selling pressure on the USD.
After sliding 0.25% during the Asian session, the single currency rapidly returned above the 1.08 threshold as European traders stepped in. The dollar index was in free fall as it tumbled 0.30% in a couple of hours to reach 99.697. EUR/USD is currently testing a key resistance area at around 1.08 (Fibo 38.2% on May 2016 - January 2017 debasement at 1.0828 and previous highs); if broken the door is wide open towards 1.10.
Russia set to hold rates unchanged at 10%
The Central Bank of Russia is due to announce its key rate decision later this morning but we believe that rates will remain unchanged at 10%.
The ruble has been strengthening since the beginning of the year, providing some room for the central bank to lower rates, but we think that inflation expectations are still too high. Even though inflation is dropping at a fast pace it still lies at 4.4% y/y and should prevent the central bank from lowering rates to 9.75%.
The CBR’s cautiousness since its last meeting was mostly due to the Fed hiking rates and although dollar demand should strengthen, the ruble has been performing well. Nevertheless, weaker global oil prices are adding downside pressures on the ruble.
Finally, global uncertainties continue to linger and the central bank has already announced that it will not rush to cut rates. It is likely that policymakers are waiting for GDP to enter positive territory before making any serious moves. For the time being, we maintain our bullish stance on the ruble.
Today's Key Issues (time in GMT):
- Mar P Markit France Manufacturing PMI, exp 52,4, last 52,2 EUR / 08:00
- Mar P Markit France Services PMI, exp 56,1, last 56,4 EUR / 08:00
- Mar P Markit France Composite PMI, exp 55,8, last 55,9 EUR / 08:00
- mars.17 Money Supply Narrow Def, last 8.86t RUB / 08:00
- Feb PPI MoM, last 1,90% EUR / 08:00
- Feb PPI YoY, last 7,50%, rev 7,60% EUR / 08:00
- Italy's Padoan, EU's Dombrovkis Meet in Rome EUR / 08:00
- Mar P Markit/BME Germany Manufacturing PMI, exp 56,5, last 56,8 EUR / 08:30
- Mar P Markit Germany Services PMI, exp 54,5, last 54,4 EUR / 08:30
- Mar P Markit/BME Germany Composite PMI, exp 56, last 56,1 EUR / 08:30
- Mar P Markit Eurozone Manufacturing PMI, exp 55,3, last 55,4 EUR / 09:00
- Mar P Markit Eurozone Services PMI, exp 55,3, last 55,5 EUR / 09:00
- Mar P Markit Eurozone Composite PMI, exp 55,8, last 56 EUR / 09:00
- Feb BBA Loans for House Purchase, exp 44900, last 44657, rev 44142 GBP / 09:30
- ECB's Angeloni speaks in Milan EUR / 10:15
- mars.24 Key Rate, exp 10,00%, last 10,00% RUB / 10:30
- Fed's Evans Speaks at Community Development Event USD / 12:00
- Bank of Russia Governor Nabiullina holds news conference RUB / 12:00
- Feb CPI NSA MoM, exp 0,20%, last 0,90% CAD / 12:30
- Feb CPI YoY, exp 2,10%, last 2,10% CAD / 12:30
- Feb CPI Core- Common YoY%, last 1,30% CAD / 12:30
- Feb CPI Core- Median YoY%, last 1,90% CAD / 12:30
- Feb P Durable Goods Orders, exp 1,30%, last 2,00% USD / 12:30
- Feb CPI Core- Trim YoY%, last 1,70% CAD / 12:30
- Feb P Durables Ex Transportation, exp 0,60%, last 0,00% USD / 12:30
- Feb Consumer Price Index, last 129,5 CAD / 12:30
- Feb P Cap Goods Orders Nondef Ex Air, exp 0,50%, last -0,10% USD / 12:30
- Feb P Cap Goods Ship Nondef Ex Air, exp 0,20%, last -0,40% USD / 12:30
- Fed's Bullard to Speak to Economic Club of Memphis USD / 13:05
- Feb Current Account Balance, exp $0m, last -$5085m BRL / 13:30
- Feb Foreign Direct Investment, exp $5000m, last $11528m BRL / 13:30
- Mar P Markit US Manufacturing PMI, exp 54,8, last 54,2 USD / 13:45
- Mar P Markit US Services PMI, exp 54, last 53,8 USD / 13:45
- Mar P Markit US Composite PMI, last 54,1 USD / 13:45
- Revisions: Wholesale sales and inventories USD / 14:00
- Fed's Dudley Speaks in New York at York College USD / 14:00
- Feb Total Jobseekers, exp 3457.0k, last 3467.9k EUR / 17:00
- Feb Jobseekers Net Change, exp -10, last 0,8 EUR / 17:00
- Fed's Williams Speaks in Q&A USD / 17:30
- Feb Tax Collections, exp 93000m, last 137392m BRL / 22:00
The Risk Today:
EUR/USD keeps on pushing higher, even though the pair is now pausing around 1.0800. A break of the upside channel would signal persistent buying pressures. Key resistance is given at a distance 1.0874 (08/12/2017 high). Strong support can be found at 1.0493 (22/02/2017 low). The technical structure suggests deeper increase towards resistance at 1.0874. In the longer term, the death cross late October indicated a further bearish bias. The pair has broken key support given at 1.0458 (16/03/2015 low). Key resistance holds at 1.1714 (24/08/2015 high). Expected to head towards parity.
GBP/USD now lies in a short-term uptrend channel. There are rooms for further strength. Hourly resistance is located at 1.2570 (24/02/2017 high). Hourly support is given at 1.2324 (03/17/2017 low). Expected to show continued strength. The long-term technical pattern is even more negative since the Brexit vote has paved the way for further decline. Long-term support given at 1.0520 (01/03/85) represents a decent target. Long-term resistance is given at 1.5018 (24/06/2015) and would indicate a long-term reversal in the negative trend. Yet, it is very unlikely at the moment.
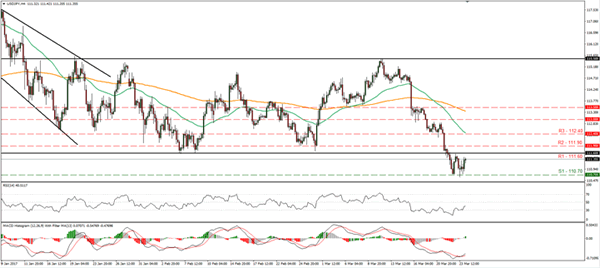
USD/JPY has failed to break key resistance given at 115.62 (19/01/2016 high) confirming persistent selling pressures. The pair has broken strong support at 111.36 (28/11/2016 low). Hourly resistance can be located at 113.57 (16/03/2017 high). We favor a long-term bearish bias. Support is now given at 96.57 (10/08/2013 low). A gradual rise towards the major resistance at 135.15 (01/02/2002 high) seems absolutely unlikely. Expected to decline further support at 93.79 (13/06/2013 low).
USD/CHF is declining. Hourly support is given at 0.9862 (31/01/2017 low). Key resistance can be found at a distance at 1.0344 (15/12/2016 high). Expected to show continued weakness. In the long-term, the pair is still trading in range since 2011 despite some turmoil when the SNB unpegged the CHF. Key support can be found 0.8986 (30/01/2015 low). The technical structure favours nonetheless a long term bullish bias since the unpeg in January 2015.
| EURUSD | GBPUSD | USDCHF | USDJPY |
| 1.1300 | 1.3445 | 1.0652 | 121.69 |
| 1.0954 | 1.3121 | 1.0344 | 118.66 |
| 1.0874 | 1.2771 | 1.0171 | 115.62 |
| 1.0800 | 1.2496 | 0.9914 | 111.11 |
| 1.0454 | 1.1986 | 0.9862 | 106.57 |
| 1.0341 | 1.1841 | 0.9550 | 106.04 |
| 1.0000 | 1.0520 | 0.9444 | 101.20 |
Trumponomics Postponed Further
Today's key points
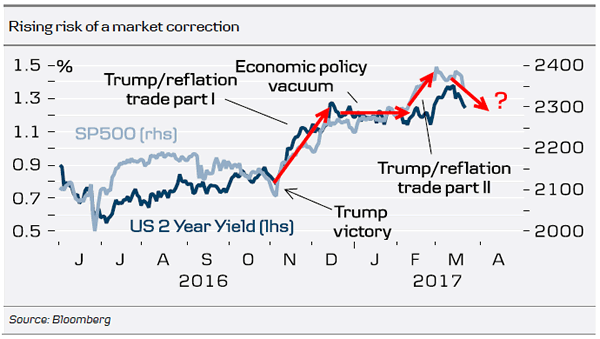
- Rising risk of a market correction.
- Less support to risk sentiment as we are close to a peak in global PMIs and the risk of Trump disappointing the markets is increasing.
- Monetary policy set to stay accommodative in both the US and Europe.
- Changes to US economic policy are likely to come later and be smaller than previously expected.
- The risk of a US military conflict with North Korea is rising.
In Strategy: Three reasons why bond bears should be careful, 17 March, we warned there was a rising risk of a market correction. This week we saw the biggest one-day fall in S&P 500 since October 2016. Two main ingredients have driven stocks higher since the trough at the beginning of November. The first and, in our view, most important factor has been the turn in the global business cycle, as we are in the strongest synchronised economic recovery since 2009. The second factor has been expectations of more growthfriendly economic policy under President Donald Trump. While accelerating growth and expectations of more growth-friendly economic policy have supported risk sentiment over the past six months, we are now close to a peak in PMIs and we believe the risk of Trump disappointing the markets is increasing.
While our MacroScope short-term models remain strong across regions, our mediumand long-term models have weakened. This suggests we are close to the peak in global PMIs, after they increased sharply across regions over the past six months. This does not mean the economic recovery is set to pause but that growth is no longer accelerating. As we argued last week, whether or not growth is accelerating is the key driver for a bond bear market, not the level of growth. This week, the rally in US fixed income following the Fed meeting continued and US 10-year Treasury yields are now trading at 2.4%. While a peak in PMIs means less support for equities, we are still positive on stock markets in the medium to long term, as we expect global growth to pick up in 2018. A correction in the market would just lead to a pause in the longer term bull trend and we still like to buy on dips.
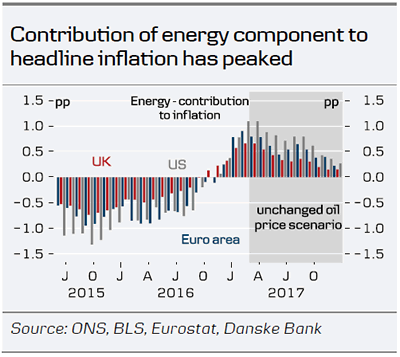
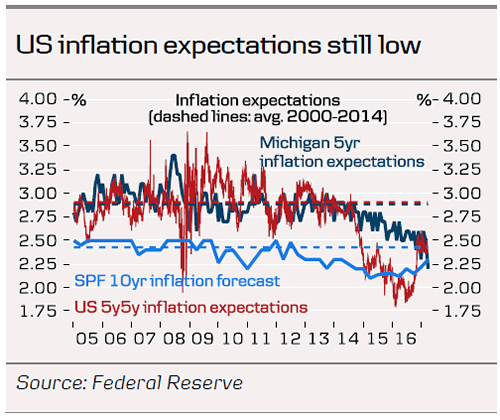
In recent months, headline CPI inflation has moved higher in both the US and Europe supported by the base effects of energy prices adding fuel to the reflation trade. The Brent oil price hit the bottom in January/February 2016 but recovered afterwards. This means the positive contribution to inflation from a higher oil price is fading (especially after the recent oil price fall from around USD55/bl to USD51/bl) unless the oil price moves higher again.
In our checklist for reflation, we mentioned four key factors for reflation, one of them being easy monetary policy (see also Strategy: The case for reflation – what it means and what to watch, 18 November). As we expect CPI inflation in the euro area to fall again to just above 1% in early 2018 and the ECB's core inflation forecast is too optimistic (see also ECB's core inflation forecast is still too optimistic, 14 March), we stick to our long-held view that the ECB will extend its QE purchases beyond December 2017. Although the Fed, as expected, moved on with its hiking cycle by increase the target range by 25bp to 0.75-1.00% last week, Fed Chair Janet Yellen indicated that it would be too early to remove accommodation completely. While the Fed still projects a total of three hikes this year, four hikes would be one too many, as it would make monetary policy neutral instead of accommodative, see FOMC Review: Fed says it is on track, not more hawkish, 15 March. With very low inflation expectations and core inflation still below the 2% target, the Fed has room to stay patient removing accommodation completely, especially as there are still indications of slack in the US labour market. If necessary, the Fed will postpone the next hike to avoid a repetition of what happened from 2014-16, when too-tight US monetary policy contributed to the fall in real GDP growth, commodity prices and inflation expectations.
Trumponomics postponed further
We have become more pessimistic on the outlook for Trumponomics in recent weeks, as we view the 'repealing and replacing' of Obamacare as a proxy for what to expect of Trumponomics. Changes to US economic policy are likely to come later and be smaller than previously expected due to the chaos within the Republican Party. Although replacing Obamacare has been very high on the agenda for both President Trump and the House Speaker Paul Ryan, the process has dragged on and it has begun to look like a crucial blow for the Republicans, as the moderate and more conservative Republicans are fighting each other about how to proceed. The vote in House of Representatives, which was supposed to be held yesterday, has been postponed to later today but may be postponed further if President Trump and House Speaker Paul Ryan do not have enough Republicans on board to win the vote. Even if the healthcare bill passes the House of Representatives, it may be dead on arrival in the Senate where the Republicans have a slimmer majority, see the article 'House Obamacare repeal DOA in the Senate', from POLITICO, 22 March 2017. Due to the political process of passing a new healthcare plan in order to avoid being filibustered by the Democrats in the Senate, the Republicans cannot get going with tax reform before an agreement on healthcare has been reached. The technical explanation is that the healthcare plan is attached to the 2017 budget resolution, while the tax reform will be attached to the 2018 budget resolution and there cannot be two outstanding budget resolutions at the same time. Although we still think the debt limit will be raised or resuspended eventually (see Research US: Debt limit suspension expires tomorrow, 14 March), the chaotic situation within the Republican Party also questions how quickly they can reach a deal here.
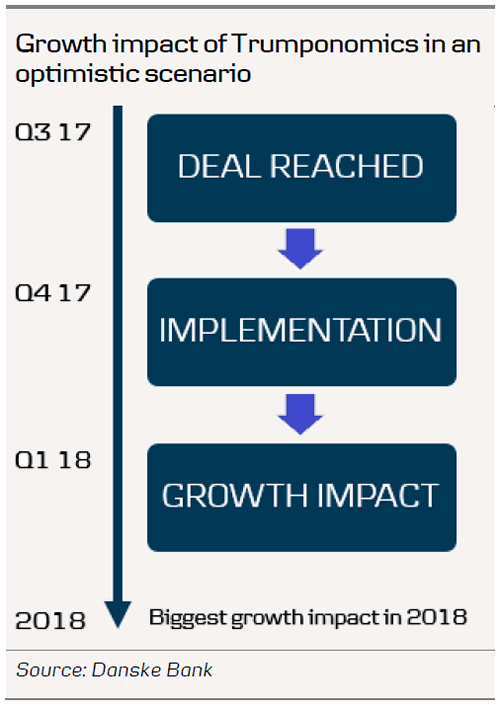
This weekend White House budget director Mick Mulvaney said that Trump's full budget will be released in mid-May, which, in our view, raises questions about whether the Treasury Secretary has enough time to reach a deal on a tax reform before Congress's August recess. We have argued for a long time that it will take time to pass changes to economic policy, meaning that the biggest real growth impact would be in 2018 due to policy lags. With this new information, we think a deal on a tax reform is more likely to be reached in late Q3 17 or even Q4 17, meaning the real growth impact would be in Q2 18 at the earliest, in our view. That said, the Fed has clearly indicated that it wants to offset more expansionary fiscal policy, although it welcomes reforms that increase productivity growth.
North Korea raises US-China tensions
While markets seem less worried about European politics following the Dutch election and the (so far) strong performance by Emmanuel Macron in France, we are about to face the first test between President Trump and China, as the risk of a US military conflict with North Korea is rising. This week North Korea made its third missile launch test this year and, although it failed, North Korea is determined to develop an intercontinental ballistic missile, which would be able to reach the US. Although it is not there yet, it is getting closer. The North Korea issue is just one of many possible confrontations between the US and China and is likely to be a key issue at the meeting between President Trump and Chinese president Xi Jinping scheduled for 8-9 April. With China's softer stance of going to the negotiation table with North Korea and President Trump's increasing impatience, North Korea is another area of conflict bears are following closely (see also Research: North Korea raises US-China tensions, 10 March). The rising tension between the US and China also means we see a risk of a trade war between the two countries (see also Research: Don't rule out a US-China trade war just yet, 21 February).
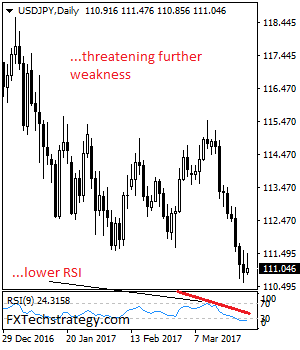
USDJPY – Threatening Further Weakness Short Term
USDJPY - The pair continued to retain its downside pressure with more declines expected. On the downside, support comes in at the 110.50 level where a break if seen will aim at the 110.00 level. A cut through here will turn focus to the 109.50 level and possibly lower towards the 109.00 level. On the upside, resistance resides at the 112.50 level. Further out, we envisage a possible move towards the 113.00 level. Further out, resistance resides at the 113.50 level with a turn above here aiming at the 114.00 level. On the whole, USDJPY looks to weaken further short term.
USD/CAD – Canadian Dollar Ticks Higher, Markets Eye CPI
USD/CAD has inched upwards in the Friday session. Currently, the pair is trading at 1.3360. On the release front, Canada will release CPI, one of the most important economic indicators. CPI was unexpectedly high in January, at 0.9%. The markets are braced for a weak February report, with an estimate of 0.2%. Traders should be prepared for possible volatility from USD/CAD around the release time of this key event.
It could be a politically charged day in Congress, with the focus on health care legislation. President Trump, who campaigned on a promise to repeal the Affordable Care Act (“Obamacare”), wants the House of Representatives to vote on Friday on a bill which repeals and replaces part of Obamacare. A vote on Thursday was shelved, as there was not enough support to pass the bill. The proposed health bill has become a litmus test for the Trump administration, as a failure to pass the bill would indicate that Trump may not be able to push through Congress his pledges to lower taxes and increase fiscal stimulus. The dollar has sustained broad losses in the past week, in part over market frustration over the lack of any details regarding economic policy from Trump. If the President cannot make good on his promise to reform Obamacare, the dollar could continue to lose ground.
The Canadian dollar is sensitive to movement in oil prices, so lower crude prices could weigh on the currency. West Texas crude has dropped 1.0% in March, and dipped to $47.05 earlier this week, its lowest level since the end of November. Crude headed lower after Crude Oil Inventories posted a strong surplus of 5.0 million barrels, crushing the estimate of 1.9 million. The weekly indicator has recorded only two declines in 2017, as US oil drillers continue to enter the market and ratchet up US oil production. This, together with increased US shale production, has more than offset OPEC’s production cuts. On Monday, OPEC announced it was considering extending the production cut agreement by another 6 months, until the end of 2017.
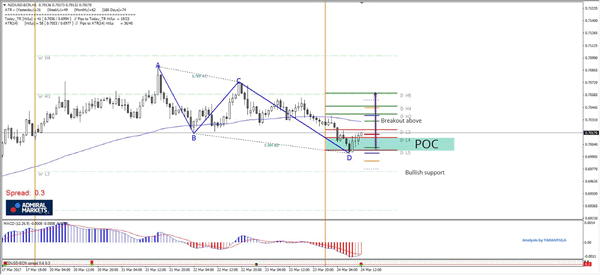
NZD/USD Bullish ABCD Supports Possible Bounce
The NZD/USD currency, popular 'Kiwi' is currently very close to POC zone where it might reject from. The POC (D L5, ABCD bottom, ATR pivot) is supporting longs and the price might spike up to 0.7030 where we see the confluence of EMA89 and ATR pivot. If 0.7030 breaks to the upside target is 0.7060 that corresponds to W H3 camarilla and D H5 target. At this point traders might focus on buying the dips as POC is bull-supportive and W L3 bullish support is just below.
Quick Summary:
W H3 - Weekly H3 Camarilla (Weekly resistance)
D H5 - Daily H5 Camarilla (strongest Daily resistance)
W L3 - Weekly L3 Camarilla (Weekly support)
US Health Care Vote Postponed to Today; Trump Raises the Stakes
After a day filled with news headlines surrounding the highly-anticipated vote in the House of Representatives to repeal and replace Obamacare, Republican lawmakers decided to postpone the vote. It is now set to take place today, during the US afternoon. According to various media reports, the delay was owed to the fact that the Republicans may not have had enough support to pass the bill, and thus decided to buy themselves some extra time in an attempt to secure the necessary votes.
But that was not all. In a shock-and-awe move, at least for us, President Trump raised the stakes by declaring that should the bill get voted down today, he is prepared to leave Obamacare in place and move on to tax reform. The US dollar had been trading sideways for most of Thursday, while the debate was raging. However, it started to gain some ground during the Asian morning Friday, following Trump's announcement that the issue of healthcare will be dealt with today, one way or another. This may be due to the fact that Trump showed his willingness to proceed with his tax plans without waiting for the healthcare approval, sending the message that tax reform is among his top priorities at the moment.
With regards to today's vote, in case the House votes for the bill, we expect the dollar and US equities to come under buying interest, on speculation that the new administration will soon proceed with taxes as well. USD/JPY rebounded on Trump's' announcement after it hit support once again at 110.70 (S1). During the early European morning Friday, the rate is trading slightly below the key obstacle of 111.60 (R1), which acted as the lower bound of a sideways range that contained the price action since early January. A House approval is possible to bring the pair back above that hurdle and signal its return within the aforementioned range.
On the other hand, if the House votes against healthcare reform, it could prove negative for the aforementioned assets. Market participants may begin to doubt whether Trump will be able to deliver the tax numbers he has pledged, considering that repealing the healthcare act is one of the conditions for making that feasible. In case of a negative vote, USD/JPY is possible to come under selling interest again and perhaps aim for another test near the 110.70 (S1) support zone. A decisive dip below that support is possible to aim for the psychological round figure of 110.00 (S2).
As for the rest of today's highlights
During the European day, we get the preliminary manufacturing and services PMIs for March from several European nations and the Eurozone as a whole. Most of these indices are expected to have ticked down, but to still remain elevated, which is likely to be another set of pleasant news for ECB policymakers, who at their latest meeting shifted to a more optimistic tone.
From the US, we get durable goods orders for February. Expectations are for both the headline and the core rates to have risen. The forecasts are supported by the nation's ISM manufacturing PMI for the month, where the New Orders sub-index rose notably, indicating a rising pace of increase in new orders. Rising orders could prove somewhat positive for the dollar, but much of the currency's forthcoming wave will depend on the healthcare vote. We also get the nation's preliminary Markit manufacturing and services PMIs for March.
From Canada, we get CPI figures for February. The core rate is expected to have stayed unchanged, while no forecast is available for the core figure. Our own view is that the core rate may have ticked up, given that the nation's Markit manufacturing PMI survey for February showed that there was a solid increase in the prices of finished products. Although a slight acceleration in core inflation could support CAD at the release, we do not expect it to lead to a material shift in the dovish tone of BoC officials. At the latest meeting, they did not appear particularly worried about inflation, but they did maintain a cautious tone with regards to exports, which continue to face competitiveness challenges as they noted. This was a hint that the strength of the Canadian dollar is muting the outlook for exports and as such, we expect BoC officials to maintain a relatively dovish tone in the foreseeable future, despite any modest progress in economic data.
USD/CAD traded higher yesterday and during Asian morning Friday, it emerged above the 1.3350 (S1) resistance (now turned into support barrier). Now the rate is headed towards the 1.3390 (R1) resistance, where investors may stand and await for the CPI data. A potential acceleration in the core CPI could encourage the bears to take advantage of that resistance and push the pair back below 1.3350 (S1). Something like that could open the way for the 1.3300 (S2) territory.
As for the speakers, we have two on the agenda: New York Fed President William Dudley and St. Louis Fed President James Bullard.
USD/JPY
Support: 110.70 (S1), 110.00 (S2), 108.80 (S3)
Resistance: 111.60 (R1), 111.90 (R2), 112.40 (R3)
USD/CAD
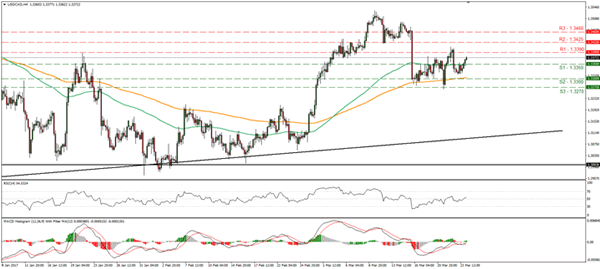
Support: 1.3350 (S1), 1.3300 (S2), 1.3270 (S3)
Resistance: 1.3390 (R1), 1.3425 (R2), 1.3460 (R3)
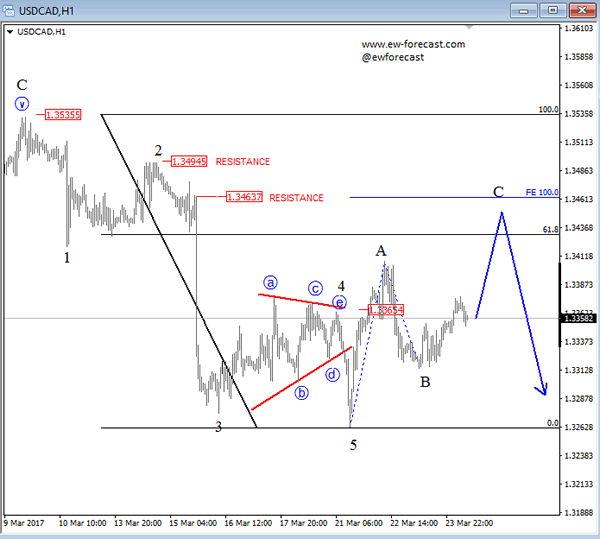
USDCAD Trading In A Temporary Correction, Resistance Seen Around 1.3464/1.3496 Region
On the hourly chart of USDCAD, we see price undergoing a bigger three wave recovery A-B-C. Current intraday strength is part of final wave C, that may extend its gains towards the Fibonacci ratio of 61.8. Resistance may also be seen around the 1.3464/1.3496 region, where previous swing highs may act as turning points lower.
USDCAD, 1H
EUR/USD – Euro Edges Upwards As German And Eurozone Mfg. Reports Sparkle
EUR/USD has pushed above the 1.08 line on Friday, courtesy of strong PMI numbers out of Germany and the Eurozone. In Germany, Flash Manufacturing PMI jumped to 58.3, above the forecast of 56.6 points. Eurozone Flash Manufacturing PMI improved to 56.2, above the estimate of 55.3. Both indicators hit their highest levels since 2011. There was further good news, as Services PMIs in Germany and Europe also pointed to stronger expansion. In the US, today's highlight is Core Durable Goods Orders, which is expected to rebound with a gain of 0.5%, after a decline of 0.2% in the previous reading.
It promises to be busy Friday on Capitol Hill, with the focus on health care legislation. President Trump, who campaigned on a promise to repeal the Affordable Care Act (“Obamacare”), wants the House of Representatives to vote on Friday on a bill which repeals and replaces part of Obamacare. A vote on Thursday was shelved, as there was not enough support to pass the bill. The proposed health bill has become a litmus test for the Trump administration, as a failure to pass the bill would indicate that Trump may not be able to push through Congress his pledges to lower taxes and increase fiscal stimulus. The dollar has sustained broad losses in the past week, in part over market frustration over the lack of any details regarding economic policy from Trump. If the President cannot make good on his assault on Obamacare, the dollar could continue to lose ground.
The economic picture has brightened in the eurozone, as the economy has improved in recent months. The German economy, the largest economy in Europe, remains in solid shape and is expected to expand 1.5% in 2017. However, consumer confidence has not followed suit. GfK German Consumer Climate lost ground for a second straight month, as the GfK indicator fell to 9.8 in March, its lowest level since November 2016. Eurozone Consumer Confidence remains weak, as the indicator posted a decline of -5 in March, almost unchanged. These soft numbers are largely a result of higher inflation, as consumers are concerned about their reduced purchasing power.
DAX Shrugs Off Sharp German, Eurozone Mfg. Data
The DAX Index has ticked lower in the Friday session, but remains above the symbolic 12,000 level. Currently, the DAX is at trading at 12,031.75. On the release front, Germany the Eurozone posted impressive PMI numbers. In Germany, Flash Manufacturing PMI jumped to 58.3, above the forecast of 56.6 points. Eurozone Flash Manufacturing PMI improved to 56.2, above the estimate of 55.3. Both indicators hit their highest levels since 2011. There was further good news, as Services PMIs in Germany and Europe also pointed to stronger expansion.
The economic outlook appears brighter in the eurozone, as the economy has improved in recent months. The German economy, the largest in Europe, remains in solid shape and is expected to expand 1.5% in 2017. However, consumer confidence has not followed suit. GfK German Consumer Climate lost ground for a second straight month, as the GfK indicator fell to 9.8 in March, its lowest level since November 2016. Eurozone Consumer Confidence remains weak, as the indicator posted a decline of -5 in March, almost unchanged. These soft numbers are largely a result of higher inflation, as consumers are concerned about their reduced purchasing power.
It promises to be busy Friday on Capitol Hill, with the focus on health care legislation. President Trump, who campaigned on a promise to repeal the Affordable Care Act (“Obamacare”), wants the House of Representatives to vote on Friday on a bill which repeals and replaces part of Obamacare. A vote on Thursday was shelved, as there was not enough support to pass the bill. The proposed health bill has become a litmus test for the Trump administration, as a failure to pass the bill would indicate that Trump may not be able to push through Congress his pledges to lower taxes and increase fiscal stimulus. The dollar has sustained broad losses in the past week, in part over market frustration over the lack of any details regarding economic policy from Trump. If the President cannot make good on his assault on Obamacare, the dollar could continue to lose ground.
Retail Sales Rebound Sharply In February But Fail To Offset Previous Declines
'Retailers continue to be squeezed by rising cost pressures on the one hand, and intense competition on the other, which will limit their ability to raise prices.' - Anna Leach, CBI
UK retail sales posted the largest drop in almost seven years in the three-month period to February amid higher fuel prices that put pressure on household budgets. Nevertheless, the Office for National Statistics reported on Thursday that British retail sales advanced 1.4% last month, following the preceding month's fall of 0.5% and surpassing analysts' expectations for a 0.4% rise. Despite a stronger-than-expected rebound, in the three months to February sales dropped 1.4%, compared to a 0.5% decline seen in the three-month period to January. That marked the biggest fall since March 2010. On an annual basis, sales were up 3.7%, whereas analysts anticipated a 2.6% increase after a 1.0% gain registered in January. Earlier this week, the ONS reported consumer prices jumped 2.3%, the highest in more than three years, while inflation used for calculation retail sales growth advanced 2.8%, the highest since March 2012. The ONS also noted that higher inflation, mainly driven by the weak Pound, started hurting consumers' pockets. Consumer spending is closely followed by the Bank of England, as it accounts for nearly two-thirds of UK output. On Thursday, one of the largest apparel retailers in Britain Next said it was 'extremely cautious' about prospects for the year ahead after it reported a 4% annual profit decline.