GBP/USD’s strong rebound last week argues that rise from 1.2108 is still in progress. And more importantly, the consolidation pattern from 1.1946 could extend with another rise. Further rise will now be mildly is favor as long as 1.2365 support holds.
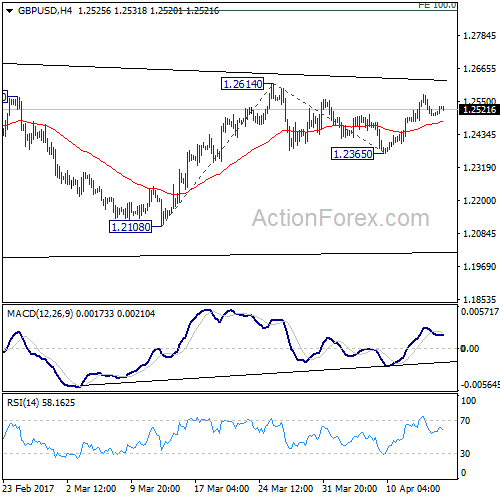
Further rise is expected in GBP/USD this week as long as 1.2365 support holds. Break of 1.2614 will resume rise from 1.2108 and target 100% projection of 1.2108 to 1.2614 from 1.2365 at 1.2871. But overall, price actions from 1.1946 low are viewed as a consolidation pattern. We’d expect strong resistance around 55 week EMA (now at 1.3034) to limit upside and bring down trend resumption. Meanwhile, break of 1.2365 will turn bias back to the downside for 1.2108 support.
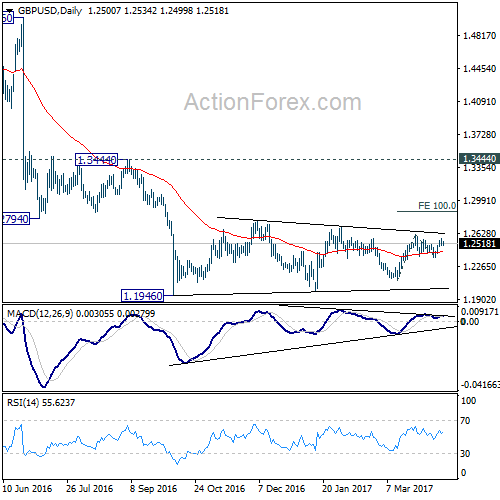
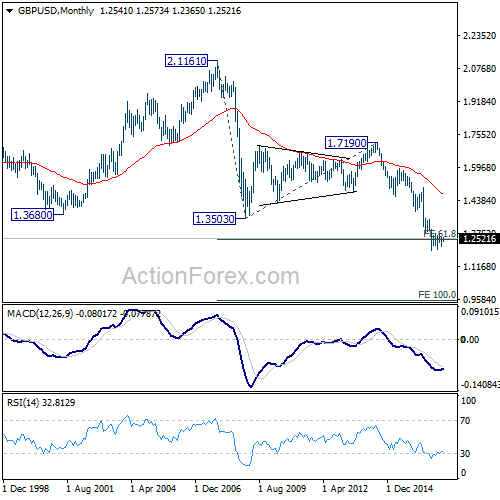
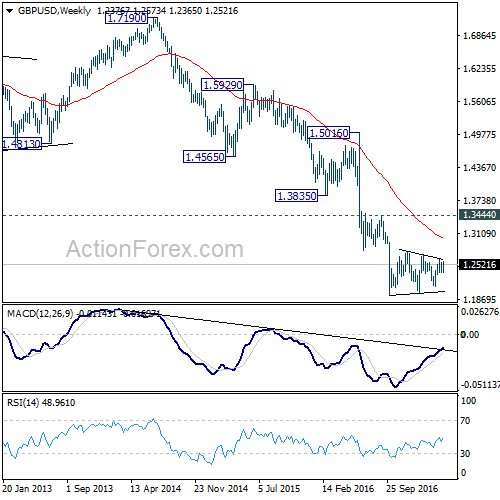
In the bigger picture, fall from 1.7190 is seen as part of the down trend from 2.1161. There is no sign of medium term reversal yet. Sustained trading below 61.8% projection of 2.1161 to 1.3503 from 1.7190 at 1.2457 will target 100% projection at 0.9532. Overall, break of 1.3444 resistance is needed to confirm medium term bottoming. Otherwise, outlook will remain bearish.
In the longer term picture, no change in the view that down trend from 2.1161 is still in progress. Current momentum suggests that the down trend will go deeper than originally expected to 100% projection of 2.1161 to 1.3503 from 1.7190 at 0.9532.