
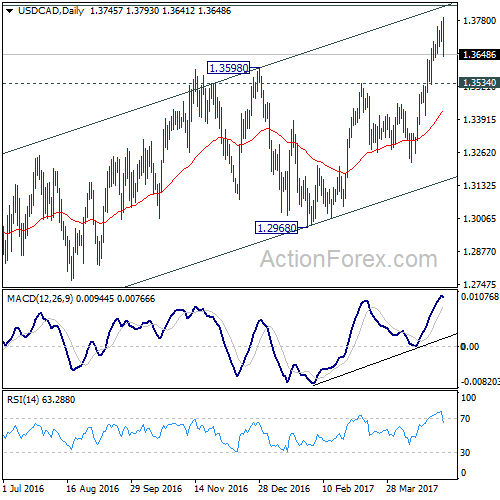
USD/CAD surged to as high as 1.3793 last week but lost momentum ahead of 1.3838 fibonacci level. Choppy rise from 1.2460 is seen as a corrective move. We’d stay cautious on topping at around 1.3838. Focus will also be on 1.3534 resistance turned support. Break there will indicate reversal.
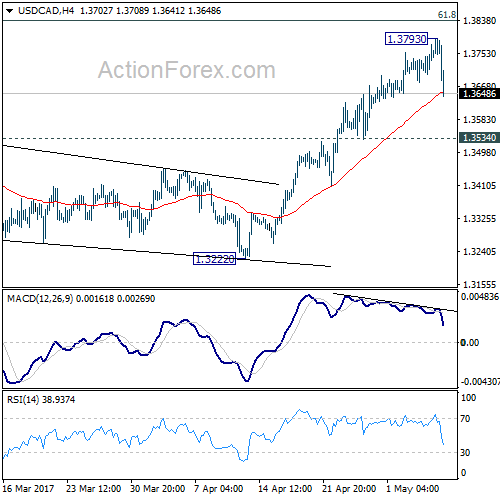
Initial bias in USD/CAD is neutral this week for consolidation first. In case of another rise, we’ll be cautious on topping at around 1.3838 fibonacci level. Meanwhile, consider bearish divergence condition in 4 hour MACD, break of 1.3534 support will argue that rise from 1.2968 is already completed. In such case, intraday bias will be turned back to the downside for 1.3222 support.
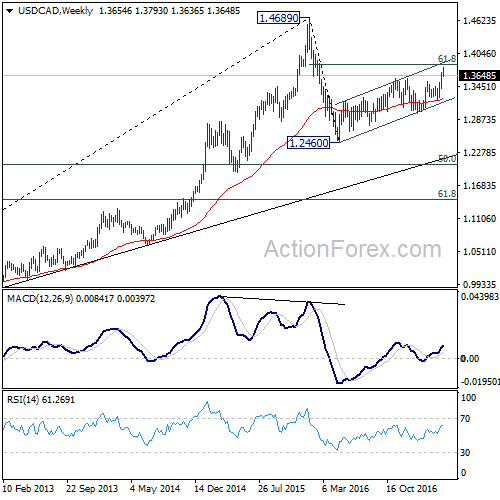
In the bigger picture, price actions from 1.4689 medium term top are seen as a correction pattern. The first leg has completed at 1.2460. Rise from 1.2460 is seen as the second leg and would end at around 61.8% retracement of 1.4689 to 1.2460 at 1.3838. Break of 1.3222 should indicate the start of the third leg while further break of 1.2968 should confirm. Nonetheless, sustained trading above 1.3838 would pave the way to retest 1.4689 high.
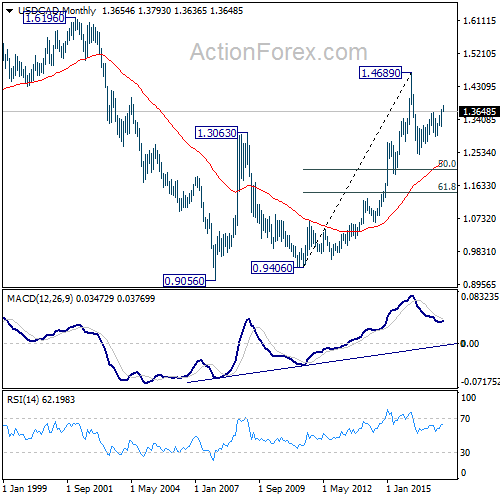
In the longer term picture, rise from 0.9056 (2007 low) is viewed as a long term up trend. It’s taking a breath after hitting 1.4689. But such rise expected to resume later to test 1.6196 down the road.


