
USD/CAD’s rise from 1.2968 extended last week to high as 1.3534. Subsequent pull back and bearish divergence condition suggests that a short term top could be formed ahead of 1.3598 resistance. Some consolidations could be seen first but another rise is expected later to push USD/CAD through 1.3598 to extend the medium term rise from 1.2460.
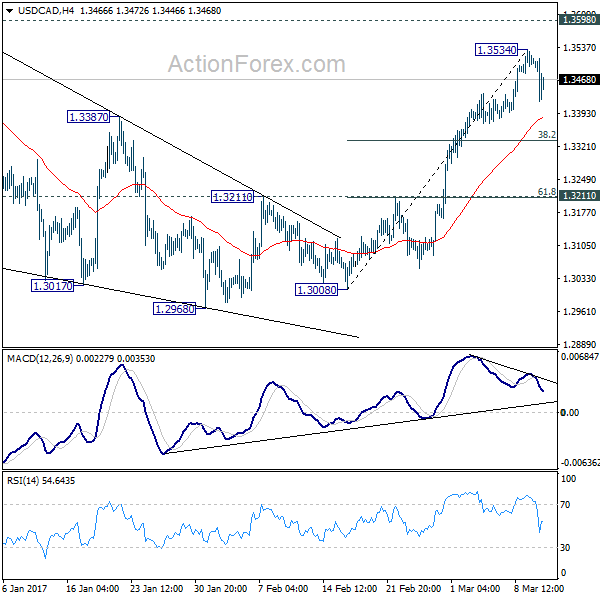
Initial bias is neutral this week for some consolidations first. Downside of pull back should be contained well above 1.3211 cluster support (61.8% retracement of 1.3008 to 1.3534 at 1.3209) and bring rise resumption. Above 1.3534 will turn bias back to the upside for 1.3598 high. Break there will extend the medium term rise from 1.2460 to next fibonacci level at 1.3838.
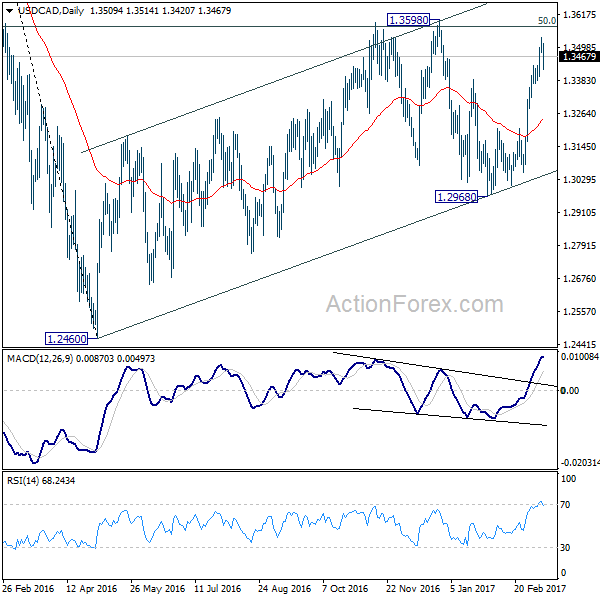
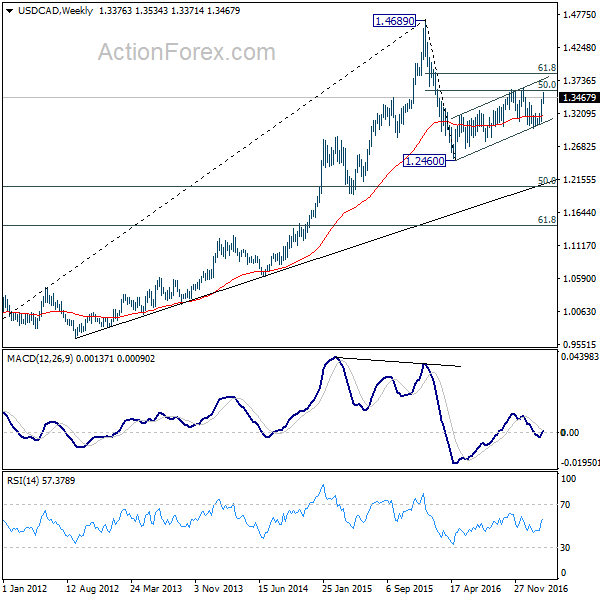
In the bigger picture, price actions from 1.4689 medium term top are seen as a correction pattern. The first leg has completed at 1.2460. The second leg is likely still in progress and could target 61.8% retracement of 1.4689 to 1.2460 at 1.3838. We’d look for reversal signal there to start the third leg. Break of 1.2968 wold at least bring at retest of 1.2460 low. However, sustained trading above 1.3838 would pave the way to retest 1.4689 high.
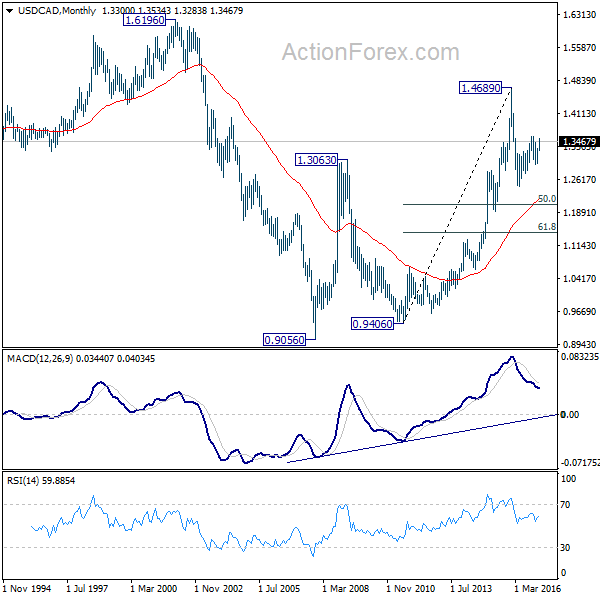
In the longer term picture, rise from 0.9056 (2007 low) is viewed as a long term up trend. It’s taking a breath after hitting 1.4689. But such rise expected to resume later to test 1.6196 down the road.


