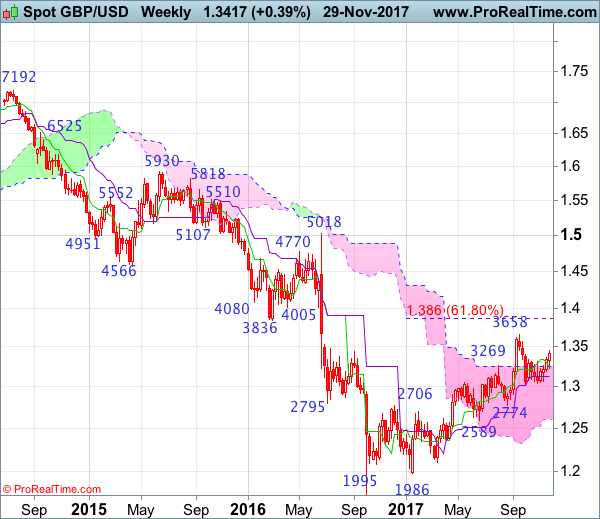
Weekly
• Last Candlesticks pattern: Shooting star
• Time of formation: 31 Jul 2017
• Trend bias: Down
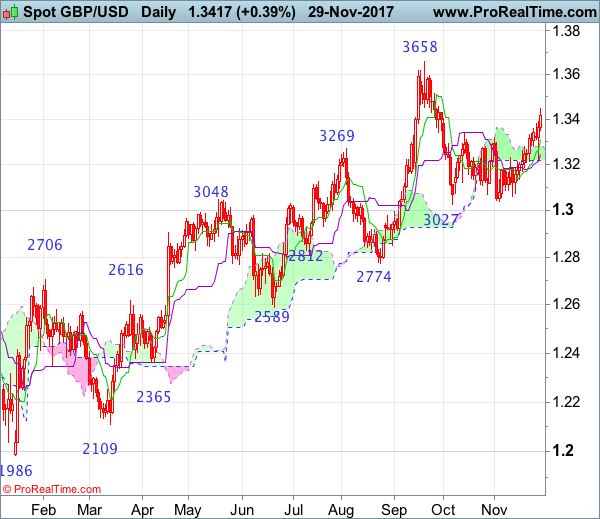
Daily
• Last Candlesticks pattern: Morning star
• Time of formation: 25 Aug 2017
• Trend bias: Near term up
GBP/USD – 1.3308
The British pound only retreated to 1.3221 (we recommended to buy at 1.3200 and missed the long entry) before finding renewed buying interest and the subsequent rally above previous resistance at 1.3338 adds credence to our view that the erratic rise from 1.3027 low is still in progress and upside bias remains for this move to extend gain to 1.3510-15, then 1.3550, however, reckon upside would be limited to resistance at 1.3596 and price should falter below said recent high at 1.3658, risk from there is seen for a retreat due to overbought condition.
On the downside, whilst initial pullback to 1.3400-05 cannot be ruled out, reckon the Tenkan-Sen (now at 1.3333) would limit downside and 1.3300 should hold, bring another rise later. Below said support at 1.3221 would abort and signal top is formed instead, bring weakness to 1.3170, break there would confirm and subsequent fall towards 1.3100 would follow but still reckon support at 1.3062 would contain downside, bring another rebound later.
Recommendation: Buy at 1.3320 for 1.3520 with stop below 1.3220.
On the weekly chart, sterling found decent demand at 1.3221 earlier this week and has surged again, price broke above indicated previous resistance at 1.3338 and another white candlestick looks set to be formed this week, hence bullishness remains for the erratic rise from 1.3027 to extend gain to 1.3500-10, then 1.3550-60 but price should falter below said resistance at 1.3658. In the event sterling breaks above 1.3571 resistance, this would bring a retest of this last month’s high at 1.3658, break there would extend medium term rise from 1.1986 low to 1.3750-60 and 1.3800 but overbought condition should prevent sharp move beyond 1.3860 (61.8% Fibonacci retracement of 1.5018-1.1986).
On the downside, expect pullback to be limited to 1.3400 and 1.3300 should hold, bring another rebound. Below this week’s low at 1.3221 would defer and risk weakness to 1.3160-65, then test of the Kijun-Sen (now at 1.3124) but still reckon support at 1.3062 would hold and bring another rebound. Only a drop below indicated support area at 1.3027-39 would revive near term bearishness and signal a temporary top has been formed at 1.3658 earlier, bring retracement of recent rise to 1.3000, then towards support at 1.2909.