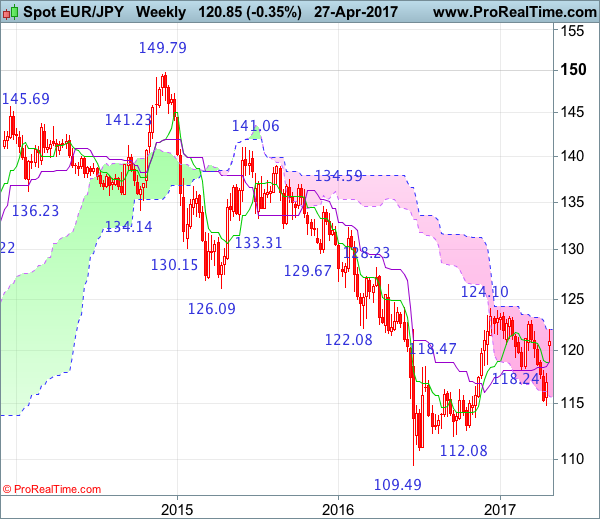
Weekly
• Last Candlesticks pattern: Hammer
• Time of formation: 19 Sep 2016
• Trend bias: Down
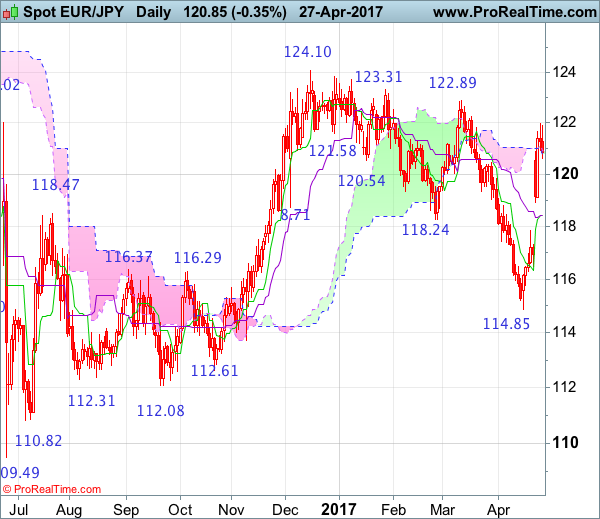
Daily
• Last Candlesticks pattern: Doji
• Time of formation: 28 Mar 2017
• Trend bias: Near term up
EUR/JPY – 117.65
The single currency opened sharply higher this week, a large window was formed on the daily chart, signaling low has been formed at 114.85 earlier this month and upside bias is seen for the rebound from there to extend gain to 122.25-30, however, break of resistance at 122.89 is needed to signal recent decline from 124.10 has ended, bring further gain to 123.31 resistance but price should falter well below said recent high at 124.10 (2016 high). Looking ahead, only a break of 124.10 would retain bullishness and extend early upmove from 109.49 low to 125.25-30 (50% Fibonacci retracement of 141.06-109.49).
On the downside, whilst pullback to 120.00-10 cannot be ruled out, reckon downside would be limited to 119.40-50 and 118.90-95 should hold, bring another rise later to aforesaid upside targets. Below the Kijun-Sen (now at 118.42) would suggest a temporary top is formed instead, bring weakness to 117.82 (previous resistance) but still reckon downside would be limited to 117.30-35 and support at 116.45-50 would hold, bring rebound later.
Recommendation: Stand aside for this week.
On the weekly chart, this week’s gap-up opening signals recent decline from 124.10 top has ended at 114.85 earlier this month and consolidation with upside bias is seen for further gain to 122.00-10, then towards resistance at 122.89, however, a weekly close above there is needed to signal the fall rom 124.10 has ended at 114.85, bring further rise to 123.31, then retest of 124.10. Looking ahead, a break of 124.10 would confirm early rise from 109.49 low has resumed and extend gain to 124.85-90 (38.2% Fibonacci retracement of 149.79-109.49), then 125.25-30 (50% Fibonacci retracement of 141.06-109.49) but reckon upside would be limited to 126.00 and 126.45-50 would hold.
On the downside, although pullback to 120.00-10 cannot be ruled out, reckon downside would be limited to 119.40-50 and bring another rise. Below 118.85-95 would defer and suggest top is possibly formed, risk weakness to 118.00 but downside should be limited to previous resistance at 117.82 and bring rebound later. A weekly close below 117.82 would suggest first leg of rebound from 114.85 has ended, bring weakness to 117.00 but price should stay above 116.20-25, bring another rebound later.