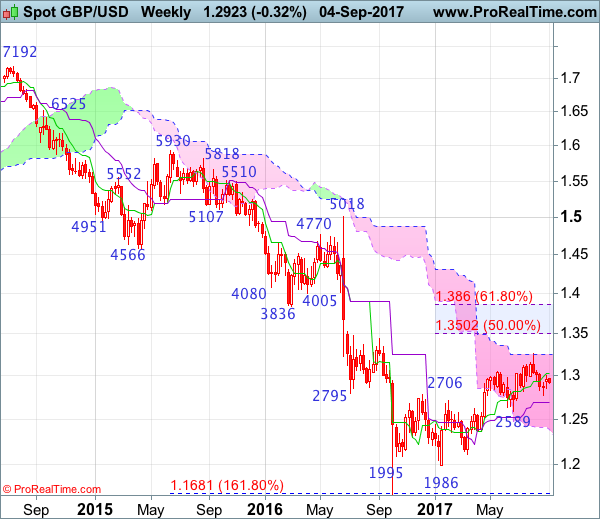
Weekly
• Last Candlesticks pattern: Shooting star
• Time of formation: 31 Jul 2017
• Trend bias: Down
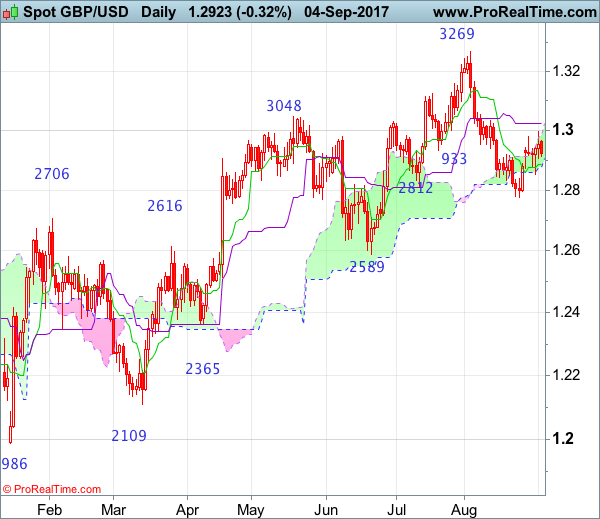
Daily
• Last Candlesticks pattern: Morning star
• Time of formation: 25 Aug 2017
• Trend bias: Near term up
GBP/USD – 1.2933
As cable found renewed buying interest at 1.2852 and has rebounded, retaining our near term bullishness (we recommended in our previous update to buy sterling at 1.2875 and a long position was entered) and consolidation with mild upside bias is seen for the corrective rise from 1.2774 low to bring retracement of the fall from 1.3269 to the Kijun-Sen (now at 1.3022, confluence point of 50% Fibonacci retracement of 1.3269-1.2774), however, upside should be limited to 1.3032 resistance and reckon 1.3080 (61.8% Fibonacci retracement) would hold, bring retreat later.
On the downside, below 1.2900 would risk another test of said support at 1.2852 but only break there would shift risk to downside and signal the rebound from 1.2774 has ended, bring weakness to 1.2800-10, then retest of said support at 1.2774. Looking ahead, cable needs to penetrate this support at 1.2774 to confirm early fall from 1.3269 top has resumed and extend weakness to 1.2700-10, then towards 1.2665-70, however, reckon downside would be limited to 1.2625-30 (50% Fibonacci retracement of 1.1986-1.3269) and support at 1.2603 should remain intact.
Recommendation: Hold long entered at 1.2875 for 1.3020 with stop below 1.2900.
On the weekly chart, as the British pound has rebounded again after finding support at 1.2852 last week, retaining our view that further consolidation above 1.2774 would be seen with mild upside bias for giant 1.2996-00, break there would bring a stronger rebound to 1.3030-35 and possibly towards 1.3080 (61.8% Fibonacci retracement of 1.3269-1.2774), however, still reckon upside would be limited and price should falter below 1.3165-70, bring another decline later, above there would bring a retest of 1.3269 but only break there would shift risk back to upside and extend early erratic rise from 1.1986 low to 1.3330-40 and later towards 1.3400-10.
On the downside, expect pullback to be limited to 1.2900-05 and said support at 1.2852 should hold, bring another rebound later. Below 1.2852 would signal the rebound from 1.2774 has ended and bring weakness to 1.2800, break there would indicate the fall from 1.3269 top is still in progress and bring of 1.2774 would extend the decline for retracement of recent upmove to the Kijun-Sen (now at 1.2689), however, reckon downside would be limited to previous support at 1.2589 and bring rebound later. Looking ahead, only a sustained breach below 1.2589 would signal the entire correction from 1.1986 has ended at 1.3269, bring further decline to 1.2500, then towards support at 1.2365.