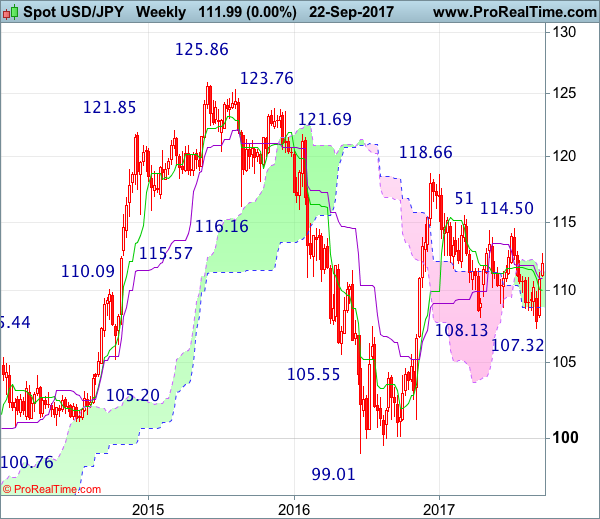
Weekly
• Last Candlesticks pattern: Dark cloud cover
• Time of formation: 10 Jul 2017
• Trend bias: Down
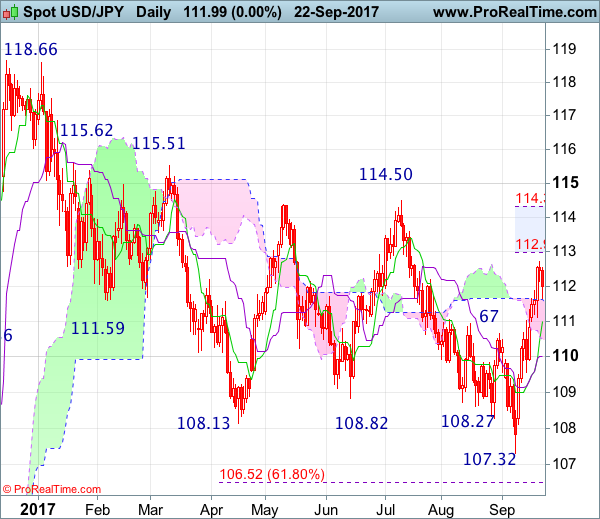
Daily
• Last Candlesticks pattern: Evening doji
• Time of formation: 7 Aug 2017
• Trend bias: Down
USD/JPY – 112.23
As the greenback has surged again after brief pullback to 111.11, adding credence to our bullish view that the rise from 107.32 low is still in progress for retracement of recent entire decline from 118.66 to 112.99-00 (50% Fibonacci retracement), then towards 113.50-60, however, loss of upward momentum should prevent sharp move beyond 114.30-35 (61.8% Fibonacci retracement) and resistance at 114.50 would hold from here, price should falter well below 115.00.
On the downside, whilst initial pullback to 111.65 cannot be ruled out, reckon said support at 111.11 would limit downside and bring another rise later to aforesaid upside targets. A daily close below the Tenkan-Sen (now at 111.01) would defer and suggest top is possibly formed, bring test of the lower Kumo (now at 110.50) and then towards the Kijun-Sen (now at 110.02) but it is necessary to see a break below support at 109.55 to indicate the rebound from 107.32 low has indeed ended.
Recommendation : Buy at 111.15 for 113.15 with stop below 110.15
On the weekly chart, the greenback extended the rebound from 107.32 to 112.72 last week, adding credence to our view that a temporary low has been made at 107.32, hence consolidation with mild upside bias remains for further gain to 112.99-00 (50% Fibonacci retracement of 118.66-107.32), however, break there is needed to retain bullishness and signal recent entire decline from 118.66 has ended, bring stronger rebound to 113.50-60, then towards 114.30-35 (61.8% Fibonacci retracement) but resistance at 114.50 should hold from here, price should falter well below psychological level at 115.00 and bring retreat later.
On the downside, although initial pullback to the upper Kumo (now at 111.36) cannot be ruled out, reckon support at 111.11 would limit downside and bring another rise later. A drop below 111.11 support would risk test of the Tenkan-Sen (now at 110.02) but a weekly close below there is needed to suggest top is possibly formed instead, bring further fall to support at 109.55, a drop below this level would signal the rebound from 107.32 has ended, then weakness to 109.00 and possibly towards support at 108.12 would follow.