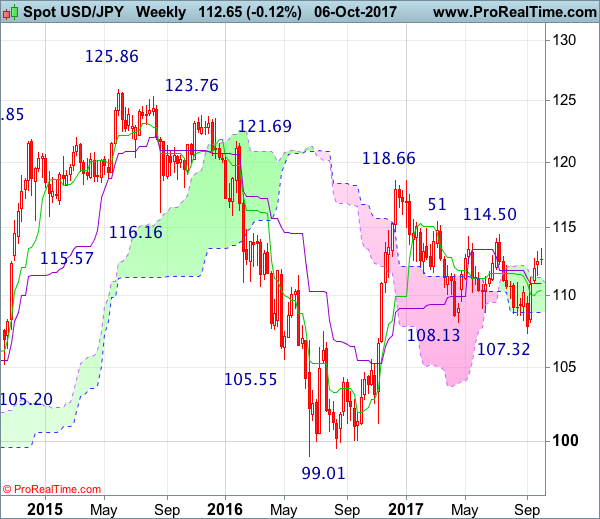
Weekly
• Last Candlesticks pattern: Dark cloud cover
• Time of formation: 10 Jul 2017
• Trend bias: Down
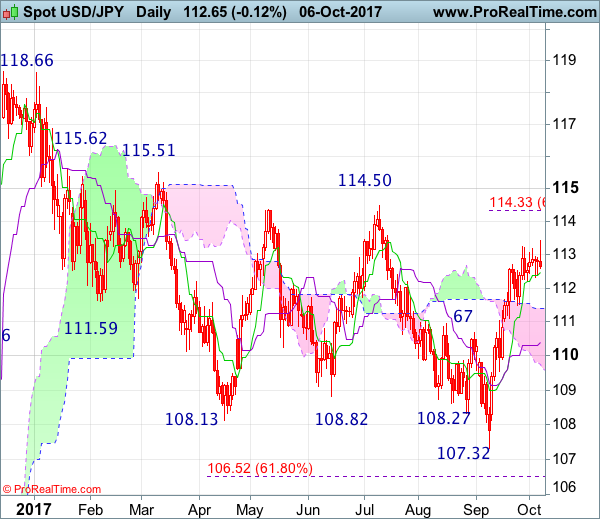
Daily
• Last Candlesticks pattern: Evening doji
• Time of formation: 7 Aug 2017
• Trend bias: Down
USD/JPY – 112.65
Although the greenback edged higher to 113.44 late last week, the subsequent retreat on Friday suggests consolidation below this level would be seen and test of support at 112.32 cannot be ruled out, however, break of 112.21 is needed to signal a temporary top has been formed, bring retracement of recent rise to another previous support at 111.47 and later towards 111.10-15, having said that, reckon downside would be limited and the Kijun-Sen (now at 110.38) should hold and bring rebound later.
On the upside, expect recovery to be limited to 113.10-15 and bring another retreat, above said resistance at 113.44 (last week’s high) would signal the rise from 107.32 low is still in progress for retracement of recent entire decline from 118.66, then gain to 114.00 and possibly towards 114.30-35 (61.8% Fibonacci retracement of 118.66-107.32) would follow, however, loss of upward momentum should prevent sharp move beyond resistance at 114.50 and price should falter well below 115.00.
Recommendation : Sell at 113.10 for 111.10 with stop above 114.10
On the weekly chart, the greenback moved higher again to 113.44 last week, however, the retreat on Friday formed a doji star with a relatively long upper shadow, suggesting consolidation below this level would be seen and if this week ends with a long black candlestick, this would signal a potential reversal pattern is formed, then weakness to support at 111.47 cannot be ruled out, however, only a weekly close below the Kijun-Sen (now at 110.91) would add credence to this view, bring retracement of recent rise from 107.32 to the Tenkan-Sen (now at 110.38) and then 109.90-95 which is likely to hold from here.
On the upside, whilst recovery to 113.10-15 cannot be ruled out, last week’s high at 113.44 should hold, bring another retreat later. Above said resistance at 113.44 would extend the aforesaid rise from 107.32 to 114.00, then 114.30-35 (61.8% Fibonacci retracement) but resistance at 114.50 should limit upside and psychological level at 115.00 should hold from here, bring retreat later.