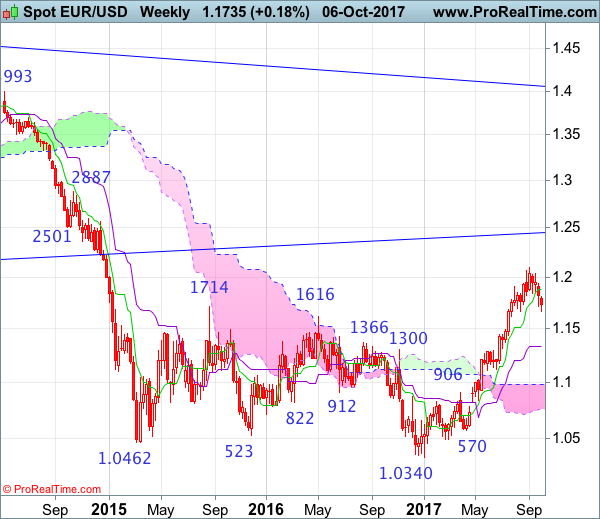
Weekly
• Last Candlesticks pattern: Shooting star
• Time of formation: 31 Jul 2017
• Trend bias: Near term up
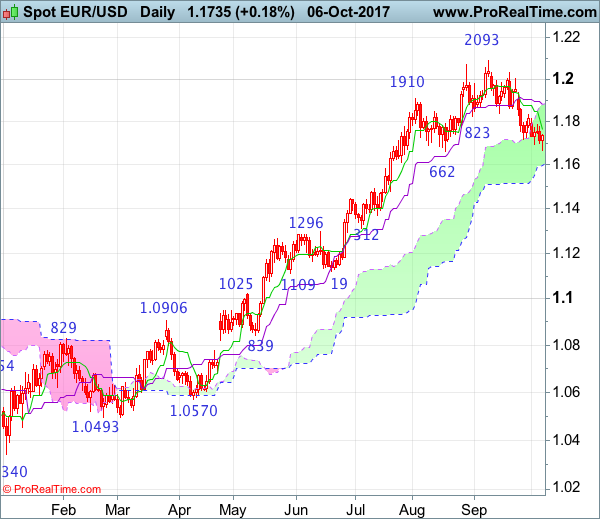
Daily
• Last Candlesticks pattern: Shooting star
• Time of formation: 2 Aug 2017
• Trend bias: Up
EUR/USD – 1.1735
Although the single currency recovered after Friday’s brief fall to 1.1669 and consolidation above this level would be seen and test of the Tenkan-Sen (now at 1.1766) cannot be ruled out, however, a daily close above resistance at 1.1788 is needed to signal low is formed at 1.1669, bring test of 1.1833 resistance, a sustained breach above there would provide confirmation, then a stronger rebound to the Kijun-Sen (now at 1.1881) would follow but reckon upside would be limited to 1.1935-40 and price should falter below resistance at 1.2005, bring another retreat later.
On the downside, below said support at 1.1662-69 would signal the corrective decline from 1.2093 top is still in progress for retracement of recent upmove, hence weakness to the lower Kumo (now at 1.1599) would follow but a sustained breach below there is needed to retain bearishness, bring further fall to 1.1550, then towards 1.1500, having said that, previous support at 1.1479 should limit downside and 1.1466 (50% Fibonacci retracement of 1.0839-1.2093) should hold on first testing.
Recommendation: Buy at 1.1620 for 1.1820 with stop below 1.1520.
On the weekly chart, as euro has recovered after falling to 1.1669 late last week, suggesting consolidation would be seen and recovery to 1.1800 cannot be ruled out, however, reckon upside would be limited to the Tenkan-Sen (now at 1.1878) and resistance at 1.1937 should hold, bring another retreat later, below said support at 1.1669 would signal the retreat from 1.2093 top is still in progress for retracement of recent rise to 1.1610-15 (38.2% Fibonacci retracement of 1.0839-1.2093) where renewed buying interest should emerge and 1.1550 should hold, bring another upmove later. Below 1.1510-20 would defer and risk correction to 1.1460-70 (50% Fibonacci retracement), however, downside should be limited to 1.1400 and the Kijun-Sen (now at 1.1332) should hold.
On the upside, a weekly close above the Tenkan-Sen (now at 1.1878) would risk test of 1.1937 but still reckon resistance area at 1.2005-35 would remain intact, bring another retreat later. Above said resistance area would signal the pullback from 1.2093 has ended, bring retest of 1.2093, break there would extend recent rise from 1.0340 low to 1.2160-70 (50% Fibonacci retracement of 1.3993-1.0340) but loss of upward momentum should limit upside to 1.2220-30 and reckon 1.2300-10 would hold from here, price should falter well below 1.2390-00, bring another retreat later.