Weekly
• Last Candlesticks pattern: Shooting star
• Time of formation: 31 Jul 2017
• Trend bias: Down
Daily
• Last Candlesticks pattern: Morning star
• Time of formation: 25 Aug 2017
• Trend bias: Near term up
GBP/USD – 1.3142
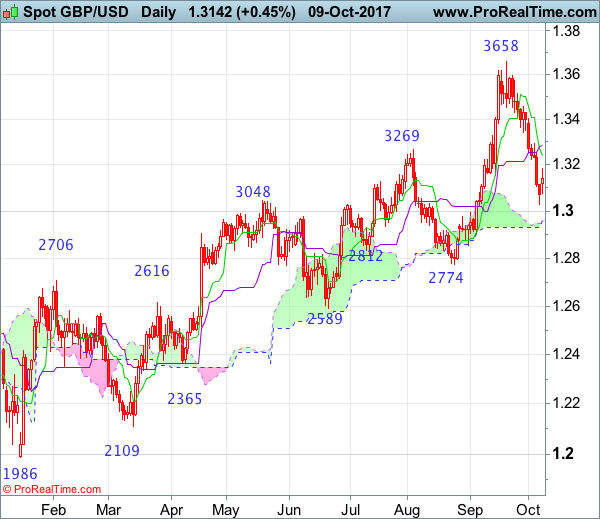
Cable’s stronger-than-expected retreat from 1.3658 (last month’s high) suggests recent upmove has possibly formed a temporary top there and consolidation with mild downside bias is seen for test of the Ichimoku cloud (now at 1.2953-62), however, a daily close below this level is needed to add credence to this view, bring retracement of recent upmove to 1.2774 support, having said that, near term oversold condition should limit downside to 1.2700 and price should stay well above support at 1.2589.
On the upside, whilst initial recovery to the Tenkan-Sen (now at 1.3241) cannot be ruled out, reckon the Kijun-Sen (now at 1.3284) would limit upside and bring another decline later. A daily close above the Kijun-Sen would defer and risk a stronger recovery to 1.3365-70, however, if our view that a temporary top has been formed at 1.3658 is correct, upside should be limited and resistance at 1.3455 should remain intact, bring another leg of corrective decline later.
Recommendation: Sell at 1.3235 for 1.3035 with stop above 1.3335.
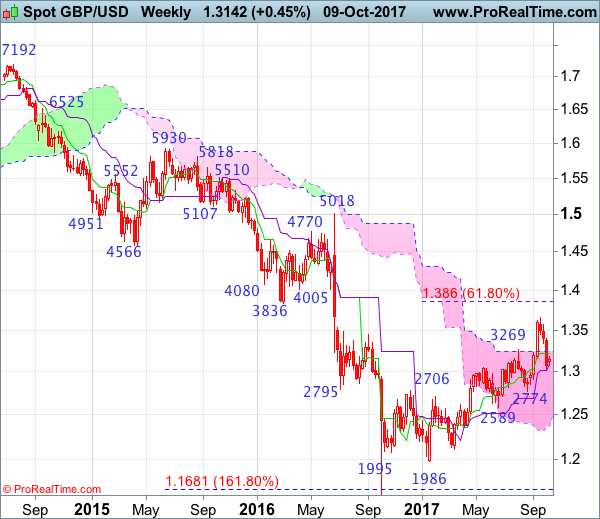
On the weekly chart, last week’s selloff formed a long black candlestick (third one in a row), suggesting a temporary top has possibly been formed earlier at 1.3658 last month, hence consolidation with downside bias is seen, below last week’s low at 1.3027 would add credence to this view, bring retracement of recent upmove to 1.3000, then towards support at 1.2909, however, near term oversold condition should prevent sharp fall below previous chart support at 1.2774 and price should stay well above another previous chart support at 1.2589, bring rebound later.
On the upside, expect recovery to be limited to the Tenkan-Sen (now at 1.3216) and renewed selling interest should emerge around the upper Kumo (now at 1.3247), bring another decline later. Above previous support at 1.3343 would risk test of resistance at 1.3403 but still reckon upside would be limited to 1.3505-10 and bring another leg of corrective decline later. Only break of 1.3571 resistance would signal the pullback from 1.3658 has ended instead, risk retest of this last month’s high, break there would extend recent erratic rise from 1.1986 low to 1.3750-60 and 1.3800 but overbought condition should prevent sharp move beyond 1.3860 (61.8% Fibonacci retracement of 1.5018-1.1986).