Weekly
• Last Candlesticks pattern: Long white candlestick
• Time of formation: 10 Jul 2017
• Trend bias: Up
Daily
• Last Candlesticks pattern: Long white candlestick
• Time of formation: 18 Jul 2017
• Trend bias: Up
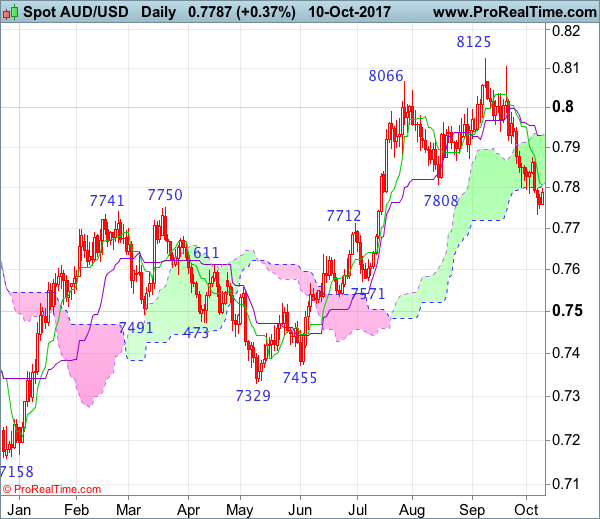
Aussie extended the fall from 0.8125 top in line with our bearish expectation, our short position entered at 0.8060 met downside target at 0.7860 (with 200 points profit), this anticipated selloff adds credence to our view that top has been formed at 0.8125 and downside bias remains for this fall to bring retracement of early upmove to previous resistance at 0.7712, break there would extend weakness to 0.7660-70 and then 0.7620-30 but support at 0.7535-40 should remain intact due to near term oversold condition.
On the upside, whilst initial recovery to 0.7850 cannot be ruled out, reckon resistance at 0.7875 would limit upside and bring another decline later to aforesaid downside targets. Only a daily close above the Kijun-Sen (now at 0.7929) would abort and suggest the fall from 0.8125 has ended instead, bring a strong rebound to 0.7970-75 but still reckon upside would be limited to 0.8000 and price should falter below resistance at 0.8103, bring another decline later.
Recommendation: Short entered at 0.8060 met target at 0.7860 with 200 points profit and would sell again at 0.7880 for 0.7680 with stop above 0.7980
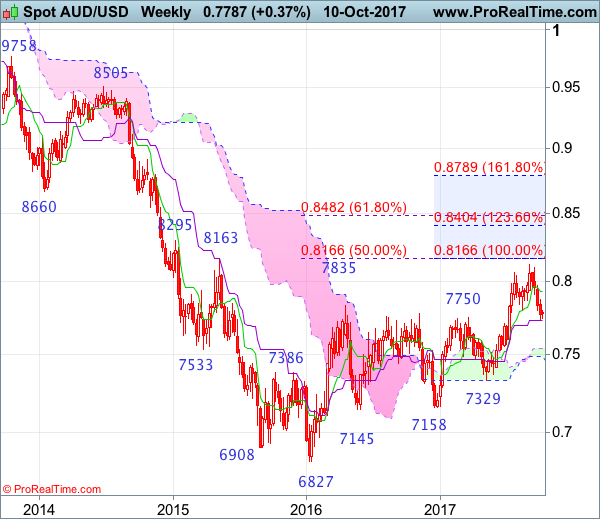
On the weekly chart, last week’s anticipated decline formed another black candlestick (four in a row), adding credence to our view that top has been formed at 0.8125 earlier and consolidation with mild downside bias remains for this move to bring retracement of recent upmove, below 0.7727 (50% Fibonacci retracement of 0.7329-0.8125 as well as current level of the Kijun-Sen) would extend weakness to 0.7675-80 and possibly 0.7630-35 (61.8% Fibonacci retracement) but reckon support at 0.7535 would hold from here.
On the upside, although recovery to 0.7875-80 cannot be ruled out, reckon the Tenkan-Sen (now at 0.7929) would limit upside and bring another decline later. A weekly close above there would defer and risk a stronger rebound to 0.8020-30 but price should falter below resistance at 0.8103 and bring another decline later. A break of 0.8103 resistance would signal the retreat from 0.8125 top has ended instead, bring retest of this level. Looking ahead, only above there would extend the erratic rise from 0.6827 low to previous resistance at 0.8163, then 0.8200 but loss of upward momentum should limit upside to previous resistance at 0.8295.