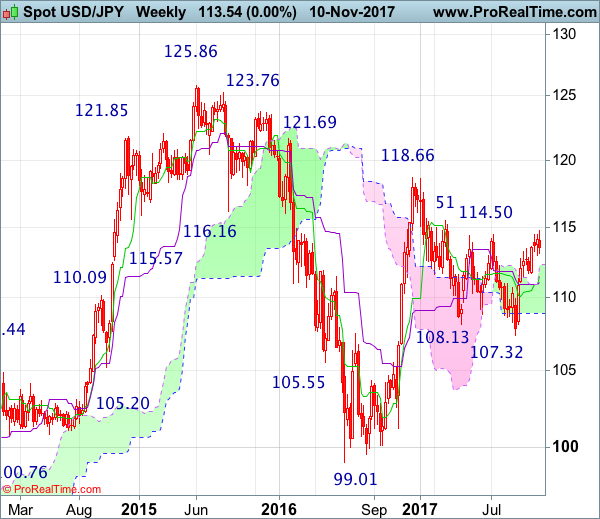
Weekly
• Last Candlesticks pattern: Dark cloud cover
• Time of formation: 10 Jul 2017
• Trend bias: Down
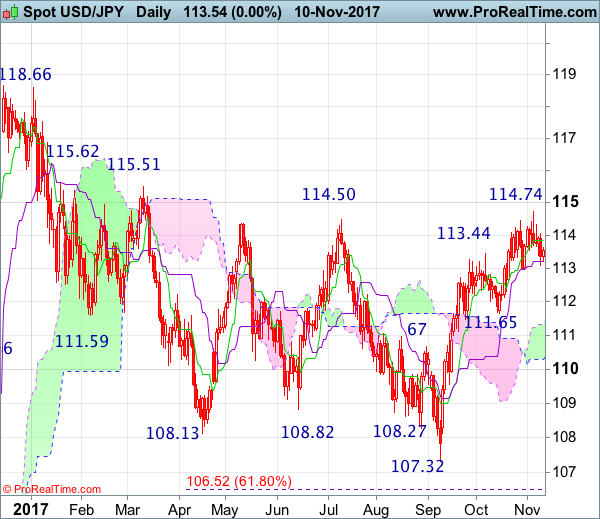
Daily
• Last Candlesticks pattern: Evening doji
• Time of formation: 7 Aug 2017
• Trend bias: Down
USD/JPY – 113.45
Although the greenback retreated after rising to 114.74 last week and consolidation below this level would be seen, reckon support at 112.96 would limit downside and bring rebound later, above 114.05-10 would signal the retreat from 114.74 has ended, bring retest of this level, break there would add credence to the view that the fall from 118.66 has ended and extend the rise from 107.32 to 115.00, then towards previous resistance at 115.51-62, having said that, loss of momentum should prevent sharp move beyond 116.00-10 and reckon 116.50-60 would hold from here, risk from there is seen for another retreat later.
On the downside, whilst initial pullback to 113.30-35 is likely, reckon support at 112.96 would contain downside and bring another rise. Below 112.55-60 would defer and suggest a temporary top has possibly been formed at 114.74, bring retracement of recent rise to 112.00 but previous support at 111.65 should remain intact, bring rebound later.
Recommendation : Hold long entered at 113.40 for 115.40 with stop below 112.40.
On the weekly chart, although the greenback broke above indicated previous resistance at 114.45-50 initially last week, lack of follow through buying and the subsequent retreat suggest consolidation below this level would be seen and pullback towards support at 112.96 cannot be ruled out, however, reckon the Tenkan-Sen (now at 112.87) would limit downside and bring another rise later, above 114.05-10 would bring retest of 114.74 but break there is needed to extend recent rise from 107.32 to 115.51-62 resistance. Once this level is penetrated, this would add credence to our view that early erratic decline from 118.66 has ended at 107.32, then headway to 116.50-60 and possibly 117.00-10 would follow.
On the downside, expect pullback to be limited to said support at 112.96 and bring another rise later. A drop below 112.96 support would defer and suggest a temporary top is possibly formed instead, bring pullback to 112.30, then 112.00, however, previous support at 111.65 should hold. Only a break below this level would signal the rise from 107.32 low has ended, bring deeper correction to the Kijun-Sen (now at 111.03) which is likely to hold from here.