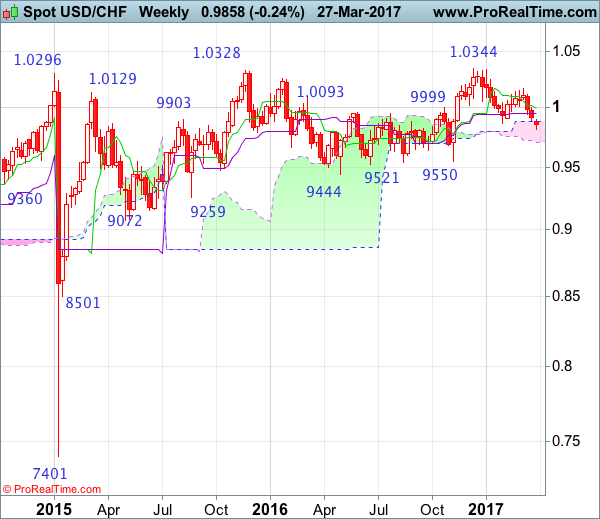
Weekly
• Last Candlesticks pattern: Doji
• Time of formation: 26 Sep 2016
• Trend bias: Sideways
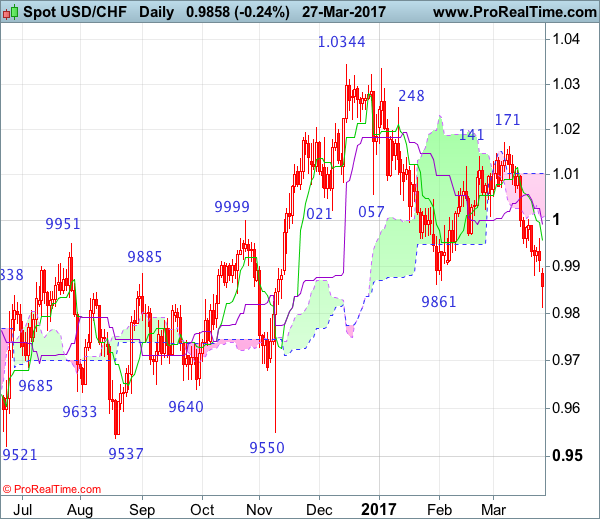
Daily
• Last Candlesticks pattern: Shooting star
• Time of formation: 25 Oct 2016
• Trend bias: Near term up
USD/CHF – 0.9861
The greenback only recovered to 1.0003 early last week (we recommended to sell dollar at 1.0010 and missed our short entry) before renewed selling interest emerging and price dropped again from there to as low as 0.9813 yesterday, the breach of previous support at 0.9861 adds credence to our view that recent erratic decline from 1.0344 top has resumed and downside bias remains for this fall to extend weakness to 0.9735-40 (76.4% retracement of 0.9550-1.0344) and later towards 0.9700 but near term oversold condition should limit downside to 0.9650-60, bring rebound later.
On the upside, whilst initial recovery to 0.9900-10 cannot be ruled out, price should falter below resistance at 0.9960 and bring another decline later. Only break of said resistance at 1.0003 would abort and suggest low is formed instead, risk a stronger rebound to 1.0060 (previous support turned resistance) but still reckon upside would be limited to 1.0109 and price should falter well below resistance at 1.0171, bring another selloff.
Recommendation: Sell at 0.9910 for 0.9710 with stop above 1.0010.
On the weekly chart, the greenback met renewed selling interest at 1.0003 early last week and dropped again, another black candlestick was formed, price finally broke below previous support at 0.9861, adding credence to our view that the fall from 1.0344 top has resumed and bearishness remains for this move to bring retracement of early upmove to 0.9735-40, then towards the lower Kumo (now at 0.9706) but reckon downside would be limited to 0.9640-50 and price should stay well above support at 0.9550.
On the upside, expect recovery to the Kijun-Sen (now at 0.9947) and resistance at 0.9960 should hold, bring another decline. Above the Tenkan-Sen (now at 0.9992) would risk test of said resistance at 1.0003 but a weekly close above there is needed to signal low is formed instead, bring a stronger rebound to 1.0060, having said that, only break of said resistance at 1.0171 would shift risk back to upside and suggest the fall from 1.0344 has ended, bring further gain to key resistance at 1.0248. A sustained breach above this level would signal the retreat from 1.0344 has ended, bring further gain to 1.0335-44 resistance area but break there is needed to signal early upmove has resumed for headway to 1.0400-10 and later 1.0500.