
AUD/USD – 0.7885
Despite staging a brief bounce to 0.7963 last week, lack of follow through buying and the subsequent retreat suggest consolidation below this level would be seen and test of support at 0.7869 cannot be ruled out, however, reckon downside would be limited to 0.7820-25 and support at 0.7808 (last week’s low) should hold, bring further sideways trading. A drop below this support would signal another leg of corrective fall from 0.8066 temporary top is underway, bring retracement of recent upmove to 0.7760 (61.8% Fibonacci retracement of 0.7571-0.8066) and then test of previous resistance at 0.7712 but reckon downside would be limited to 0.7640-50.
We are keeping our count that top has been formed at 1.1081 (wave 5 of V) and major correction (A-B-C-X-A-B-C) has commenced, indicated downside targets at 0.7945 (61.8% Fibonacci retracement of entire rise from 0.6007-1.1081) and 0.7750 had been met and downside bias is seen for further weakness to 0.6800, then 0.6700 but reckon 0.6500 would hold from here.
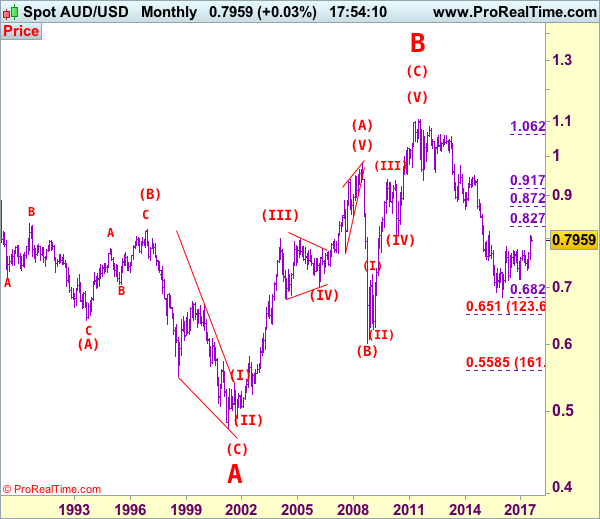
Our preferred count is that the rally from 0.6007 to 0.7270 (7 Jan 2009) is marked as wave A, the retreat to 0.6248 (2 Feb 2009) is wave B and the subsequent upmove is labeled as wave C with wave (iii) and wave (iv) ended at 0.8265 and 0.7700 respectively and wave (v) as well as 3 ended at 0.9407, then wave 4 ended at 0.8066 (instead of 0.8578). The wave 5 has met our indicated projection target of 1.1060 and could ended at 1.1081, this level is now treated as the peak of wave (C) as well as larger degree wave B, hence major fall in wave C has commenced, our initial downside target at psychological support at 0.7000 has just been met and further weakness to 0.6500 would be seen later.
On the upside, expect recovery to be limited to 0.7925-30 and said resistance at 0.7963 should hold, bring further consolidation. A daily close above 0.7963-80 resistance area would signal first leg of corrective decline from 0.8066 top has ended, risk a stronger rebound to 0.8000, however, only a sustained breach above 0.8000 would bring retest of 0.8066, break there to signal medium term erratic rise from 0.6827 (2016 low) has resumed and extend gain to 0.8100, then towards previous resistance at 0.8163.
Recommendation: Stand aside for this week.
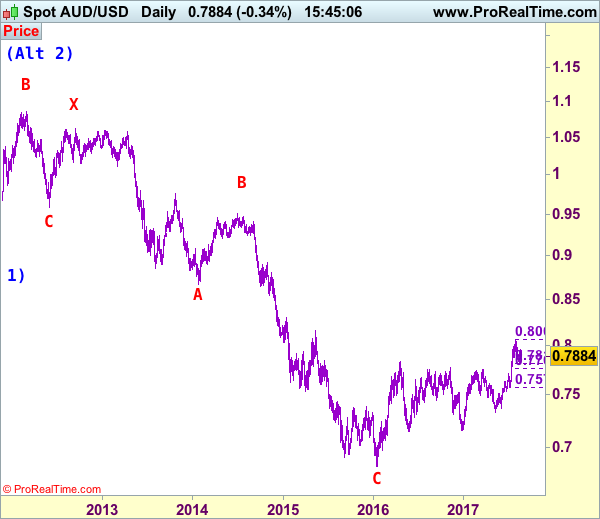
Our alternate count on the daily chart treated the top formed in 2008 at 0.9851 could be a larger degree wave I and was followed by a deep and sharp correction in wave II to 0.6007 and wave III is unfolding from there.
The long-term uptrend started from 0.4775 (2 Apr 2001) with an impulsive structure. Wave I is labeled as 0.4775 to 0.9851 (15 Jul 2008), wave II has ended at 0.6007 (Oct 2008) and wave III is still in progress which may extend further gain to 1.1265.


