EUR/GBP – 0.8829
Last week’s late selloff suggests the reversal from 0.9307 top is still in progress, hence downside bias is seen for this move to extend weakness towards previous support at 0.8743, a daily close below there would add credence to our view that recent upmove has indeed ended at 0.9307, bring further decline to 0.8700, then towards 0.8700-10, however, loss of near term downward momentum should prevent sharp fall below another previous support at 0.8652 and price should stay above 0.8600, bring rebound later.
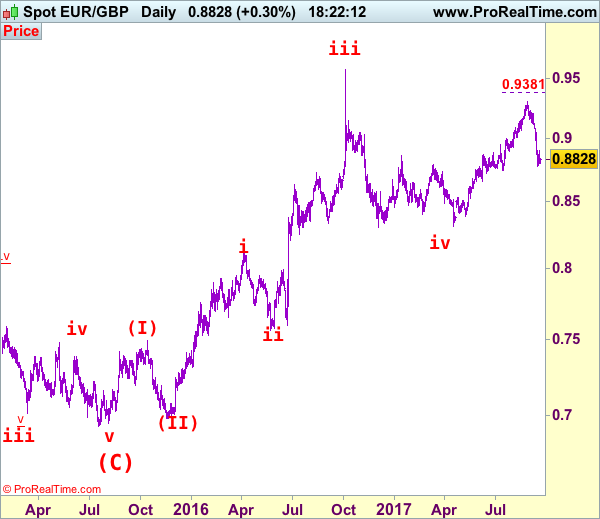
Our latest preferred count is that the wave V of a 5-wave series from 0.5682 ended at 0.9805 earlier and major from there has possibly ended at 0.8067 as A-B-C-X-A-B-C. We are keeping our view that the entire correction from 0.9805 has possibly ended at 0.7756 and as labeled as the attached daily chart and impulsive move from 0.9084 has ended at 0.6938 as a 5-waver which marked as the (C) wave, recent impulsive rise is labeled as (I) (II), (i) (ii) series, indicated upside target at 0.9084 had been met, the retreat from 0.9576 suggest wave iii ended there and next upside target for wave v of (III) should head towards 0.9700 but price should falter well below parity .
On the upside, whilst initial recovery to 0.8890-00 cannot be ruled out, reckon upside would be limited to 0.8950 and price should falter well below 0.9000, bring another decline later to aforesaid downside targets. Only above resistance at 0.9048 would abort and signal the fall from 0.9307 has formed a temporary low, bring a stronger recovery to 0.9100 and then 0.9145-50, having said that, price should falter well below resistance at 0.9203, then the single currency shall head south again from there.
Recommendation: Sell at 0.8950 for 0.8750 with stop above 0.9050
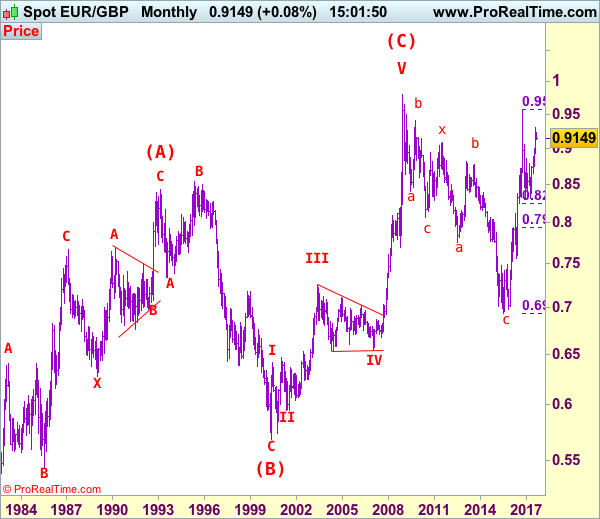
Euro’s long term uptrend started in Feb 1981 at 0.5039 and is unfolding as a (A)-(B)-(C) move with (A): 0.8433 (Feb 1993), (B): 0.5682 (May 2000) and impulsive wave (C) should have ended at 0.9805 with wave III ended at 0.7254 (May 2003), triangle wave IV at 0.6536 (23 Jan 2007) and wave V as well as wave (C) has ended at 0.9805.
We are keeping an alternate count that only wave III ended at 0.9805 and the correction from there is the wave IV and has possibly ended at 0.6936, however, it is necessary to see a daily close above resistance at 0.9576 in order to change this to be the preferred count.