USD/CHF – 0.9754
The greenback met resistance at 0.9837 again and has retreated, retaining our view that further consolidation below this level would be seen and another test of support at 0.9705 (last week’s low) cannot be ruled out, below there would bring retracement of the rise from 0.9421 low to 0.9670, then 0.9642 support, however, reckon downside would be limited to 0.9565 support and bring another rise later. A break of said resistance at 0.9837 would add credence to our view that low has been made at 0.9421 and the rise from there may extend further gain to previous support at 0.9859, then 0.9900, having said that, overbought condition should limit upside and price should falter well below psychological resistance at 1.0000, bring another decline later.
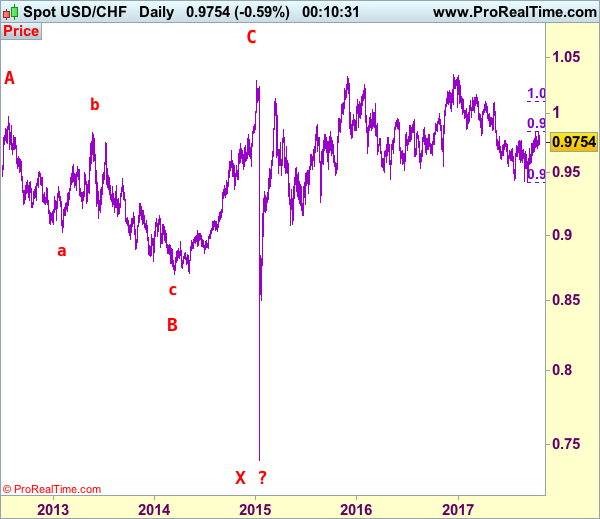
Our preferred count on the daily chart is that early selloff to 0.9630 is an end of the larger degree wave III and major correction is unfolding from there with a leg ended at 1.2298 (Nov 2008 with (a): 1.0625, (b):1.0011 and (c):1.2298), wave b ended at 0.9910 with (a): 1.0370, (b): 1.1967, (c): 0.9910. The rise from there to 1.1730 is the wave c which also marked the end of wave IV and wave V has possibly ended at 0.7068.
On the downside, whilst initial pullback to 0.9705 and 0.9645-50 is likely, reckon downside would be limited to said support at 0.9565 and bring another rise later. Below 0.9525-30 would risk weakness to 0.9490-00 but still reckon downside would be limited to 0.9455-60 and said support at 0.9421 should remain intact, bring another rebound later. A drop below said support at 0.9421 would extend recent decline from 1.0344 top (formed back in late 2016) to 0.9350 and possibly 0.9300, however, loss of downward momentum should prevent sharp fall below 0.9250-60 and 0.9200-10 should hold.
Recommendation: Buy at 0.9575 for 0.9775 with stop below 0.9475.
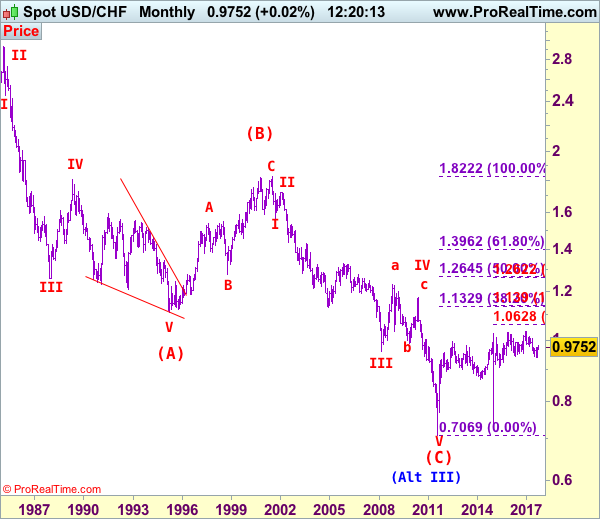
Dollar’s long-term downtrend started from 2.9343 (Feb 1995) and it was unfolding as a (A)-(B)-(C) with (A): 1.1100, (B): 1.8310 (26 Oct 2000), then followed by another impulsive wave (C) with wave III ended at 0.9630 (Mar 2008). Under this count, correction in wave IV has possibly ended at 1.1730 and wave V already broke below support at 0.9630 and met indicated downside target at 0.7500 and 0.7400. The reversal from 0.7068 suggests the wave V has possibly ended and the breach of resistance at 0.9595 add credence to this view and indicated upside target at 1.0000 had been met, however, the sharp retreat from 1.0296 to 0.7401 suggests choppy trading would be seen but price should stay above said record low at 0.7068.