EUR/USD – 1.0677
EUR/USD: Wave (c) of 2 ended at 1.3993 and wave 3 of III has commenced for weakness to 1.0411 (1.236 of wave 1), then 1.0000.
Although the single currency opened higher last week and rose to as high as 1.0906, the subsequent selloff dampened our previous bullish view and suggest top is formed there, hence consolidation with downside bias is seen for test of 1.0600, break there would add credence to this view and suggest the erratic rise from 1.0340 has ended at 1.0906, hence further fall to 1.0525 would be seen but a daily close below support at 1.0493 is needed to provide confirmation, bring further decline to 1.0450-55 first.
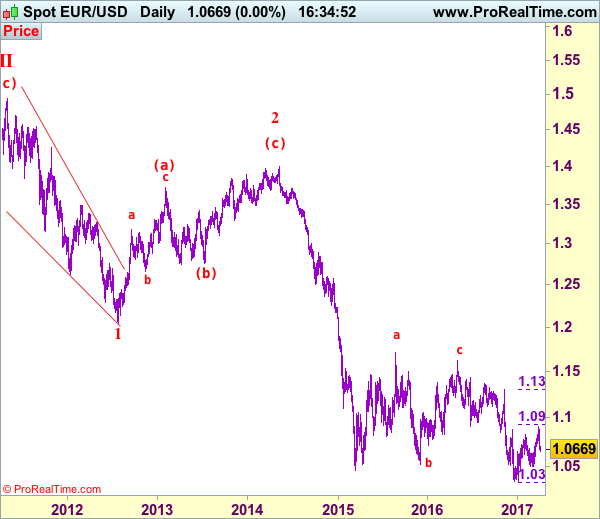
Our preferred count on the daily chart remains that a wave (II) from 1.2329 ended at 1.5145 with A-leg ended at 1.4720, followed by wave B at 1.2457, the wave C from there was also a 3 legged move and is labeled as (a): 1.3739, (b): 1.2885, the wave iii of the 5-waver (c) from 1.2885 has ended at 1.4339 and wave iv is a triangle ended at 1.3878 and wave v formed a top at 1.5145. The decline from there is a 5-waver (C) with minor wave (i) of I of (C) ended at 1.4218 with wave (ii) ended at 1.4580, wave (iii) ended at 1.3267 and wave (iv) ended at 1.3692 and wave (v) ended at 1.1876, this is also the low of wave I of (C) and wave II ended at 1.4940, hence wave III is now in progress with a diagonal wave 1 ended at 1.2042, the breach of previous support at 1.1876 (wave I trough) adds credence to our view that the wave 2 has ended at 1.3993, wave 3 has commenced for further weakness to 1.0411, then towards 1.0000.
On the upside, whilst initial recovery to 1.0700 cannot be ruled out, reckon upside would be limited to 1.0740-50 and bring another decline. Above 1.0800 would defer and risk a stronger rebound to 1.0870-75 but price should falter below said resistance at 1.0906, bring further choppy trading. Only above 1.0906 would revive near term bullishness and extend the erratic rise from 1.0340 low for retracement of early downtrend to 1.0930-35 (61.8% Fibonacci retracement of 1.1300-1.0340), then 1.1000. Having said that, reckon upside would be limited to 1.1065-70 and price should falter below 1.1100, bring retreat later.
Recommendation: Sell at 1.0750 for 1.0550 with stop above 1.0850.
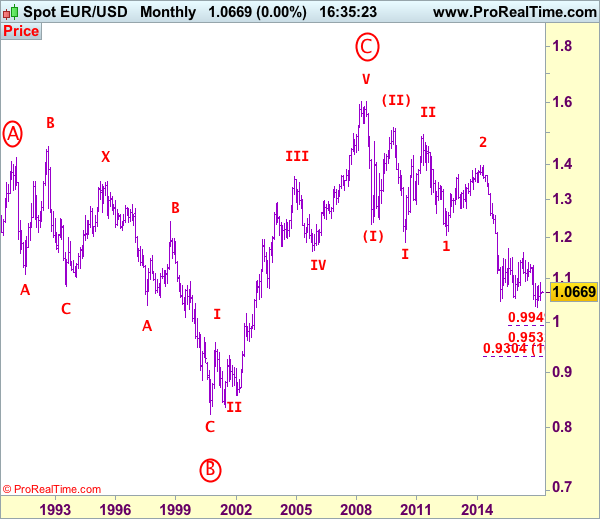
Euro’s long-term uptrend started from 0.8228 (26 Oct 2000) with an impulsive structure. The rise from 0.8228 to 0.9593 (5 Jan 2001) is labeled as wave I, the retreat to 0.8352 (6 Jul 2001) is wave II and the rally to 1.3670 (31 Dec 2004) is wave III. Wave IV from there ended at 1.1640 (15 Nov 2005), the subsequent upmove to 1.6040 (July 15, 2008) is treated as wave V, the major selloff from the record high of 1.6040 to 1.2329 (October 27, 2008) signals a reversal has taken place with (I) leg ended at 1.2329 and once (II) ended at 1.5145, wave (III) itself is an extended move with I: 1.1876 and complex wave II ended at 1.4902, wave III has commenced with wave 1 and 2 ended at 1.2042 and 1.3993 respectively, wave 3 of III is now unfolding for weakness towards parity.