U.S. Review
Housing Sales are Constrained by Inventories
- With a data calendar on the lighter side, current housing market conditions took center stage. Sales were down for both new and existing homes, as activity was constrained by the shortage of homes on the market and under construction.
- We also got the first piece of hard data from the factory sector in July. Headline durable goods orders declined as the volatile component, aircraft orders were down. The underlying details were more positive and showed the manufacturing sector had solid momentum going into the second half of the year.
Data Focuses on Home Sales as Fed Heads to Wyoming
New home sales, existing home sales and durable goods were the highlights of the economic calendar this week. Fresh housing data reiterated that lean inventory is restraining sales activity. Durable goods orders continue to show gradual improvement, though the headline declined as expected due to volatile aircraft orders.
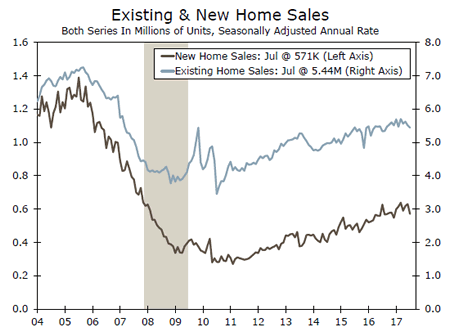
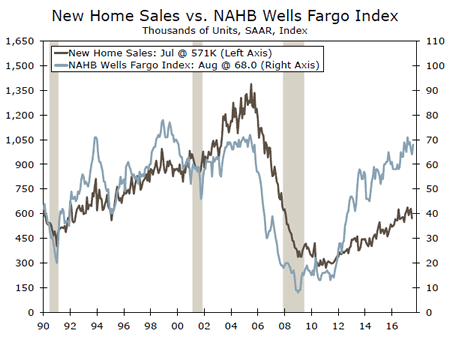
New home sales posted a 9.4 percent monthly drop in July to a 571,000-unit pace, but June’s print was revised up 20,000 units to 630,000. While 9.4 percent in one month is eye-catching, new home sales are notoriously volatile and gains or drops of that magnitude are not unheard of. July’s print was more of a stumble, and the trend in new home sales remains on a steady upward trend. Demand for new homes appears to be improving further, according to our NAHB/Wells Fargo homebuilder survey, which rose solidly in August. July’s stumble in sales alleviated some pressure on inventories, as the months’ supply of homes rose. Most of the increased inventory of new homes for sale were either under construction or not yet started. In addition, sales were up on the month for homes not yet started. This suggests that demand remains strong, and the shortage of existing homes on the market further boosts the need for new home development.
Developers are optimistic about demand for new stock, but available building lots are lacking amid increasingly prohibitive construction costs, which are exacerbated by a shortage of labor. These pressures not only inhibit new home sales, but existing homeowners are reluctant to put their home on the market and risk not finding a trade-up home in their price range.
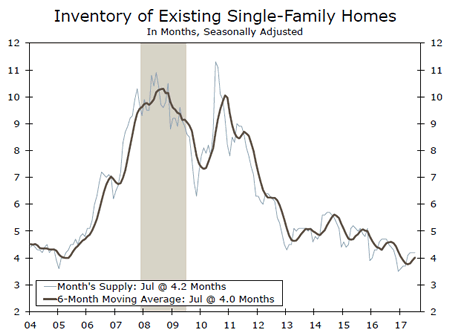
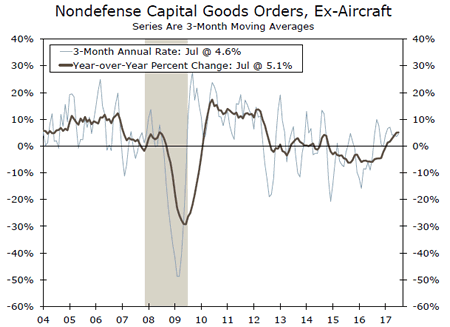
Persistently lean inventories continued to restrain resales in July, with existing home sales registering a slight decline of 1.3 percent to a 5.44 million-unit pace from 5.51 million units in June. The median price of existing homes slipped slightly from its record high in June, while the average price rose to another record. The typical home was on the market for 30 days in July, up from 28 days in June but still marked the fourth month in a row that homes were on the market for less than a month. The solid job market and low mortgage rates support demand, but the dearth of inventory is pushing prices up faster than incomes are rising. Durable goods declined 6.8 percent in July, which we expected as Boeing orders came down to 22 in July, down from 184 in June. The underlying details of the report indicated factory conditions were much better than the headline suggests. Orders for capital goods, excluding aircraft and defense, were up a solid 0.4 percent in July after June’s flat reading. Shipments in the same category, which is a useful gauge for the business investment category in the GDP calculations, rose 1 percent in July. The three-month annualized pace accelerated for orders and shipments of core capital goods, a welcome shift in momentum which bodes well for GDP growth in the second half of the year.
Kicking off the Fed’s annual symposium in Jackson Hole this morning, Janet Yellen spoke about the financial system and gave little hints on monetary policy this year.
U.S. Outlook
Consumer Confidence • Tuesday
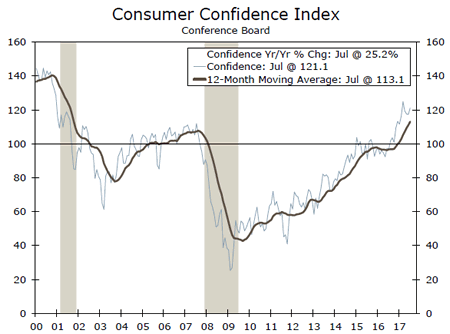
Consumer confidence rebounded to 121.1 in July, its second highest reading in 16 years. Strong assessments of the labor market have helped keep the index riding high since last year’s election. The difference in the share of respondents reporting jobs were "plentiful" versus "hard to get" hit a fresh cycle high last month, as did the share of respondents rating business conditions as "good."
We expect the Consumer Confidence Index gave back some ground in August but remained strong at 118.8. The labor market has been solid with initial jobless claims edging lower over the month, but a pullback in the stock market and recent rise in gasoline prices suggest the index will pare back last month’s gain.
Previous: 121.1 Wells Fargo: 118.8 Consensus: 120.0
Employment • Friday
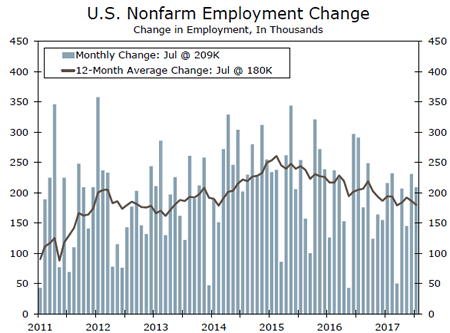
After a slowdown this spring, monthly hiring broke back above 200,000 jobs in June and July. We expect another solid payroll print for August. Initial jobless claims declined in recent weeks, consistent with fewer layoffs. Meanwhile, the most recent readings on job openings and difficulty filling open positions sit at cycle highs. However, the BLS has historically underestimated the initial August print more than any other month. Therefore, we suspect the payroll figures will show a more modest gain in August of 186,000 jobs.
The unemployment rate likely stayed at 4.3 percent following two months of above-trend gains in the household measure of employment.
Previous: 209,000 Wells Fargo: 186,000 Consensus: 180,000
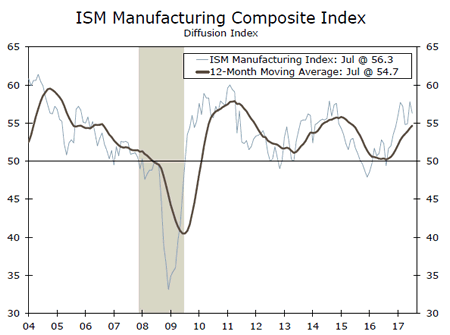
ISM Manufacturing • Friday
The ISM manufacturing report showed growth in the factory sector cooled a bit in July but that activity continued to expand at a solid pace. The index slipped 1.5 points to 56.3, which was still well above last year’s average of 51.5. Strengthening global growth, relatively steady commodity prices and the recent weakening in the dollar have all lent support to the factory sector.
However, with the recovery from last year’s soft patch well established, incremental gains are becoming tougher to come by. We look for the ISM manufacturing index to slip to 56.1 in August, indicating a slightly slower pace of growth in the factory sector.
Previous: 56.3 Wells Fargo: 56.1 Consensus: 56.5
Global Review
Global Economic Growth Steadies Pace
- After several years of below trend growth for the global economy, the signs of a strengthening pace observed earlier this year seems to be giving way to some steadying of the pace of economic growth.
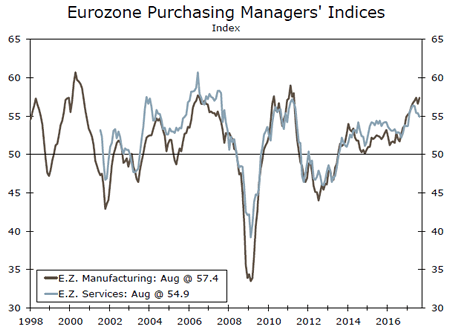
- In Germany, the PMI Markit/BME manufacturing index improved to 59.4 in August versus a 58.1 reading in July, perhaps dispelling some of the market’s concern over whether the slight decline in July was an indication of a slowdown in economic activity.
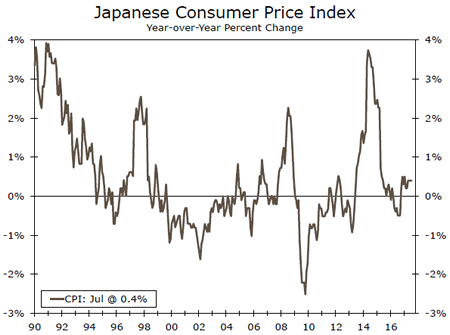
- In Japan, the year-over-year consumer price index increased as expected, up 0.4 percent, the fourth consecutive 0.4 percent year-over-year increase.
Global Economic Growth Steadies Pace
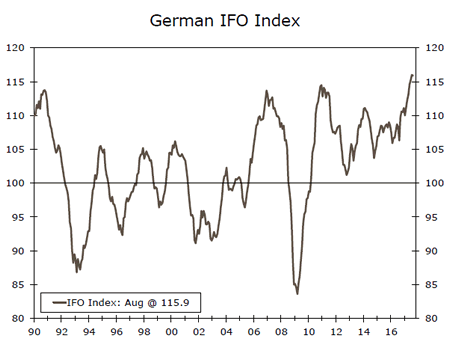
After several years of below trend growth for the global economy the signs of a strengthening pace observed earlier this year seems to be giving way to some steadying of the pace of economic growth. In Germany, the PMI Markit/BME manufacturing index improved to 59.4 in August versus a 58.1 reading in July, perhaps dispelling some of the market’s concerns over whether the slight decline in July was an indication of a slowdown in economic activity. In addition, the 59.4 reading in August was very close to the 59.6 print in June, which was the highest print on record. However, perhaps the most important information we got from this index in August is that economic growth in Germany has steadied since the beginning of this year. The same can be said for the PMI services index, which increased marginally from 53.1 in July to 53.4 in August. Meanwhile, the ZEW current situation index also improved marginally, from an 86.4 reading in July to an 86.7 print in August. However, the expectations index declined more than expected, from 17.5 in July to 10.0 in August. This could also be a sign of a steadying pace of economic growth for the German economy. Meanwhile, the IFO business climate index slowed marginally in August, from 116.0 in July to 115.9. However, the expectations index improved from 107.3 to 107.9 while the current assessment index dropped from 125.5 to 124.6.
The Eurozone Markit manufacturing PMI also moved higher, from 56.6 in July to 57.4 on August, probably reflecting the increase we saw in Germany but also supported by a higher manufacturing PMI in France. Germany and France are the two largest economies of the common market. These results may end the discussion of an approaching slowdown in economic activity in the region. Furthermore, even though the services PMI fell slightly in August, from 55.4 to 54.9, the service sector in the Eurozone is still expanding at a healthy clip. The services PMI hit a series’ high of 56.4 in April of this year.
In Mexico, final numbers for the second quarter of the year showed a resilient, albeit weak, economy with quarter-overquarter growth up 0.6 percent. On a year-earlier basis, however, the economy slowed down to 1.8 percent due to the Easter holiday effect, which fell in the second quarter this year compared to the first quarter last year. Demand-side numbers are not available at this time. However, we are concerned with the pace of consumer demand. Retail sales increased only 0.4 percent in June yearover- year after growing 4.1 percent for the year ending in May. Furthermore, retail sales declined for a second consecutive month on a month-over-month basis, this time by 1.1 percent.
In Japan, the year-over-year consumer price index increased as expected, up 0.4 percent, the fourth consecutive 0.4 percent yearover- year increase. So, even as Japanese economic growth surged in the second quarter of the year, price pressures remain contained, which in normal circumstances would be a good thing, but with the recent history of the Japanese economy, it does not help much. This will keep the Japanese central bank from joining the rest of the central banks in the developed world that have started to tighten monetary policy.
Global Outlook
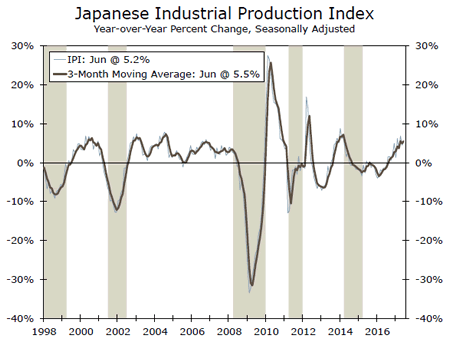
Japanese Industrial Production • Thursday
Real GDP in Japan grew at an annualized rate of 4.0 percent in Q2-2017. It was the sixth consecutive quarter in which Japanese GDP growth was positive on a sequential basis, which represents the longest winning streak in more than a decade.
The usual end-of-the-month Japanese data barrage that is slated for next week will give investors a sense of the current state of the economy in Japan. Data on industrial production (IP) will print on Thursday. The 2.2 percent jump in IP in June means that the Japanese factory sector came into the third quarter with a fair amount of momentum. Although the consensus forecast looks for some pullback in production in July, the upward trend in IP probably remains intact. Other important data releases for July that are on the docket next week include the labor market report, retail sales, and housing starts.
Previous: 2.2% Consensus: -0.3% (Month-over-Month)
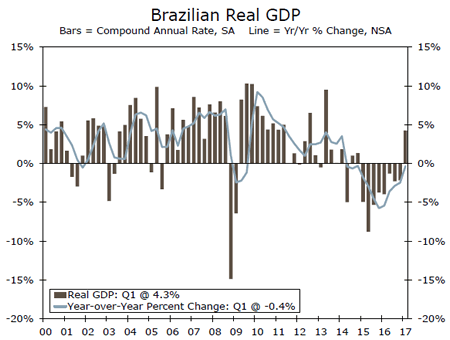
Brazilian GDP • Friday
The Brazilian economy experienced a deep recession in 2015 and 2016 with real GDP nosediving 8 percent over that period. However, the recession came to an abrupt end in Q1-2017 with real GDP growing more than 4 percent at an annualized rate. Although the year-over-year rate of growth remained in negative territory in Q1, we look for it to return to positive territory—we estimate that real GDP rose 0.5 percent on a year-ago basis in Q2.
The GDP release should be the data highlight of the week in Brazil, but one of the many CPI inflation indices will also be released next week. Inflation in Brazil has receded sharply this year due to the generally depressed nature of the Brazilian economy and the stabilization in the value of the currency. This marked decline in inflation has given the central bank scope to slash its main policy rate this year. Most analysts look for further monetary easing in coming quarters.
Previous: -0.4% Wells Fargo: 0.5% Consensus: 0.1% (Year-over-Year)
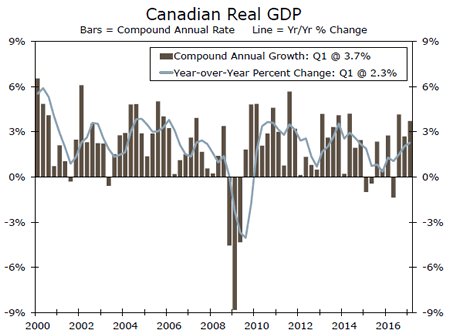
Canadian GDP • Friday
Real GDP in Canada grew at an annualized rate of 3.7 percent in the first quarter, which lifted the year-over-year rate of GDP growth to a 10-quarter high of 2.3 percent. Growth was broad-based in Q1, with real personal consumption expenditures growing in excess of 4 percent and investment spending surging 10.0 percent. Real GDP growth would have been even stronger in Q1 had imports not jumped nearly 14 percent. GDP data for the second quarter will print on Friday. Although we look for some deceleration on a quarterly basis—we forecast that real GDP grew 2.4 percent in Q2— a surge in monthly GDP for May suggests upside risk both for this quarter as well as our published forecast of 2.7 percent for full-year 2017 growth. With the economy showing signs of strength, we look for the Bank of Canada to follow the 25 bps rate hike that it announced last month, with another increase in its main policy rate as early as its October meeting.
Previous: 3.7% Wells Fargo: 2.4% Consensus: 3.6% (Quarter-over-Quarter, annualized)
Point of View
Interest Rate Watch
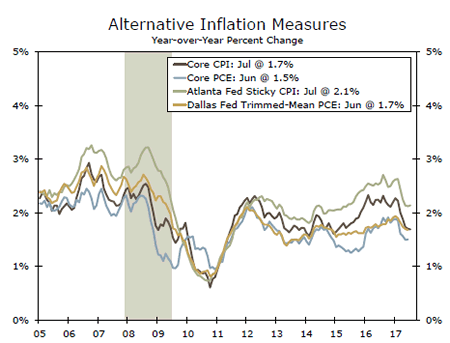
If Unsustainable, It Will Stop
Given the pattern of slower-than-expected inflation, and thereby higher-thananticipated real interest rates, the implied future pattern of the federal funds rate implied in the FOMC’s dot plot is unsustainable.
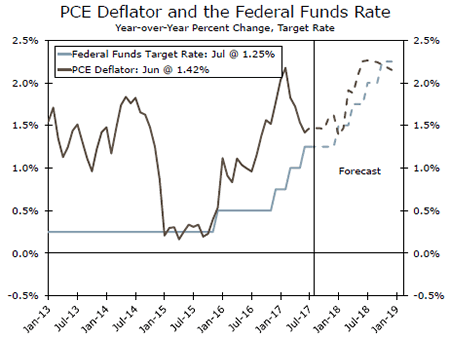
Lower Inflation
As illustrated in the top graph, the upward swing for inflation since early 2015 has broken down and actual inflation, measured by several series, has actually declined since the start of the year.
Therefore Higher Real Rates Ahead?
A rising tension between implied FOMC increases in the nominal funds rate and continued moderate inflation (middle graph) gives rise to higher real rates and increased tighter restraint on the shortterm credit markets.
Over this same period, we anticipate that top-line revenue growth at firms will be limited given the state of global competition and modest gains in nominal GDP. Meanwhile, the lag of productivity gains to offset even the modest rise we have seen in labor compensation dictates a rising unit labor cost pattern that will exert a squeeze on corporate profits.
As illustrated in the middle graph, the balance between the nominal funds rate and the PCE deflator starts 2018 at zero and therefore implies a rise in the real rate of interest and the gap disappears entirely by the end of 2018.
So What Is the Bias on Risk?
From our vantage point, the bias on risk is to the downside on inflation and thereby for higher real short-term interest rates than currently discounted by the FOMC, and possibly the financial markets.
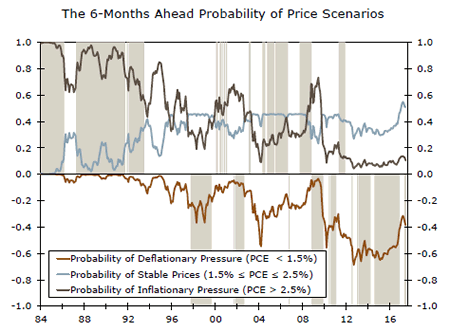
As illustrated in the bottom graph the probability of disinflationary pressure, lower inflation than in the recent past, six months ahead is around 40 percent compared to a rise in the pace of inflation of just about 10 percent. The probability of stable prices comes in at 50 percent. As a result, our view is that the path of the fed funds rate increases implied in the current dot plot pattern is unsustainable and thereby unlikely to come about.
Credit Market Insights
Mortgage Delinquencies Improve Q2
The Mortgage Bankers Association of America (MBA) released second quarter data this week on mortgage delinquencies in the United States. The data showed that on a seasonally adjusted basis total past due mortgages improved to 4.24 percent in the quarter, compared to 4.71 percent in Q1. This quarter’s reading was the lowest level since Q2-2000.
Seriously delinquent mortgages, those past 90 days due, fell 27 bps to 2.49 percent which is a ten-year low. Mortgage loans in foreclosure also improved to 0.26 percent, which is a 6 basis point improvement over the year. The improvement in mortgage delinquencies was broad based in the quarter, as the rates dropped in every delinquency category across all loan types: conventional, Federal Housing Association (FHA), and Veterans Affairs (VA). The FHA and VA mortgages fared particularly well, as the FHA reached 7.94 percent and the VA registered 3.72 percent. Respectively, these are the lowest levels since 1996 and 1979.
The encouraging delinquency statistics this quarter are being pushed by the strong job growth seen in the first half of the year, according to the MBA. Rising home prices and affordability concerns could become cause for reversal of the improving mortgage delinquency figures, however, as slower relative income growth to home prices could slash loan-to-value ratios.
Topic of the Week
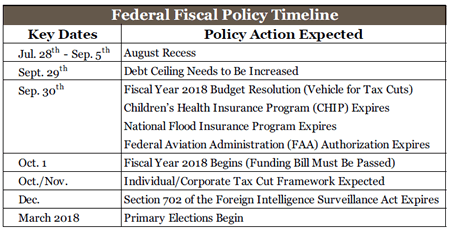
Border Wall Blocking Legislative Progress?
Congress returns from its August recess Tuesday September 5 with a long to-do list of legislative deadlines, including lifting the debt ceiling, funding the government beyond the end of September, reauthorizing a number of federal programs and passing a budget resolution to serve as the vehicle for changes to tax law. Our expectation is that the debt ceiling will be lifted before the projected September 29 deadline with bipartisan support. We have a bit more concern about the path forward on funding the federal government beyond the end of September. The probability of a partial federal government shutdown rose this week with President Trump’s speech at a campaign rally where he stated "if we have to close down our government, we’re building that wall."
While we have increased our probability of a government shutdown to 35 percent, we still think a funding bill will clear Congress before federal funding runs out. The most likely outcome given the very short timeline entails passing a continuing resolution (CR) that funds the government through the first or second week in December. Kicking the can to December will buy more time for a longer-term funding bill to be worked out in the remaining months of the year and allow Congress to turn to the other legislative deadlines it is facing in September. The CR will require at least eight Democrats to join with Republicans to keep the government functioning, making funding for a border wall unlikely. Should the President veto a CR passed by Congress if it does not contain border wall funding, it is unlikely that the bill would have a veto-proof majority and thus a partial federal government shutdown would result. Beyond the optics of a partial government shutdown, such actions could also put at risk the possibility of tax cuts progressing anytime soon.