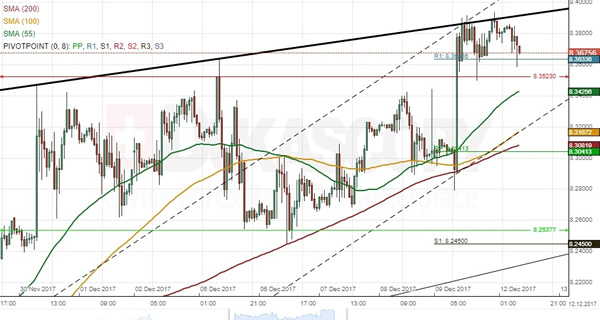
The US Dollar has been appreciating against the Norwegian Krone in a channel up for the last four months. The trading range within this pattern, however, shifted upwards when the rate failed to reach the bottom channel boundary three weeks ago. The same situation occurred last week. As apparent on the chart, the Greenback was trading between 8.2538 and 8.3523 since late November. A massive surge last week breached this range and allowed for a re-test of the upper channel boundary circa 8.39. Technical indicators suggest that the rate might either move lower or remain near 8.38 during the following day. The nearest resistance is the weekly R2 at 8.4225, while support is set by the weekly R1 and the upper trend-line at 1.3634 and 8.3523, respectively. It is likely that the US Dollar starts weakening during the second half of this week, thus approaching the 200– and 100-hour SMAs and the weekly PP circa 8.31.