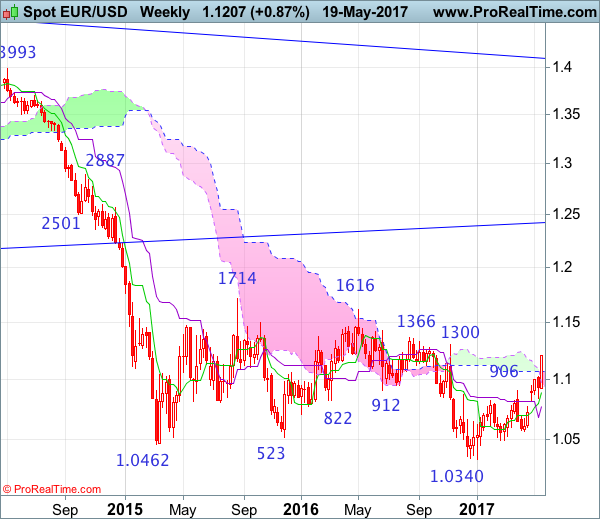
Weekly
• Last Candlesticks pattern: Shooting star
• Time of formation: 03 May 2016
• Trend bias: Down
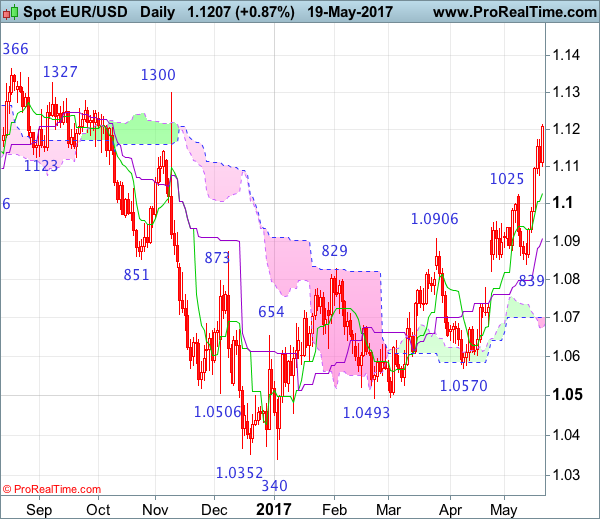
Daily
• Last Candlesticks pattern: Shooting star
• Time of formation: 3 May 2016
• Trend bias: Sideways
EUR/USD – 1.0946
The single currency only retreated to as low as 1.0839 last week before rising again (we recommended to buy euro at 1.0800 last week and missed the entry), the subsequent rally above 1.1025 resistance adds credence to our bullish view that the erratic upmove from 1.0340 low is still in progress, hence further gain to previous resistance at 1.1300 would be seen, however, near term overbought condition should limit upside to 1.1327 and previous chart resistance at 1.1366 should hold from here, risk from there is seen for a retreat later.
On the downside, whilst initial pullback to 1.1150 cannot be ruled out, reckon downside would be limited to support at 1.1076 would risk test of previous resistance at 1.1025 (now support as well as current level of the Tenkan-Sen) but only a daily close below there would suggest top is possibly formed instead, risk weakness to 1.0950-60 but the Kijun-Sen (now at 1.0907) would limit downside and price should stay well above said support at 1.0839.
Recommendation: Buy at 1.1120 for 1.1320 with stop below 1.1020.
On the weekly chart, last week’s rally formed a long white candlestick, adding credence to our view that the erratic rise from 1.0340 low is still in progress and test of previous resistance at 1.1300 is likely, however, a break of previous resistance at 1.1366 is needed to retain bullishness and signal early downtrend has ended at 1.0340, bring further rise to 1.1428 but reckon 1.1500 would hold and price should falter well below another previous chart resistance at 1.1616.
On the downside, expect pullback to be limited to 1.1120-30 and bring another rise later to aforesaid upside targets. Below the upper Kumo (now at 1.1070) would defer and risk weakness to 1.1025 (previous resistance now support) but break there is needed to signal top is formed instead, bring further fall to 1.0965-70 but support at 1.0922 (last week’s low) should remain intact, price should stay well above last week’s low at 1.0839, bring another rise later.