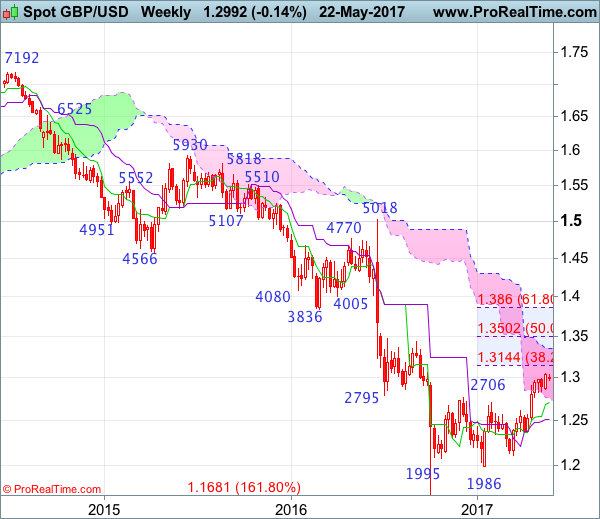
Weekly
• Last Candlesticks pattern: Long white candlestick
• Time of formation: 16 Jan 2017
• Trend bias: Down
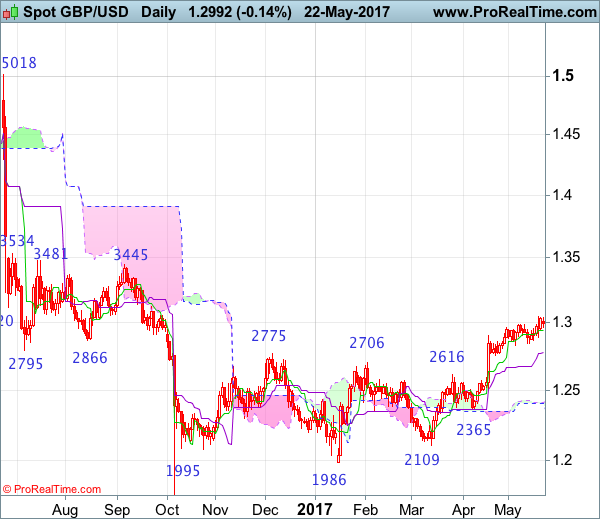
Daily
• Last Candlesticks pattern: Long white candlestick
• Time of formation: 18 Apr 2017
• Trend bias: Near term up
GBP/USD – 1.3003
Cable found renewed buying interest at 1.2844 earlier and has resumed recent upmove as the pair broke above previous resistance at 1.2991, confirming recent upmove from 1.1986 low (Jan low) is still in progress and bullishness remains for this move to bring retracement of early downtrend, hence further gain to 1.3050-60, then 1.3100 would be seen, however, loss of near term upward momentum should prevent sharp move beyond 1.3140-50 (38.2% Fibonacci retracement of 1.5018-1.1986) and reckon 1.3200 would hold on first testing, risk from there is seen for a retreat to take place later.
On the downside, whilst initial pullback to the Tenkan-Sen (now at 1.2946) is likely, reckon downside would be limited to support at 1.2889 and bring another rise to aforesaid upside targets. Only a drop below support at 1.2844 would abort and suggest top is possibly formed, bring correction to 1.2800, then towards previous support at 1.2757 which is likely to hold from here, bring another rise later. A daily close below support at 1.2757 would provide confirmation, bring weakness to 1.2700-10 and then towards 1.2650-60 but previous resistance at 1.2616 should remain intact.
Recommendation: Buy at 1.2900 for 1.3100 with stop below 1.2800.
On the weekly chart, as cable has maintained a firm undertone after recent rise, adding credence to our view that the erratic upmove from 1.1986 low (2017 low) is still in progress and bullishness remains for this move to bring retracement of early decline to 1.3090-00, however, reckon upside would be limited to 1.3140-50 (38.2% Fibonacci retracement of 1.5018-1.1986) and price should falter well below 1.3200-10, risk from there is seen for a retreat to take place later this month.
On the downside, although initial pullback to 1.2940-50 cannot be ruled out, reckon downside would be limited to 1.2900 and bring another rise later. Below support at 1.2844 would defer and risk pullback to 1.2800 but only break of support at 1.2757 would provide confirmation, bring further fall to previous resistance at 1.2706, once this level is penetrated, this would provide confirmation, bring subsequent retreat to 1.2640-50. Looking ahead, a drop below another previous resistance at 1.2616 suggest the erratic rise from 1.1986 has ended instead, bring weakness to 1.2550-60 but reckon support at 1.2515 would remain intact.