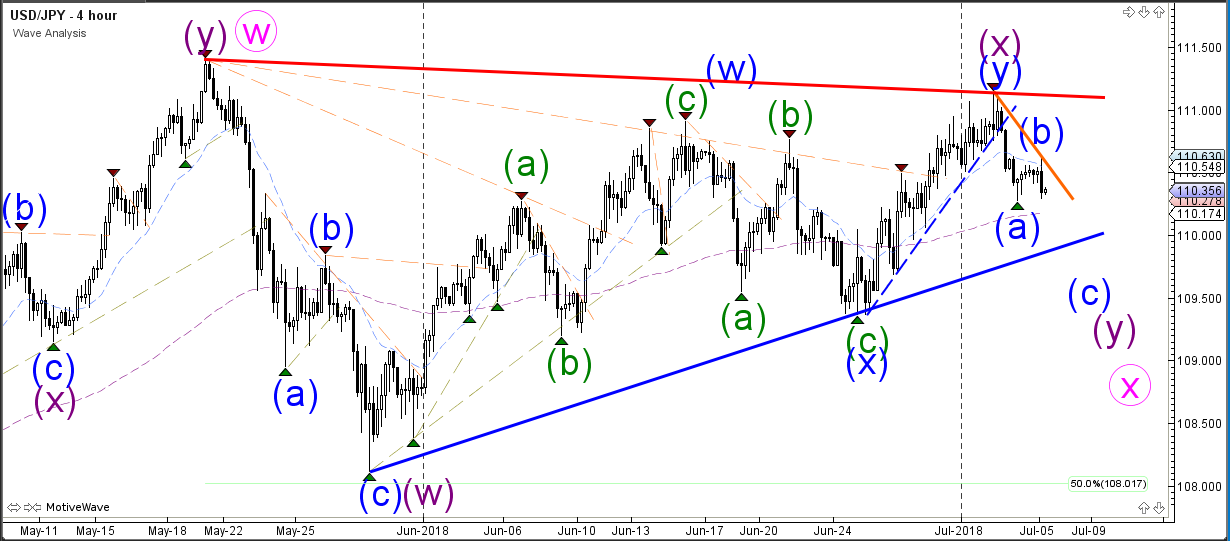
The USD/JPY is building a triangle chart pattern which is indicated by the support (blue) and resistance (red) trend lines. Price will need to break above or below the chart pattern before a larger breakout could be expected. The wave patterns are probably showing an expanded wave X (pink) correction which indicates more bearish pressure but price must break below the support trend line (blue) to confirm this.
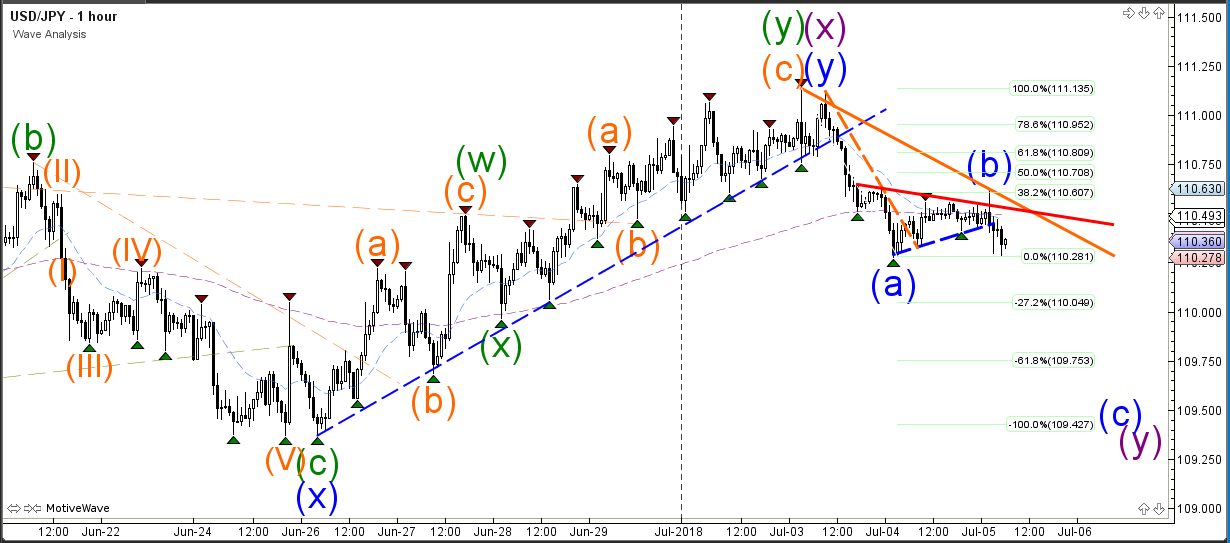
The USD/JPY retraced back and bounced at the 38.2% Fibonacci retracement level, which could complete a wave B (blue) correction, after breaking through the resistance trend line (dotted orange). If price breaks below the bottom then a bearish breakout towards the Fibonacci levels of wave C is possible. Although there is still a chance that price might retrace to a deeper Fib level.