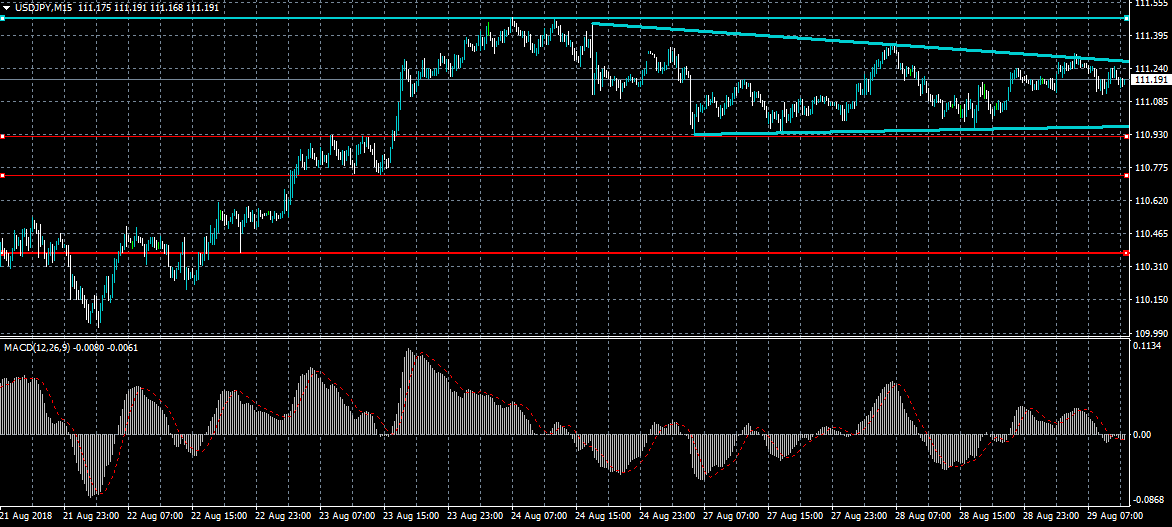
The US dollar remains trapped in a limited range against the Japanese yen currency on Wednesday, as price continues to hover around the 111.00 level. A bullish descending triangle pattern is now visible on the USDJPY pair, indicating that breakout may soon occur. Traders and investors now look to the US session, where we see the release of key GDP and PCE data from the United States economy.
The USDJPY pair is only intraday bullish while trading above the 111.28 level, key resistance is found at the 111.50 and 112.05 levels.
If the USDJPY pair trades below the 110.92 level, sellers will likely test towards the 110.55 and 110.10 support levels.