EUR/USD
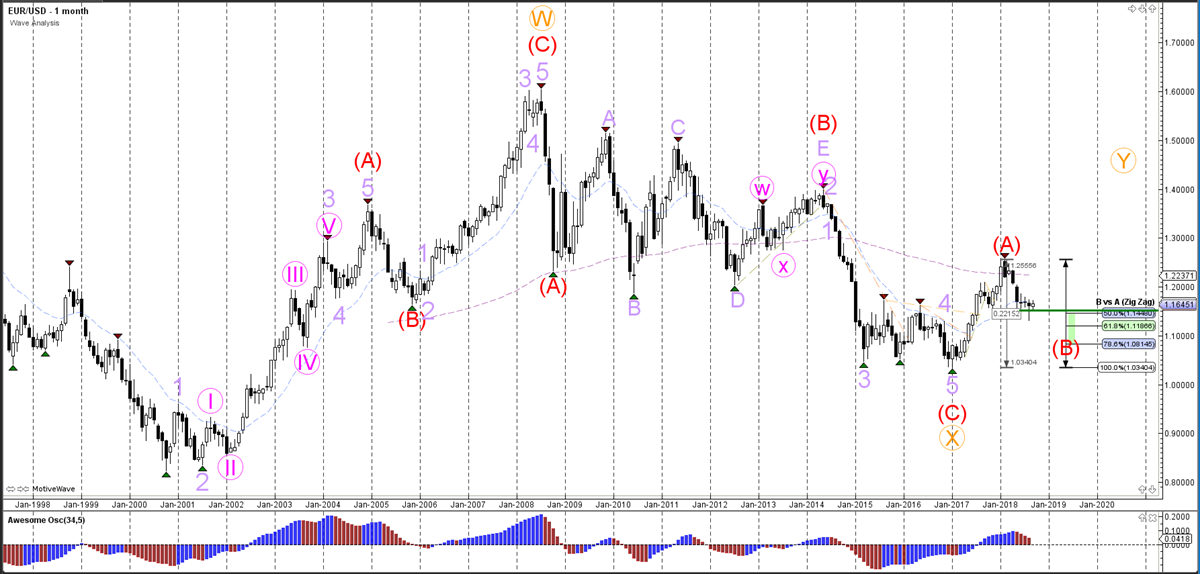
The EUR/USD bounced at the previous top, which could indicate that price will make a deeper pullback within wave B (purple) towards the Fibonacci retracement levels. A break above the previous top could indicate a bullish wave C (purple).
Daily chart:
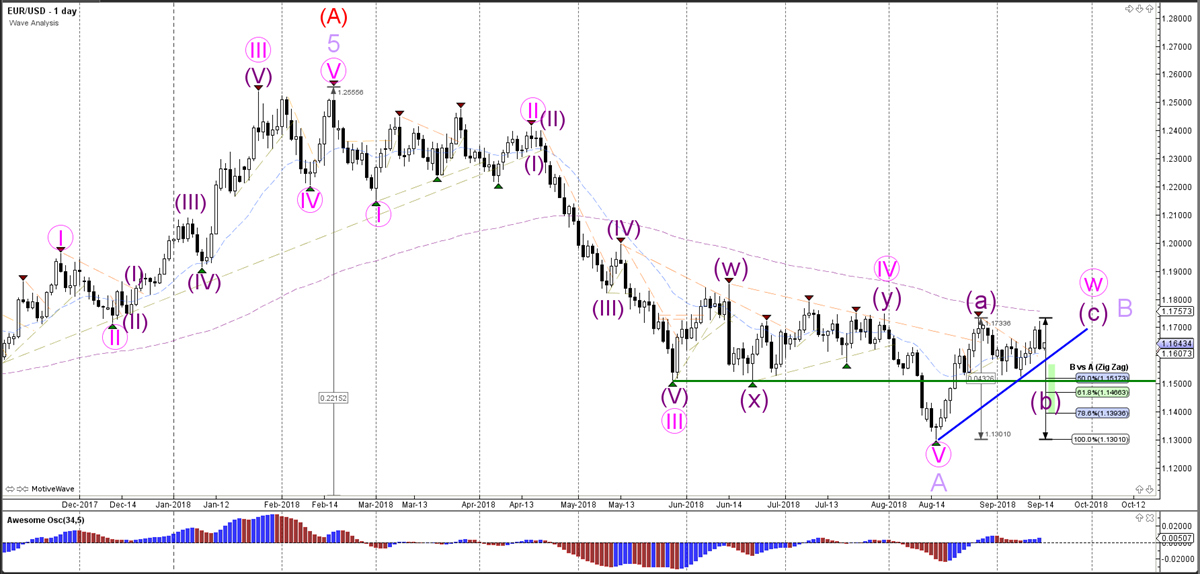
The EUR/USD is probably building a bearish ABC (purple) correction within wave B (red).
Weekly chart:
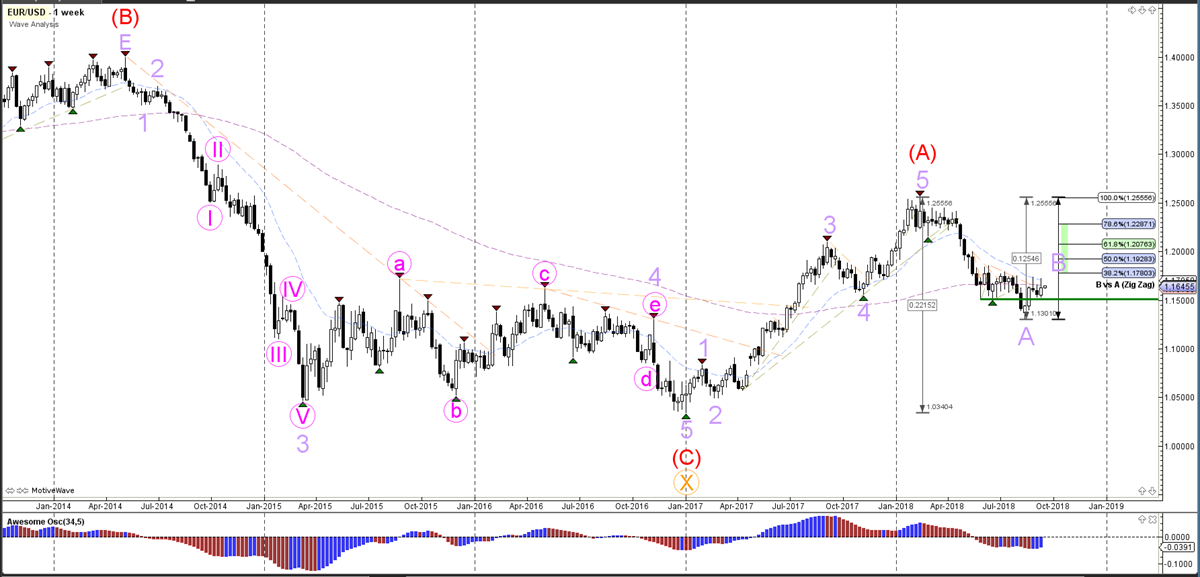
The EUR/USD has completed wave A (red) and price is most likely retracing to the Fibonacci levels of wave B (red).
Monthly chart
GBP/USD
The GBP/USD bullish breakout above the resistance trend line (dotted orange) and is expanding the wave 4 (pink) correction.
Daily chart:
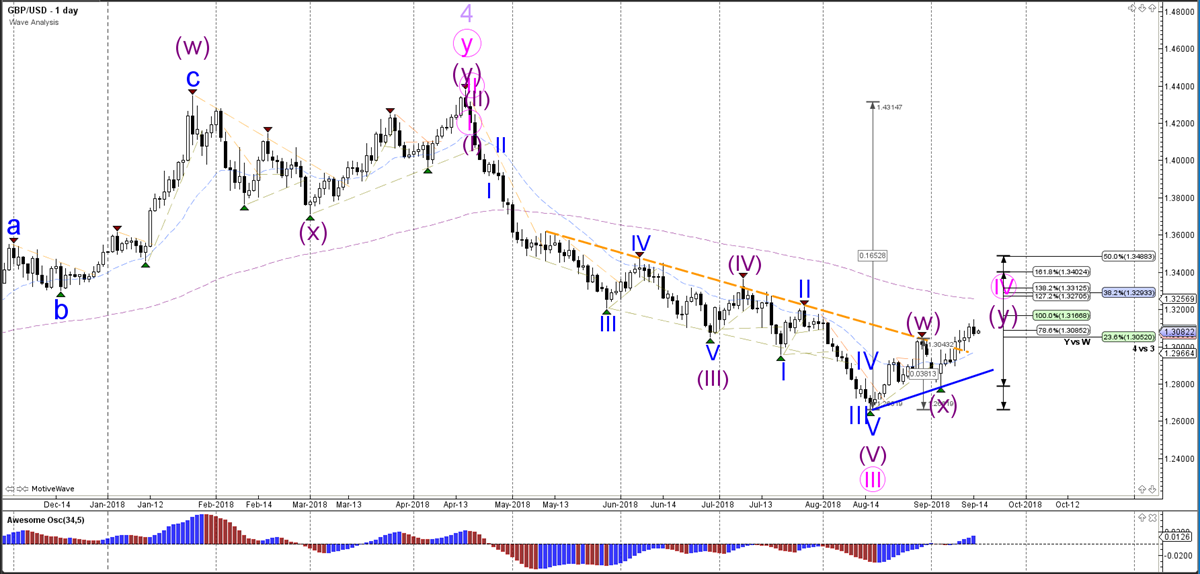
The GBP/USD has probably started the bearish wave 5 after price has completed a wave 4 (light purple) correction.
Weekly chart:
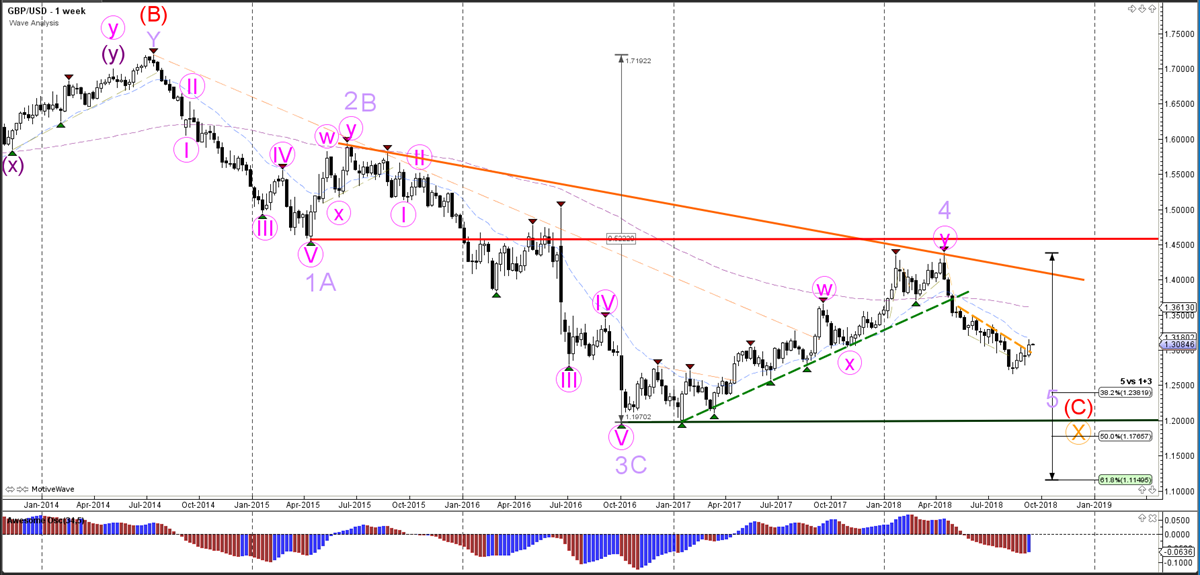
The GBP/USD bearish breakout is probably indicating the start of wave 5 (purple), whereas a bullish break above resistance (red) indicates that a different wave pattern is valid.
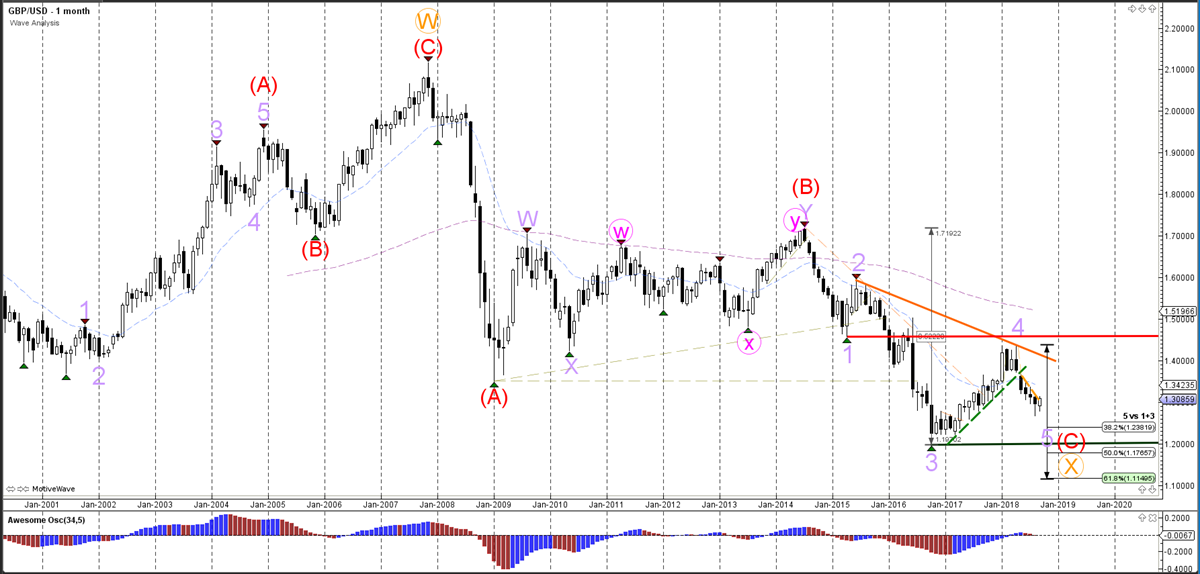
Monthly chart:
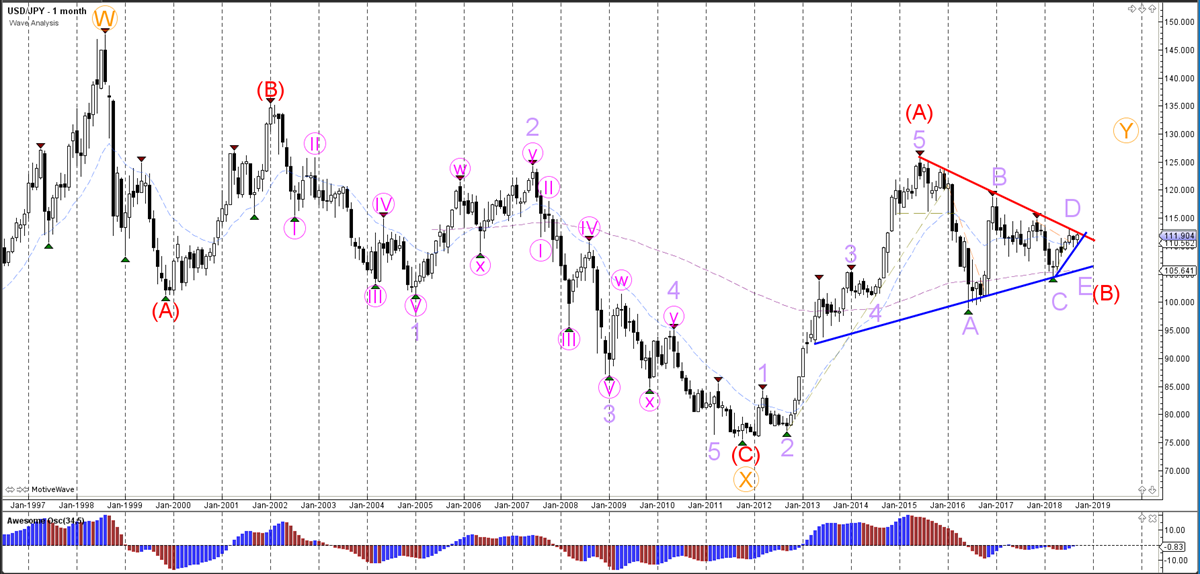
USD/JPY
The USD/JPY is making an ABC (purple) correction within wave X (pink) and is testing key Fibonacci resistance levels.
Daily chart:
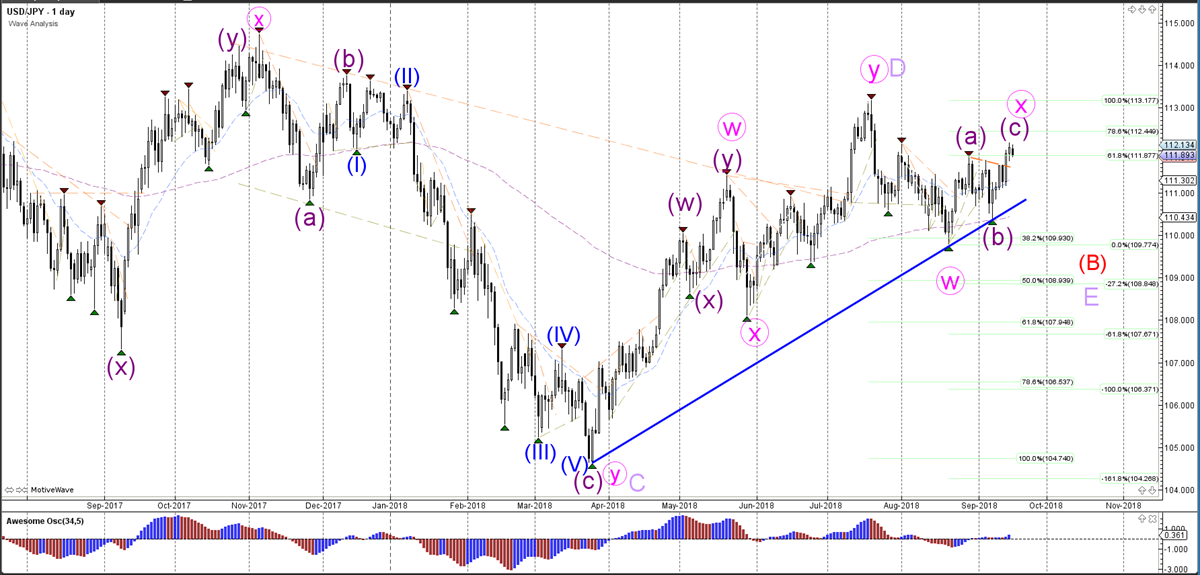
The USD/JPY could be building an ABCDE triangle (light purple) within wave B (red).
Weekly chart:
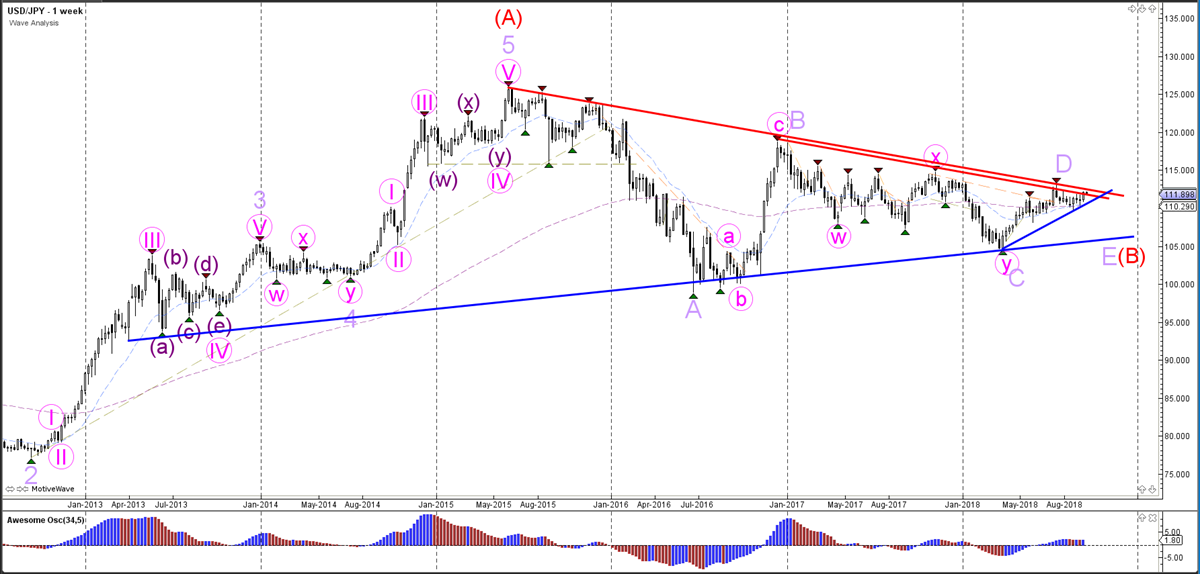
The USD/JPY is in the wave E (light purple) of the triangle pattern.
Monthly chart: